Noninvasive Estimation of Cerebral Blood Flow Using Image-Derived Carotid Input Function in H215O Dynamic PET Kyeong Min Kim, Member, IEEE, Hiroshi Watabe, Member, IEEE, Miho Shidahara, Ji Young Ahn, Seungjin Choi, Nobuyuki Kudomi, Kohei Hayashida, Yoshuinori Miyake, Hidehiro Iida, Member, IEEE
Abstract—For the quantitation of cerebral blood flow (CBF) 15 using H2 O PET, the measurement of arterial input function (AIF) is essential. In this study, for the simplified quantitation, we present a method for the blind and noninvasive extraction of carotid input function (CIF) from dynamic PET images. On 15 15 8 healthy volunteers, the PET scans of C O and H2 O were sequentially performed with arterial blood sampling using β 15 detector. With the inhalation of C O gas, dynamic PET data was acquired. And then after the injection of H215O, dynamic 15 PET scans of H2 O was perform. For 4 subjects, PET data for both rest and Acetazolamide (ACZ)-induced stress states were acquired, respectively. In the transverse dynamic images of 15 15 C O and H2 O, the regions of dynamic images including carotid artery were selected by masking. Non-negative matrix factorization (NMF) algorithm was used to extract the CIF from the selected dynamic images. The partial volume 15 correction estimated from dynamic C O image, was applied to the extracted CIF. Whole brain CBF was estimated by kinetic analysis based on single compartment model. The error was analyzed using the area under the curve (AUC) and estimated CBF. NMF provided the good separation of the component of 15 15 CIF from others in both images of C O and H2 O. The shape of estimated CIF by NMF was similar with AIF measured by blood sampling. The AUC between the measured AIF and the estimated CIF was not so different at both rest and ACZ states. The difference of CBF before and after the injection of ACZ was also same between the measured AIF and the estimated CIF. These results show that NMF technique may be a tool for the noninvasive extraction of carotid input function, and this carotid input function might be used in the noninvasive 15 quantitation of CBF using H2 O PET.
This work was supported by the Japanese Cardiovascular Research Foundation. K. M. Kim, H. Watabe, N. Kudomi, and H. Iida are the Department of Investigative Radiology, National Cardiovascular Center – Research Institute, Suita, Osaka 565-8565, Japan (e-mail:
[email protected]). M. Shidahara is with the Department of Technology of Quantum engineering, Tohoku University, Sendai, Miyagi, Japan. J. Y. Ahn is with the Department of Physics, Ewha Womans University, Seoul, Korea. S. J. Choi is with the Department of Computer Science and Engineering, Pohang University of Science and Technology, Pohang, Korea. K. Hayashida and Y. Miyake are with Department of Radiology, National Cardiovascular Center, Osaka, 565-565, Japan.
I.
study of cerebral blood flow (CBF) using InHtheOquantitative PET and kinetic analysis, the measurement of 15 2
arterial input function (AIF) is essential for the accurate estimation of CBF. Since it is difficult to obtain the AIF information from brain PET image, AIF for the CBF estimation has been usually obtained by additional measurement using arterial blood sampling or β-detector, which are invasive and cumbersome to both patient and clinician in practice. So far there were many works to obtain input function non-invasively in PET study [1]-[10]. There were several studies for the noninvasive extraction of input function [11]-[12] or the direct quantitation of functional parameter using brain PET image [13]-[17], to overcome the inconveniences due to the additional measurement of AIF. In this study, we present a method for the noninvasive estimation of CBF using carotid input function (CIF), which was non-invasively extracted from the dynamic H215O PET images. II. METHODS A. Data Acquisition 1) Dynamic PET Scan PET scans of C15O and H215O (ECAT EXACT 47, Siemens-CTI, Knoxville, TN) were performed on 8 healthy volunteers with arterial blood sampling using β-detector, respectively. After a transmission scan, with the inhalation (~ 1 min) of C15O gas, dynamic emission data was obtained with 19 frames (5 sec × 12 + 15 sec × 8 + 60 sec × 1 + 240 sec). And then, after the slow bolus (~20 sec) injection of 1110 MBq H215O, dynamic PET was performed with 24 frames (5 sec × 12 + 15 sec × 8 + 30 sec × 4) at rest state. For 4 subjects among the above volunteers, additional dynamic H215O emission scan was acquired with the injection of Acetazolamide (ACZ), using same protocol. AIF acquired by β-detector was corrected for the physical decay, delay, and dispersion, and then converted to the PET image counts using calibration factor.
0-7803-7324-3/02/$17.00 © 2002 IEEE
1282
INTRODUCTION
2) Image Reconstruction PET data were reconstructed to the dynamic images by OSEM algorithm (iteration = 6, subset = 16), including measured attenuation correction. After the reconstruction, Post smoothing by gaussian filter (kernel size = 6 mm) was applied to reconstructed dynamic images. B. Non-negative matrix factorization algorithm In this study, we employed the non-negative matrix factorization (NMF) algorithm for the blind separation of the physiological components of carotid artery and surrounding tissue. NMF algorithm is a kind of independent subspace analysis (ISA) [18]. This algorithm is based on the statistical model with Poisson noise, and uses the non-negative (e.g. positive) constraint, which is the characteristics of physiological parameters, in the process of matrix factorization. NMF approximately factorizes the n × m image data (V) into W (n × r) and H (r × m) matrices, with assumption of V≈WH. In the factorization process, the following equations are used for the update the information.
Wia ← Wia Wia ←
Viµ (WH ) iµ
µ
D. Estimation of partial volume correction factor from C15O image CIF of C15O gas study was obtained with the same procedure of H215O study, except for the duration of frame summing (1~3 min) for masking the region of carotid artery (Fig. 1(a)), and the number of component (= 1) in the masked dynamic data. Extracted CIF of C15O was compared with AIF of C15O obtained by β-detector, and the scale factor for partial volume correction was calculated as the ratio of the area under the curves (AUC) of CIF and AIF.
H aµ
Wia W ja
(1)
j
H aµ ← H aµ
µ
Wia
Viµ (WH ) iµ
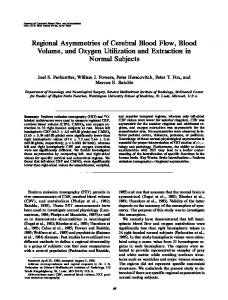
C. Extraction of carotid input function from H215O image The dynamic H215O images of initial 8 frames (during 40 sec) were summed to single frame image to clarify the region of carotid artery. In the transverse slices of the summed image (Fig. 1(b)), the rectangular mask was put on the region including CA (Fig. 2(a)), and applied to whole dynamic images (Fig. 2(b)). The masked dynamic images were used in the extracting CIF. The dynamic data of 4dimension (plane × slice × frame) was transformed to 2dimensional data (V in the above equation, frame × pixel), which is corresponding to time activity curve (TAC)(W in the above equation) on pixel basis (H in the above equation). The component of CIF was extracted from the masked dynamic data, by NMF algorithm with the assumption of only 2 components (CIF and surrounding tissue). The activity of CIF was restored by multiplying the activity of CIF component image to the time weight curve (TWC) of CIF component, which was calculated as the mean activity value within the area estimated by the 90% threshold of maximum value of CIF component image. The partial volume correction was applied on the CIF because of the intrinsic count loss of CA activity due to the relatively smaller size of carotid artery (≤ 5 mm of radius) than FWHM (~ 6 mm) of PET scanner. The procedure of extracting CIF is explained schematically in Fig. 3.
1283
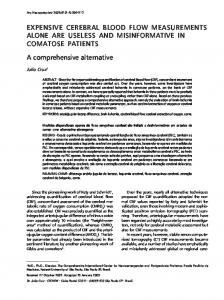
Fig. 1. Frame-summed images of C15O and H215O for masking area of carotid artery. (a) C15O image summed with the images from 13th to 21 th frames. (b) H215O image summed the images from 1st to 8th frames.
Fig. 2. Selection of carotid artery region from summed H215O image. (a) Drawing the mask of rectangular shape on the region including carotid artery. (b) Matrix data selected by mask, which was used for the further processing.
16.4 ± 19.4% for ACZ-induced stress state (Fig. 8). The CBF by CIF showed the good relationship with that by AIF (r = 0.85, CBFCIF = 1.27×CBFAIF – 0.05)(Fig. 9). The increase of CBF due to ACZ was almost same for both input function (29.1 ± 12.0% for AIF and 27.4 ± 22.0% for CIF).
Fig. 3. Data processing flow of extracting CIF from the H215O dynamic brain PET image.
E. Data Analysis The data with initial 90 sec was used in the analysis. AUC of estimated CIF was compared with that of measured AIF, for accuracy evaluation. Whole brain CBF was estimated using the brain time activity curve (TAC) obtained by region of interest (ROI), drawn on the single slice of mid-brain. AIF and CIF were applied to the CBF estimation by kinetic analysis based on single compartment model [19] using equation (2), respectively.
CT (t ) = f ⋅ Ca ⊗ e − f ⋅t / p
(2)
where CT(t) is tissue TAC, Ca(t) is input TAC, f is CBF, and p is partition coefficient which was fixed to 0.8. The values of CBF with both AIF and CIF were compared, and the amount of CBF increase due to ACZ was also calculated between AIF and CIF. III.
Fig. 4. Both components of CIF and surrounding tissue, extracted from H215O dynamic images, by NMF algorithm. (a) TWC and basis image of CIF component, (b) TWC and basis image of surrounding tissue component.
Fig. 5. Comparison of measured AIF and estimated CIF in the C15O study. In this case, the scale factor for partial volume effect was 0.26.
RESULTS
NMF provided the good separation of component of CIF from the other components surrounding carotid artery of H215O data, in both TWC shape and component image (Fig. 4). The estimated CIF was similar with measured AIF, in both of C15O (Fig. 5) and H215O (Fig. 6) studies, although there were the small underestimations of activities after the peak point in H215O CIF (Fig. 6). The scale factor for partial volume correction estimated from dynamic C15O images was 0.24 ± 0.03. AUC of H215O CIF was a little underestimated overall. The difference of CIF was 9.1 ± 5.2% for the rest, 8.7 ± 7.6% for the ACZ-induced stress state, and totally 9.0 ± 5.8%, in comparison with that of AIF (Fig. 7). The values of CBF by CIF were 0.40 ± 0.06 ml/g/min and 0.56 ± 0.14 ml/g/min at rest and ACZ states, respectively, which were higher than those by AIF (0.34 ± 0.03 ml/g/min for rest and 0.48 ± 0.06 ml/g/min for ACZ), by 15.5 ± 11.6% for rest and
1284
Fig. 6. The shapes of measured AIF and estimated CIF of H215O study at rest state.
promising for the blind extraction of physiological component in the PET study. And we need a further study to get the data of better image quality, for the more accurate non-invasive estimation of CIF in H215O study. In conclusion, NMF algorithm was applicable to the blind extraction of carotid input function in the H215O brain study, and this non-invasive method for CIF extraction might be useful in the quantitative estimation of CBF in the H215O study. V. REFERENCES [1] Fig. 7. Percentage difference of AUC between AIF and CIF. [2]
[3]
[4]
[5]
[6]
[7]
Fig. 8. Comparison of CBF by CIF with CBF by AIF.
[8]
[9]
[10]
[11]
[12]
[13] Fig. 9. Relationship between CBF by AIF and CBF by CIF.
[14]
IV. DISCUSSION AND CONCLUSION
[15]
We found in this study that carotid input function could be non-invasively extracted from dynamic PET image by use of NMF algorithm. Non-invasively estimated CIF was similar with the measured arterial input function. And the CBF by CIF was comparable with that by AIF, although there was a small overestimation, due to the small underestimation of CIF. These results reveal that NMF algorithm could be
[16]
[17]
[18] [19]
1285
H.M. Wu, C.K. Hoh, Y. Choi, et al., “Factor analysis for extraction of blood time-activity curves in dynamic FDG-PET studies,” J Nucl Med, vol. 36, pp. 1714-1722, 1995. H.M. Wu, C.K. Hoh, D.B. Buxton, et al., “Quantitation of myocardial blood flow using dynamic nitrogen-13-ammonia PET studies and factor analysis of dynamic structures,” J Nucl Med, vol. 36, pp. 2087-2093, 1995. H.M. Wu, S.C. Huang, V. Allada, et al., “Derivation of input function from FDG-PET studies in small hearts,” J Nucl Med, vol. 37, pp. 17171722, 1996. Y. Choi, S.C. Huang, R.A. Hawkins, et al., “A refined method for quantitation of myocardial oxygen consumption rate using mean transit time with carbon-11-acetate and dynamic PET,” J Nucl Med, vol. 34, pp. 2038-2043, 1993. Y. Choi, S.C. Huang, R.A. Hawkins, et al., “A simplified method for quantitation of myocardial blood flow using nitrogen-13-ammonia and dynamic PET,” J Nucl Med, vol. 34, pp. 488-497, 1993. Y Choi, R.A. Hawkins, S.C. Huang, et al., “Parametric images of myocardial metabolic rate of glucose generated from dynamic cardiac PET and 2-[18F]fluoro-2-deoxy-d-glucose studies,” J Nucl Med, vol. 32, pp. 733-738, 1991. J.Y. Ahn, D.S. Lee, J.S. Lee, et al., “Quantitation of regional myocardial blood flow using dynamic H215O PET and factor analysis,” J Nucl Med, vol. 42, pp. 782-787, 2001. H. Iida, C.G. Rhodes, L.I. Araujo, et al., “Noninvasive quantitation of regional myocardial metabolic rate for oxygen by use of 15O2 inhalation and positron emission tomography. Theory, error analysis, and application in humans,” Circulation, vol. 94, pp. 792-807, 1996. H. Watabe, M.A. Channing, C. Riddell, et al., “Noninvasive estimation of the aorta input function for measurement of tumor blood flow with [15O] water,” IEEE Trans Med Img, vol. 20, pp. 164-74, 2001. J.S. Lee, D.S. Lee, J.Y. Ahn, et al., “Blind separation of cardiac components and extraction of input function from H215O dynamic myocardial PET using independent component analysis,” J Nucl Med, vol. 42, pp. 938-943, 2001. H. Iida, S. Miura, Y. Shoji, et al., “Noninvasive quantitation of cerebral blod flow using xygen-15-water and a dual-PET system,” J Nucl Med, vol.39, pp.1789-1798, 1998. D. Feng, K. P. wong, C. M. Wu, et al., “Simultaneous extraction of physiological and input function parameters from PET measurements,” Quanitative Functional Brain Imaging with Positron Emision Tomography (ed. R.E. Carson et al). Academic, New York, pp.321-327, 1998. J. E. Litton, “Input fucntion in PET brain studues uisng MR-defined arteries,” J Comput Assist Tomogr, vol.21, pp.907-909, 1997. K. Chen, D. Bandy, E. Reiman, et al., “Noninvasive quantitation of the cerebral metabolic rate for glucose using positron emission tomography, 18F-fluoro-2-deoxyglucose, the Patlak method, and an image-derived input function,” J Cereb Blood Flow Metab, vol.18, pp.716-723, 1998. H. Watabe, M. Itoh, V. J. Cuningham, et al., “Noninvasive quantitation of rCBF using positron emission tomography,” Quantitation of Brain FunctionUsing PET (ed. R. Meyer et al). Academic, New York, pp.191200, 1996. R.E. Carson, Y. Yan, R. Schrager, “Absolute cerebral blood flow with[15O]water and PET,” Quantitation of Brain FunctionUsing PET (ed. R. Meyer et al). Academic, New York, pp.185-190, 1996. E.V.R. Di Bella, R. Clackdoyle, G.T. Gullberg, “Blind estimation of compartmental model parameters,” Phys Med Biol, vol.44, pp.765-780, 1999. D.D. Lee, H.S. Seung, “Learning the parts of objects by non-negative matrix factorization,” Nature, vol.401, pp.788-791, 1999. P. Herscovitch, J. Markham, M.E. Raichle, “Brain blod flow measured with intraveneous H215O,” J Nucl Med, vol.24, pp.782-789, 1983.