Nonlinear Adaptive Control Method for Treatment of Uncertain Hepatitis B Virus Infection
Omid Aghajanzadeh 1, Mojtaba Sharifi 2,1,*, Shabnam Tashakori 1, Hassan Zohoor 1
1
Department of Mechanical Engineering, Sharif University of Technology, Tehran, Tehran, 11155-9567, Iran
2
Department of Electrical and Computer Engineering, University of Alberta, Edmonton, Alberta, T6G 1H9
Canada * Corresponding author. Tel.: +1-587-712-4147. E-mail:
[email protected] .
Nonlinear Adaptive Control Method for Treatment of Uncertain Hepatitis B Virus Infection
by Nowak et al. [6] is more general and has been used and validated in previous studies on the HBV infection dynamics. Some control methods have been used for the antiviral therapy of infectious diseases such as optimal closed-loop control [7] and model predictive control [8] for the HIV infection. Sheikhan and Ghoreishi [5] have investigated a fuzzy controller using five optimization algorithms for the treatment of a basic HBV infection. Moreover, they have designed and compared three optimal controllers [9] for the HBV by employing a covariance matrix adaptation-evolution strategy. Different optimal control techniques have been suggested for the chemotherapy of the cancer disease by adjusting the drug usage based on mathematical models [10-12]. The optimal therapy [13] has also been used for the HBV infection resulting in a logistic hepatocyte growth. Ntaganda and Gahamanyi [14] have utilized a fuzzy logic approach to find an optimal solution for the HBV antiviral therapy. Su and Sun [15] have studied an optimal control strategy for anti-HBV infection by the combination of traditional Chinese therapy and Western medicine methods. In addition, a multirate model predictive control (MPC) method [16] has been used to find an optimal treatment schedule for the HBV infected patients. However, the realistic behavior of a disease may be different from the response of its mathematical model due to the presence of uncertainties. These dynamic uncertainties are usually different in various bodies and conditions (e.g., age, life style and local climate). Therefore, the modeling uncertainties should be taken into account for designing a treatment strategy using a drug delivery controller. For this purpose, Moradi et al. [17] have suggested an adaptive control method for the drug usage in order to reduce the cancer tumors' volume using an uncertain chemotherapy model. Betechuoh et al [18] have proposed a method based on the neural networks to control the HIV infection. Some other adaptive control strategies [19-21] have been designed for the HIV dynamics having modeling uncertainties. A control method has not yet been developed for the hepatitis type B virus infection in the presence of modeling uncertainties. Accordingly, in this study, a nonlinear adaptive control strategy is designed for the treatment of the HBV infection with uncertain nonlinear dynamics for the first time. Note that the parameters values of the original nonlinear HBV model and their uncertainties influence the performance of the previous model-based controllers. However, completely uncertain parameters of the HBV dynamic model are considered for designing the proposed nonlinear adaptive controller. Note that the magnitudes of uncertainties do not affect the controller's structure. Moreover, unlike the previous controllers (e.g., [16]) that required a linearization of the nonlinear HBV model around an operating point, the
Abstract In this paper, a nonlinear adaptive control method is presented for the treatment of the Hepatitis B Virus (HBV) infection. Nonlinear dynamics of the HBV, modeling uncertainties and three state variables (the numbers of uninfected and infected cells and free viruses) are taken into account. The proposed control law is designed for the antiviral drug input such that the number of free viruses and consequently the number of infected cells decrease to the desired values. An adaptation law is also presented to overcome modeling uncertainties by updating estimations of the system parameters during the treatment period. The stability of the process and convergence to desired state values are investigated by utilizing the Lyapunov theorem. The performance of the proposed adaptive control strategy is evaluated via comprehensive simulations employing the nonlinear HBV model with different levels of uncertainty. The consideration of modeling uncertainties is in accordance with the reality where the HBV has different characteristics in different bodies. According to the obtained results, the proposed strategy can achieve the desired control objectives (reduction of viruses and infected cells) by adjusting the drug usage. Keywords: Nonlinear adaptive control, Hepatitis B virus (HBV) infection, Antiviral drug usage, Lyapunov stability.
1. Introduction More than 2 billion people alive (nearly 1 out of 3 people) have been infected by the Hepatitis B virus (HBV)[1]. The population of HBV carriers is nearly 400 million and 75% of them are in the Asia. Accordingly, the HBV causes about 1 million deaths each year in the world. Only in China, 15 million newly infected people are detected in each year. Among them, more than 30 million infections are chronic, and more than 350 thousand die annually from HCC and cirrhosis [2]. Mathematical modeling is an appropriate tool to investigate the behavior of the HBV infection. Mathematical models have been also used to study other viral infection dynamics such as the human immunodeficiency virus (HIV) infection [3] and the hepatitis C virus (HCV) infection [4]. In these models, the system’s biology has been taken into account as some differential equations represent the dynamics of the virus, immune system and host cells [5]. It should be mentioned that the available drugs are not able to clear the HBV infection; however, they stop the virus replication and prevent it from damaging the liver [2]. Therefore, some dynamic models have been developed for predicting the HBV changes during the antiviral therapy [2, 6]. Among these models, the virus infection model suggested
1
proposed nonlinear control scheme can achieve its objective for the treatment without using any linearization. The objective of this control strategy is reduction of the number of viruses per unit volume of the blood by converging to a desired value. As a result of achievement to this objective, the cells infected by the HBV will also decrease and the uninfected cells will increase to a steady state population. For this purpose, the antiviral drug usage is employed as the applicable control input for tracking the descending desired number of viruses. The stability of the controlled process and tracking convergence are proved using the Lyapunov method. The rest of this paper is arranged as follows. Section 2 describes the nonlinear mathematical model of the HBV infection. The controller is designed and detailed in Sec. 3, and the Lyapunov stability analysis is presented in Sec. 4. The HBV model becomes dimensionless in Sec. 5 for the simulations that are presented in Sec. 6. Finally, the concluding remarks are summarized in Sec. 7.
3. Design of the Controller In this section, the nonlinear adaptive control method is proposed for the mentioned HBV model (1)-(3). The objective of this adaptive control method is decreasing the number of viruses inside the body by the antiviral drug usage. By employing this drug delivery control method, the number of free viruses (v) decreases via tracking a descending desired value ( ). After a limited time, the number of viruses decreases and converges to the zero and the magnitude of the term in Eqs. (1) and (2) decreases to zero. As a result, it can be proved that the number of infected cells (y) reduces and the number of uninfected cells (x) increases after a bounded time based on their dynamics (1) and (2). Moreover, the proposed controller becomes robust against parametric uncertainties of the nonlinear HBV model via employing an adaptation law to appropriately update the parameters’ estimation. Schematic diagram of the proposed nonlinear adaptive controller is shown in Fig. 1.
2. Nonlinear Mathematical Model of HBV At first, it is essential to choose an appropriate model in order to analyze the HBV behavior. The validated nonlinear HBV model is represented by the following set of differential equations [6]: (1) (2) Fig 1. Schematic diagram of the nonlinear adaptive control strategy for antiviral therapy of the HBV infection.
(3)
Now, the HBV virus dynamics (4) is reformulated as
where the state variables are the numbers of uninfected (x) and infected (y) cells, and the number of free viruses (v) per unit volume of the blood. The definitions of constant parameters used in the above model are listed in Table 1 [5].
[
] ̇
The above equation can be rewritten in terms of ̇
Definition Rate of production of new target cells Death rate of target cells Rate of infection of new target cells Death rate of infected cells Rate of production of virions per infected cell Clearance rate of free virions Efficacy of the drug coefficient
p c
The right side of Eq. (6) is nonlinear in terms of the variables ( , ̇ and ); however, one can parameterize (6) in terms of the model parameters. Accordingly, considering the arbitrary variable instead of ̇ , Eq. (6) can be represented as follows: (7)
where is the regressor matrix and consists of certain functions of the variables , v and y. The vector contains the unknown dynamic parameters of the HBV disease. Based on Eq. (7), the matrix and the vector are obtained as
Now, by considering the factor of drug usage in the hepatitis B virus dynamics, Eq. (3) is represented via the following form [5]: ̇
[
]
as (6)
Table 1. Parameter definitions [5].
Parameter λ d β
(5)
(4)
where is the normalized rate of antiviral drug usage that should be in the range of [0 1]. In other words, the physiological constraint of this HBV treatment process is limitation of the drug rate: 0 ≤ ≤ 1. The parameter also specifies the efficacy of drug therapy.
[
]
(8)
[
]
(9)
The variable is defined in this work as the following form, which will be used in the controller design:
2
̇
(10)
By rearranging the above equation, one can write:
where is a positive constant and is the desired value for the number of viruses that will be tracked by the adaptive controller. Now, the nonlinear adaptive control law for the rate of drug usage u is defined as ̇
̃ ̂̂
̂
̂ ̂̂
̇ ( ̇ (
(11)
̃̇
where ̂ is the vector of estimated parameters. The required measurements for the proposed controller are the numbers of infected cells (y) and viruses (v) per unit volume of the blood that are used in the control law (11). There are currently different techniques in multiplicity of infection (MOI) to quantify viruses and infected cells inside liquid samples [22]. Accordingly, it is considered that these measurements are available in this study similar to the previous works on modeling [6, 16, 24] and control [9, 13-15] of the HBV. In order to update this parameters’ estimation, the adaptation law is designed as
̃
̃
(19)
̃̇
̃
(20)
̃
̃ ̃
̂̇
̃
(21)
Employing the parameters’ adaptation law (14), the time derivative of Lyapunov function (21) is simplified to: ̇
̃
(22)
Since is a positive constant, the time derivative of Lyapunov function is negative semi-definite. Therefore, according to the Barbalat’s Lemma and Lyapunov stability theorem [23], it can be proved that ̃ converges to the zero. Proposition: According to the Lyapunov theorem [23] and due to Eqs. (19) and (22), the proposed nonlinear adaptive control strategy ensures the stability of the process and tracking convergence ( ̃ . In other words, if the rate of antiviral drug usage is adjusted according to the presented control law (11), the number of free hepatitis B viruses will converge to the desired descending value ( .
In this section, the nonlinear closed-loop dynamics of the process employing the proposed controller is investigated first. Thus, the control law (11) is substituted in the virus dynamics (6) and by adding and subtracting the term ̇ , we have: ̇
̂
(18)
where ̃̇ ̂̇ , because is a constant vector and ̇ . Accordingly, using the closed-loop dynamics (18), Eq. (20) is obtained as
4. Closed Loop Dynamics and Lyapunov Stability Analysis
̂̂
(17)
̃
̃
̃ ̃̇ ̇
where the adaptation gain is a positive definite matrix. Accordingly, it will be proved that by employing the proposed nonlinear control law (11) or (13) and the adaptation law (14), the number of viruses decrease and converges to the desired value in the presence of parametric uncertainties of the model.
̇
̃
Then, the time derivative of V is determined:
̇
̂ ̂̂
)
̃)
̃
(14)
̇
̂ ̂̂
(16)
In order to prove the stability of the process and convergence to the desired state values, a positive definite Lyapunov function is utilized as
(13)
̃
(
)
̂̂
where ̃ ̂ and ̃ are the vectors of the parameters’ estimation error and virus tracking error, respectively. By simplifying (17), the closed-loop dynamics of the controlled number of hepatitis B viruses is reformulated as
By substituting ̇ ̃ in Eq. (11) and based on Eq. (7), the control law is represented in the parameterized form as
̂̇
)
̂
(̃̇
(12)
̂
)(
Based on Eq. (7) and using Eqs. (8)-(10) in (16), the closedloop dynamics of virus is obtained as
The accent ^ is used for the estimated (uncertain) parameters of the system. In other words, ̂ , ̂ , ̂ are the estimations of , , that will have an uncertainty. This means that the model parameters have constant values which are considered to be unknown in the proposed adaptive control method. Also, the tracking error ̃ (used in Eq. (11)) for the number of viruses is defined as ̃
̇
Proof: The Lyapunov function V in (19) is positive definite in terms of ̃ and ̃ . Since the time derivative of Lyapunov function in Eq. (22) is negative semi-definite ( ̇ ), V is bounded; therefore ̃ and ̃ are bounded. Based on the Barbalat’s lemma [23], if is a uniformly continuous
(15)
̇
3
function and the limit of the integral ∫ exists and has a finite value, it is concluded that:
(28) (23)
̇
̃
(24)
By integrating both sides of Eq. (24) from is obtained: ∫
Also, ̇
Using this scaling, the dimensionless form of the HBV model (1), (2) and (4) is obtained as
̃ , ̇ in (22) is written as
Now, considering
to
(29)
, it (30) (25)
[
⁄
is negative (see Eq.(22)); therefore, is positive and finite. Accordingly, in (25) exists and has a finite positive value ∫ because of the positiveness of . As a result, based on the Barbalat’s lemma [23], one can write: ̃
(31)
Using this dimensionless model, the computations of solving the HBV differential equations (29)-(31) become faster and more accurate in comparison with solving the original model (1), (2) and (4) that has state variables with high and different orders of magnitude. The dimensionless variables ( , and ) are in the range of 0-1 (i.e., 100); however, the original state variables (x, y, and v) are in the range of 107 to 109 as presented in [5]. Note that the control law (11) was obtained in terms of the state variables y and v with their original dimensions. Also, the stability proof in Sec. 4 was presented for the original HBV model. Therefore, the dimensionless model was presented in this section to only facilitate the simulation process (Sec. 6) in solving the HBV dynamics. However, since both of the original and dimensionless models have the same structure, the control law and the stability proof can be similarly proposed for the dimensionless model which is not required to be mentioned.
(26)
Since ̃ and is a positive non-zero constant, Eq. (26) ensures the convergence to ̃ as . Thus, the proposed nonlinear adaptive controller achieves its objective which is tracking the desired number of viruses ( ) during the treatment of the HBV infection. The desired number of viruses inside the body is chosen to be descending and eventually tends to zero ( ) at the end of treatment. Therefore, the number of actual viruses will converge to zero as a result of the formerly mentioned tracking convergence proof (i.e., as ). Also, since the parameters’ estimation error ̃ remains bounded, the proposed adaptive control strategy has robustness against parametric uncertainties. In this condition, since the state variable decreases and converges to zero, after a bounded time it can be written for Eq. (2) that: . Therefore, after a bounded time interval, it can be noted for the infected cells that ̇ based on Eq. (2). As a result, due to the positivity of the number of infected cells , it is concluded that y remains bounded and converges to zero ( as ). Moreover, as , the dynamics of uninfected cells in Eq. (1) can be written as ̇
]
6. Simulation Results In order to evaluate the proposed nonlinear adaptive control method, the hepatitis model and the controller are simulated in the Simulink-Matlab environment. The controlled amount of drug usage is obtained by the proposed control law, Eq. (11). At first, 50% uncertainty has been considered for the initial estimation of the model parameters in ̂ that was defined in Eq. (9). This uncertainty is the error of the initial estimation of parameters ( ̂(0)) with respect to their nominal values ( ) used in the simulated HBV model. The nominal values of the constant model parameters and initial values of the state variables (the numbers of uninfected x and infected y cells, and the number of free viruses v per unit volume of the blood) were presented in [5], which are listed in Table 2. Also, the dimensionless parameters and initial state variables are mentioned in Table 3.
(27)
By solving Eq. (27) we can see that after a limited time, the number of healthy (uninfected) cells x converges to a ⁄ ). maximum finite steady state value (
Table 2: Parameters and initial conditions of state variables for the HBV model (1), (2) and (4) [5].
5. Dimensionless Model Since the number of free viruses is considerably larger than the numbers of infected and uninfected cells, it is reasonable to make the model and state variables dimensionless in order to better simulate the HBV behavior and illustrate comparable results. For this purpose, the scaled (dimensionless) variables and parameters are defined [24] as:
rePemaraP/State d
p c x(0) y(0) v(0)
4
Value 0.0038 1.981×10⁻¹³ 0.0125 0.8 842.0948 0.67 5.5556×10⁷ Cells/mL 1.1111×10⁷ Cells/mL 6.3096×10⁹ Copies/mL 2.5251×10⁻⁵
rePemaraP/State
Non-dimensional viruses and cells
Table 3: Dimensionless parameters and initial state values of the HBV model (29)-(31)
eelaa 3.28947 767.6676 176.3157 0.83609 0.1672 0.328929
(0) (0) (0)
1.5 1 0.5 0
Number of viruses
)
(32)
9
6
Desired scenario (vdes)
4 2 0 0
50
Time (days)
100
3 x 10
10
2 1 0
x 10
20
40 Time (days) (a)
60
80
20
40 Time (days) (b)
60
80
7
2 1.5
Number of healthy (uninfected) cells
Number of viruses
Number of sick (infected) cells
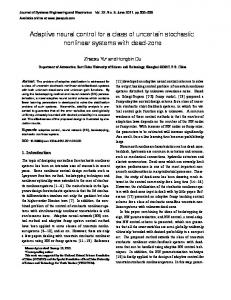
where is the final desired number of viruses (per volume of the blood) and is the initial number of viruses v(0). The constant parameter denotes the virus reduction rate during the treatment process. For a treatment period of 150 days, this number is set on . The desired final number of free viruses is zero . The desired number of viruses per mL of the blood in the patient's body presented by (32) is shown in Fig. 2. Note that the reason of using (32) is having a suitable continuous function for the virus reduction. However, without loss of generality, another gradually decreasing scenario for the desired number of viruses can be employed instead of (32). x 10
0.05
0.1 0.15 0.2 0.25 0.3 Non-dimensional Time Fig 3. Dimensionless numbers of viruses, healthy (uninfected) cells and sick (infected) cells without treatment
The following desired reduction scenario of the free viruses in the blood is intended to be tracked using the proposed control strategy: (
Healthy (uninfected) cells (X) Sick (infected) cells (Y) Viruses (V)
1 0 x 10
7
5 4 3 0
20
40 60 80 Time (days) (c) Fig 4. (a) Number of viruses, (b) Number of sick (infected) cells, (c) Number of healthy (uninfected) cells, without treatment.
150
Fig 2. Desired scenario for the reduction of hepatitis B viruses (numbers per mL of blood volume)
Figure 3 shows the trend of the dimensionless numbers of viruses, healthy (uninfected) cells and sick (infected) cells without the treatment (drug usage). The corresponding actual values of the mentioned variables are presented in Fig. 4. According to these figures, the number of viruses especially in the early period of the disease has a substantial increase. The increase of the number of viruses (v) causes that the number of healthy cells (x) decreases and the number of sick cells (y) increases, which are in accordance with the HBV dynamics (1)-(3).
However, using the proposed control strategy for the drug usage, the trend of state variables during the treatment process of Hepatitis B is shown in Fig. 5, considering 50% parametric uncertainty. As seen in Fig. 6, the actual number of hepatitis viruses tracks the desired decreasing scenario in (32) during 150 days of treatment.
Non-dimensional viruses and cells
1 0.8
Healthy (uninfected) Cells (X) Sick (infected)Cells (Y) Viruses (V)
0.6 0.4 0.2 0 0
0.1
0.2 0.3 Non-dimensional Time
0.4
0.5
Fig 5. Dimensionless state variables during the treatment process, considering 50% parametric uncertainty
5
9
Actual value (v)
6 4
2 x 10
2
Number of sick (infected) cells
0 0
Number of healthy (uninfected) cells
To elaborate more on the performance of the proposed strategy for the drug delivery, the smallness and convergence of the tracking error for the number of virus ̃ are shown in Fig. 8.
Desired scenario (vdes)
Tracking error
Number of viruses
x 10
x 10
50 6
Time (days) (a)
100
150
(v - vdes)
0 -2 -4 -6 0
10
50
100
Time (days)
150
Fig 8. Tracking error between the actual and desired numbers of hepatitis viruses
5
6.1. Effects of Uncertainty on the System Performance 0 0 5.7 x 10
50 7
Time (days) (b)
100
150
In this section, the effect of parametric uncertainty on the nonlinear adaptive controller’s performance is evaluated. For this purpose, 20%, 50% and 70% uncertainties are taken into account for the system parameters listed in Tables 1 and 2. The performance of parameter estimation for these cases is shown in Fig. 9. As seen and proved in Sec. 4, the presented adaptation law (14) has guaranteed that the estimation error of dynamic parameters remains bounded, with different amounts of uncertainty.
5.65 5.6 5.55 0
50
100 150 Time (days) (c) Fig 6. (a) Actual and desired numbers of viruses, (b) Number of sick (infected) cells, and (c) Number of healthy (uninfected) cells, for 150 days treatment period, considering 50% parametric uncertainty
Estimation of model parameter
0.1
Although 50% parametric uncertainty was taken into account, the obtained results (Figs. 5 and 6) show that the virus quantity converges to zero at the end of the treatment period, by exerting the designed controller. Also, the number of healthy (uninfected) cells converges to a maximum amount and the number of sick (infected) cells converges to zero as a result of virus reduction. This performance is achieved using the appropriate rate of antiviral drug usage illustrated in Fig. 7, which is obtained from the proposed control law (11). As seen in Fig. 7, the physiological constraint of the HBV treatment (0≤ ≤1) was satisfied using the proposed control strategy. This shows that the exponential reduction of hepatitis viruses ( in Eq. (32)) satisfies the limitation of drug usage (0≤ ≤1). The appropriate tracking of this desired scenario ( ) was provided by implementing the proposed nonlinear adaptive controller as proved in Sec. 4.
Time (days)
100
0.02
Estimation of model parameter
x 10
50 -3
Time (days) (a)
100
150
-0.5 -1 -1.5 -2
2.5
u(t)
50
0.04
0
0.6 0.4 0
0.06
0
Estimation of model parameter
0.8
Estimation of (1) for 20% uncertainty Estimation of (1) for 50% uncertainty Estimation of (1) for 70% uncertainty Real value of (1)
0.08
0 0
1
Drug usage
8
2 1.5
Estimation of (2) for 20% uncertainty Estimation of (2) for 50% uncertainty Estimation of (2) for 70% uncertainty Real value of (2) 50
Time (days) (b)
100
150
Estimation of (3) for 20% uncertainty Estimation of (3) for 50% uncertainty Estimation of (3) for 70% uncertainty Real value of (3)
1 0.5 0 0
100 150 Time (days) (c) Fig 9. Parameter estimation using the presented adaptation law for different amounts (20%, 50% and 70%) of uncertainty
150
Fig 7. Rate of antiviral drug usage for 150 days treatment period, in the presence of 50% parametric uncertainty
6
50
Figures 5-7 show that the controller achieved to its desired objective; however, the parameter estimation error remained bounded as proved in the Lyapunov stability proof (Sec. 4). Figure 10 represents the number of hepatitis B viruses and its convergence by employing the proposed control strategy for three conditions of uncertainty (20%, 50% and 70%), (a) during 150 days and (b) for the first 5 days of treatment. x 10
9
v(t) for 20% parametric uncertainty v(t) for 50% parametric uncertainty v(t) for 70% parametric uncertainty Desired scenario (vdes)
6
1
4 2 0 0
11
x 10
50
Time (days) (a)
100
Drug usage
Number of viruses
8
Number of viruses
uncertainty. In other words, since the estimated parameters have been utilized in the control law (11), the rate of drug usage has some oscillations in the initial days of treatment, as shown in Fig. 12. Accordingly, this oscillatory control input (for t < 50 days) has made some fluctuations in the system response (Figs. 10 and 11). However, after this period of process (t > 50 days) when the variations of estimated parameters have settled down (see Fig. 9) and the controlled drug usage becomes steadier, the number of viruses has been better tracked the desired scenario (Fig. 10a) and the tracking error becomes smaller (Fig. 11).
150
9
v(t) for 20% parametric uncertainty v(t) for 50% parametric uncertainty v(t) for 70% parametric uncertainty Desired scenario (vdes)
10 9 8
0.6 0.4 0.2 0
u(t) for 20% parametric uncertainty u(t) for 50% parametric uncertainty u(t) for 70% parametric uncertainty 50
Time (days)
100
150
Fig 12. Employed rates of antiviral drug usage as the control input in the presence of 20%, 50% and 70% parametric uncertainties
7
7. Concluding Remarks
6 0
1
2 3 Time (days) (b)
4
In this paper, a nonlinear adaptive control method was developed to adjust the rate of antiviral drug usage for the patients dealing with the hepatitis B virus (HBV) infection. The control law was designed based on the nonlinear structure of the HBV dynamics. The efficiency of the proposed adaptive control theory was investigated for the treatment of hepatitis B virus (HBV) infection in the presence of modeling uncertainties. The Lyapunov theorem was employed to prove the stability of the process, the tracking convergence and the robustness against uncertainties. The objective of the proposed control method was decreasing the number of free hepatitis B viruses according to the desired scenario by employing the antiviral drug usage as the control input. The results of this virus reduction are decreasing the number of sick (infected) cells and increasing the number of healthy (uninfected) cells. The performance of the controlled system was investigated during the treatment period considering three levels of parametric uncertainty (20%, 50% and 70%). Based on the obtained results from numerical evaluations, the following characteristics can be mentioned for the proposed adaptive control strategy: Without any linearization, the original uncertain nonlinear HBV dynamics was taken into account for the controller design. The desired performance of the nonlinear process (convergence to desired number of hepatitis viruses) was ensured and also proved using the Lyapunov stability method. The nonlinear controller was robust against a high level (70%) of modeling uncertainty that is usually seen in realistic treatments for different bodies. In other words, the controller can rapidly adjust the drug usage and adapt to the parametric uncertainties to achieve its objective (desired reduction of free viruses).
5
Fig 10. Performance of the virus reduction for three levels of uncertainty (20%, 50% and 70%): (a) during the whole 150 days of treatment (b) during the first 5 days
As it is seen in Fig. 10a, the decrease of viruses was achieved as the control objective in the presence of different uncertainty amounts. However, the overshoot magnitude for the number of viruses in the initial time period of the treatment process (Fig. 10b) becomes larger by the increase of uncertainty. The normalized tracking error of the number of viruses with respect to its desired value ̃ is shown in Fig. 11. Normalized tracking error
0.8
0.1 0 -0.1 -0.2
(v - vdes)/v0 for 20% parametric uncertainty
-0.3
(v - vdes/v0) for 50% parametric uncertainty
-0.4 0
(v - vdes/v0) for 70% parametric uncertainty 50
Time (days)
100
150
Fig 11. Normalized tracking error for the number of viruses with respect to its desired value in three different cases of parametric uncertainty (20%, 50% and 70%)
As observed in Fig. 11, the magnitude of tracking error’s fluctuations in the initial 50 days of process becomes larger by the increase of uncertainties. This comes from higher variations of parameters’ estimation (Fig. 9) in the initial period of treatment process for larger magnitudes of
7
During the treatment process of the hepatitis B, the presented adaptation law guaranteed that the estimation error of uncertain model parameters remains bounded, as proved in the Lyapunov analysis and shown in the results.
The proposed nonlinear adaptive control method can be evaluated experimentally and then used in future health treatment strategies for the HBV infection and/or other diseases. As an extension of this work, a discrete control method can be designed to be used in future experimental HBV treatment strategies such that it is not required to continuously measure the state variable and apply the controlled drug input per diem. In other words, a discrete (non-continuous) controller should be proposed for clinical applications in which the patient’s blood can be tested discretely to obtain the numbers of infected cells and hepatitis viruses. However, the stability of nonlinear continuous process (dynamics) using a discrete control input (drug) is hard to be proved analytically. Moreover, the proposed controller can become robust against the unstructured uncertainties in the HBV dynamics such as time-varying parameters and disturbances. For this purpose, the proposed adaptive controller can be extended in future works using some nonlinear robust strategies to provide the stability in the presence of bounded unstructured uncertainties in addition to the parametric uncertainties.
[12]
[13]
[14]
[15]
[16]
[17]
[18]
References [19]
[1] [2]
"http://www.hepb.org/hepb/statistics.htm.," [Online]. K. Hattaf, M. Rachik, S. Saadi, and N. Yousfi, "Optimal control of treatment in a basic virus infection model," Applied Mathematical Sciences, vol. 3, no. 17-20, pp. 949-958, 2009. [3] A. Landi et al., "Modelling and control of HIV dynamics," Computer methods and programs in biomedicine, vol. 89, no. 2, pp. 162-168, 2008. [4] S. DebRoy et al., "Evaluating treatment of hepatitis C for hemolytic anemia management," Mathematical biosciences, vol. 225, no. 2, pp. 141-155, 2010. [5] M. Sheikhan and S. A. Ghoreishi, "Antiviral therapy using a fuzzy controller optimized by modified evolutionary algorithms: a comparative study," Neural Computing and Applications, vol. 23, no. 6, pp. 1801-1813, 2013. [6] M. A. Nowak, S. Bonhoeffer, A. M. Hill, R. Boehme, H. C. Thomas, and H. McDade, "Viral dynamics in hepatitis B virus infection," Proceedings of the National Academy of Sciences, vol. 93, no. 9, pp. 4398-4402, 1996. [7] V. Costanza, P. S. Rivadeneira, F. L. Biafore, and C. E. D’Attellis, "A closed-loop approach to antiretroviral therapies for HIV infection," Biomedical Signal Processing and Control, vol. 4, no. 2, pp. 139-148, 2009. [8] G. Pannocchia, M. Laurino, and A. Landi, "A model predictive control strategy toward optimal structured treatment interruptions in anti-HIV therapy," IEEE Transactions on Biomedical Engineering, vol. 57, no. 5, pp. 1040-1050, 2010. [9] M. Sheikhan and S. A. Ghoreishi, "Application of covariance matrix adaptation–evolution strategy to optimal control of hepatitis B infection," Neural Computing and Applications, vol. 23, no. 3-4, pp. 881-894, 2013. [10] J. C. Panetta and K. R. Fister, "Optimal control applied to cell-cycle-specific cancer chemotherapy," SIAM Journal on Applied Mathematics, vol. 60, no. 3, pp. 1059-1072, 2000. [11] M. Engelhart, D. Lebiedz, and S. Sager, "Optimal control for selected cancer chemotherapy ODE models: a view on the
[20]
[21]
[22] [23] [24]
8
potential of optimal schedules and choice of objective function," Mathematical biosciences, vol. 229, no. 1, pp. 123134, 2011. H. Moradi, G. Vossoughi, and H. Salarieh, "Optimal robust control of drug delivery in cancer chemotherapy: a comparison between three control approaches," Computer methods and programs in biomedicine, vol. 112, no. 1, pp. 6983, 2013. H. Laarabi, A. Abta, M. Rachik, and J. Bouyaghroumni, "Optimal Antiviral Treatment Strategies of HBV Infection Model with Logistic Hepatocyte Growth," ISRN Biomathematics, vol. 2013, 2013. J. M. Ntaganda and M. Gahamanyi, "Fuzzy Logic Approach for Solving an Optimal Control Problem of an Uninfected Hepatitis B Virus Dynamics," Applied Mathematics, vol. 6, no. 09, p. 1524, 2015. Y. Su and D. Sun, "Optimal control of anti-hbv treatment based on combination of traditional chinese medicine and western medicine," Biomedical Signal Processing and Control, vol. 15, pp. 41-48, 2015. A. Elaiw, M. Alghamdi, and S. Aly, "Hepatitis B Virus Dynamics: Modeling, Analysis, and Optimal Treatment Scheduling," Discrete Dynamics in Nature and Society, vol. 2013, 2013. H. Moradi, M. Sharifi, and G. Vossoughi, "Adaptive robust control of cancer chemotherapy in the presence of parametric uncertainties: A comparison between three hypotheses," Computers in biology and medicine, vol. 56, pp. 145-157, 2015. B. L. Betechuoh, T. Marwala, and T. Tettey, "Using inverse neural networks for HIV adaptive control," International Journal of Computational Intelligence Research, vol. 3, no. 1, pp. 11-15, 2007. H. Zarei, A. V. Kamyad, and S. Effati, "An Adaptive Memetic Algorithm With Dynamic Population Management for Designing HIV Multidrug Therapies," World Academy of Science, Engineering and Technology, International Journal of Medical, Health, Biomedical, Bioengineering and Pharmaceutical Engineering, vol. 5, no. 7, pp. 255-262, 2011. J. M. Lemos and M. S. Barao, "Nonlinear and Adaptive Control of a HIV-1 Infection Model," IFAC Proceedings Volumes, vol. 44, no. 1, pp. 14183-14188, 2011. J. M. Lemos and M. S. Barão, "A control Lyapunov function approach to adaptive control of hiv-1 infection," Archives of Control Sciences, vol. 22, no. 3, pp. 273-284, 2012. S. Abedon and E. Bartom, "Plaques," Brenner's Encyclopedia of Genetics (Second Edition), pp. 356-357, 2013. J. J. E. Slotine and W. Li, Applied nonlinear control (no. 1). prentice-Hall Englewood Cliffs, NJ, 1991. K. Wang and W. Wang, "Propagation of HBV with spatial dependence," Mathematical biosciences, vol. 210, no. 1, pp. 78-95, 2007.