The distributed character of the visual system poses a problem for our understanding of ... populations of neurons, called neuronal groups, fonn as the result of ... synchronization of oscillatory activity in remote columns may be mediated by intracortical, ... groups (vertical and horizontal pairs of arrows in main OR diagram).
NonlinearDynamics andNeuronalNetworks ·..
Proceedings of the 63rd W. E. Heraeus Seminar Friedrichsdorf 1990 Edited by H. G. Schuster
Weinheim · New York· Basel· Cambridge
.
0 c ~
100
O"
Q)
:i....
u.
50
0
1 2
3
4
5
6
7
8
9 10 11 12 13 14 15 16
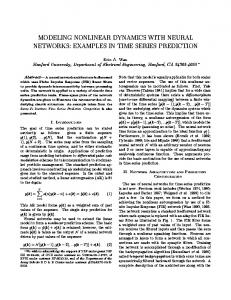
Number of Inhibitory Connections Figure S.
Dependency of oscillation frequency on the number of intra-group inhibitory connections.
The
frequency is measured in oscillation cycles per 1000 iterations. Each added inhibitory connection has the same strength as the previous ones resulting in a linear scale on the abscissa. Only one neuronal group located in OR is considered which receives no reentrant inputs from any external source.
The frequency spectrum
(periodogram, Equation 5) of its AAF during one sweep of the stimulus over its receptive field is calculated (the sample period is 1900 iterations).
Data points indicate the frequency of the main peak in this frequency
spectrum; all side-peaks are ignored. excitatory activity in the group.
Inhibitory inputs exceeding 13 connections permanently suppress all
220
0. Sporns, G. Tononi, and G. M. Edelman It is a key property of the population-based oscillator used in the model that all of the
parameters influencing the amplitude or frequency of neuronal oscillations vary significantly from one oscillator to the next. Collections of neuronal groups in the cortex should also show such variability due to differences in the microanatomy. In the model, such variability prevents accidental phase locking of uncorrelated groups, and for short observation times it results in significant and largely unpredictable shifts in the peak frequency of the power spectrum of the AAF. Similar variations can be seen at the level of single unit discharges; the peak frequency
of the auto- and cross-correlation functions varies both in frequency and amplitude from trial to trial, as well as for short data segments within a given trial. lbis variability is also a characteristic feature of the oscillating cell populations observed in the visual cortex (Gray et al., 1990a). We will return to the issue of variability, which is a key concern to the theoty of neuronal group selection.
3.3 Properties of Simple Reentrant Circuits To investigate some key dynamical properties of reentrant circuits, we first consider the simplest case: two neuronal groups that are linked reciprocally by reentrant excitatory connections.
Eckhorn et al. (1988) have taken the strong correlation between the peak
frequencies of oscillatory activity, simultaneously recorded from distant cortical sites in visual areas 17 and 18, as evidence for the coherency of neuronal activity at these sites. According to the theoty of neuronal group selection, such coherency is mediated by reentrant connections. Examples of periodograms (frequency spectra), computed at high resolution from short data segments (250 cycles long) are shown in Figure 6. The peak frequency differs markedly for two neuronal groups that lack reentrant connections (panel A), but gradually the spectra align themselves (eventually even with respect to secondary peaks) as the strength of reentry is increased (panels B and C). With stronger reentrant connectivity, the intensity of secondary peaks decreases while that of the primary peak increases; at the same time the width of the primary peak decreases. To achieve maximal coherency (as in panel C) reentrant connections need to have only a small fraction of the strength of local intrinsic connections (compare Sompolinsky et al., 1990). Reentrant activity of this kind is only modulatoty, and prevents activity from spreading laterally in an uncontrolled fashion. When a great number of frequency spectra are analyzed the increase in coherency becomes more clearly visible (Figure 7). For stronger reentrant interactions, the correlation
Dynamic interactions of Neuronal Groups
221
A 1.0 >,
=
Group
II.I
c
2
Cl
.E
0.0
40
50
60
50
60
50
60
B 1.0
>,
'iii c
Cl
.E
0.0
40
c
1.0 >,
=
II.I
c
Cl
.E
0.0
40
Frequency
Figure 6. Examples of periodograms (Equation 5) computed from short segments of the AAF (250 iterations, or cycles) sampled during the simultaneous sweeping of an elongated light bar through the receptive fields of two simulated orientation-selective neuronal groups. The groups are coupled by reentrant connections; the degree of coupling (the magnitude of the total average input arriving through these connections) varies (panel A is uncoupled, B is weakly coupled, C is coupled twice as strongly as B). In all cases, there is significant intensity of the power spectrum within the critical frequency range of 40 to 70 oscillation cycles per 1000 iterations. Peaks are broadly defined and have lower intensity if the simulated .groups are uncoupled (panel A). Most importantly, the peaks in the power spectrum of simultaneously recorded AAF's do not overlap if no reentrant coupling is present. Such overlap, however, becomes more pronounced as coupling strength increases (panels B and C). Furthermore, the intensity of the main peaks increases while that of side peaks decreases. These findings are consistent with the notion that coupled oscillating groups of neurons tend to entrain each other and narrow their respective frequency bands.
222
0. Sporns, G. Tononi, and G. M. Edelman A
B
30
.... c-----.----.-30
20
20
10
10 70
0
,.
,:
a.
5 §
60
./· •
..
a. :,
0.
§
"!-•'
>,
60
!! 60
~ >,
..
>,
u
u
.. u
. :.:..:.:/~ =-.·
c
! g
;;.
'"il
c
c
:,
:,
50
g 50
"'50
t
,t
40+-~~~~~~~~~
40
50
60
70
40
,t
40+·~~~~~~~~~
40
Frequency (Group 1)
50
60
70
Frequency (Group 1)
40
50
60
10
Frequency (Group 1)
Figure 7. Correlation diagrams of the peak frequencies of periodograms computed from data shown in the previous Figure 6. Again, panels A, B and C correspond to uncoupled, weakly coupled, and more strongly coupled neuronal groups, respectively. For each condition, 60 short data segments (each 250 iterations, or cycles long) were selected and the periodogram was computed in the pange of 40 to 70 oscillation cycles per 1000 iterations. In panel A the peak frequencies of group 1 and 2 are mostly uncorrelated, while a strong positive correlation appears in panel B and particularly in panel C. The histograms of the peak frequencies of both group 1 and 2 (displayed on top of each correlation diagram) show a slight narrowing of the range of peak frequencies, probably as a consequence of entrainment.
between the frequency spectra of two reentrantly coupled groups increases. Also, with stronger reentrant coupling, the peak frequencies tend to cluster and, if compared to the uncoupled groups, the variance of their statistical distribution is diminished (Figure 7). This clustering of peak frequencies is the result of mutual entrainment of oscillatory activity in the two groups, a well-known effect in the dynamics of coupled non-linear oscillators. It is an old theoretical idea that some aspects of power spectra obtained from EEG data indicate the dynamic entrainment of large masses of neurons in the brain (Wiener, 1961; Dewan, 1964; Kreifeldt, 1970). Figure 7C shows that the instantaneous frequency of the neuronal groups in the model continues to shift unpredictably even when reentrant connectivity is introduced. these shifts now occur in both groups in a correlated fashion.)
(However,
Such frequency shifts have
been observed by Gray et al. (1990a) in the visual cortex. Frequency variability might allow the simultaneous occurrence of oscillatory activity in spatially overlapping collectives of neuronal groups.
Multiple collectives of this kind (or cohorts) could be coherent within
themselves but be mutually uncorrelated. Frequency shifts of the magnitude observed both in the visual cortex and in the present model may pose problems for a coding scheme which labels cohorts by their fixed characteristic frequency.
Dynamic Interactions of Neuronal Groups
223
A significant shift of the peak frequency of two neuronal groups averaged over many stimulus trials may occur when reentrant coupling is introduced.
The oscillation period
lengthens (the frequency decreases), occasionally by as much as 10%, an observation that has been independently confinned in a mathematical model (Menon and Tang, 1990).
This is
presumably due to slightly prolonged activity within each neuronal group during the time of interaction.
Interestingly, it has been shown that the dominant frequency in the beta range
of neuronal activity in the olfactory bulb of the rabbit is shifted by about 10% towards lower frequencies when odors are presented as compared to control trials (Freeman and Viana di Presco, 1985).
The correlation coefficients of coupled neuronal groups are sensitive to the total amount of input that the reentrant connections contribute, but less sensitive to the number and relative strength of these reentrant connections (Table 1). If the total amount of input contributed by reentrant connections is kept approximately constant (case 1 in Table 1), the correlation strength does not change significantly over a wide range of density of reentrant connections; as connections become fewer but stronger individually, the correlation strength increases first slightly and then abruptly due to the higher likelihood of firing neurons with only very few active inputs. On the other hand, the correlation strength decreases steadily with decreasing reentrant input as more and more reentrant connections are removed (case 2 in Table 1). In both cases, the changes in frequency are only slight.
3.4 Intra-Areal Linking of Collinear Stimuli
Interactions through reciprocal, excitatory connections between adjacent groups of the same specificity in OR give rise to coherent oscillations in neighboring as well as distant groups with a near zero phase lag, as is evident from the cross-correlation functions of single unit activity (Figure 8). Although cross-correlations decrease with distance following an inverse rule, phase coherency can extend over distances greater than the extent of intra-areal reentrant connectivity (Kanunen et al., 1990b). In the model as well as in experiments (Gray et al., 1989; Engel et al., 1990), correlations are found between units in groups that have nonoverlapping receptive fields if a ·long, continuous moving bar is presented.
In the model as
presented in Figure 8, these distant correlations disappear if two collinear short bars are moved separately, but with the same velocity; however, experiments indicate some weak coherency, if the gap between the two bars is not made too wide. In Figure 8, local reentrant connections
224
0. Sporns, G. Tononi, and G. M. Edelman
Case 1: Total Connections Total Input Connection Strength
Input
Constant
64
32
16
8
1
1
1
1 1
1/4
1/8
1/2
------------------------------------------------------------------Autocorrelation Crosscorrelation
13.33 3.61
13.64 4.09
8.03 3.41
8.21 3.69
Case 2: Connection Connections Total Input Connection Strength
Strength
64 1 1
13. 83 4.31
16.31 5.28
9.02 4.13
13.44 5.43
Constant
32 1/2
16 1/4
1/8
1
1
1
8
Autocorrelation
17 .22 5.62
13.64 4.09
11.94 3.48
11. 87 3.90
Crosscorrelation
14.82 5.63
8.21 3.69
4.05 2.03
2.38 1. 72
Table 1. Correlation coefficients of AAF's of two neuronal groups responding to simultaneous stimulation and the effect of variations in their reentrant connectivity.
In case 1 (top), the total reentrant input was left
unchanged and the density of the reentrant connectivity was varied. In case 2 (bottom), the strength of an individual reentrant connection was kept constant and the number of reentrant connections was varied. Connections = number of reentrant connections between group 1 and group 2; Total Input = sum of all reentrant inputs to a cell in group 1 or 2, in relative units;
Connection Strength = strength of individual
reentrant connections (after scaling), in relative units; Autocorrelation = detectability (D, see Equation 4) of central and first order lateral peaks in the scaled autocorrelation function of group 2, as computed after Equation 3;
Cross-correlation = detectability of central and averaged first order lateral peaks in the scaled cross-
correlation function of group 1 with group 2. All Auto- and cross-correlation values represent averages of ten trials with 1900 iterations each.
Dynamic Interactions of Neuronal Groups -~
225
-----)
I
1
2 3 4 5 6
7 8
1
2 3 4 5 6 7 8
--;
3-3
3-4
3-5
3-6
3-7 1----+-----+
80
:!II::
ii: f------,~~~+-~~~-+O
0
TIME (CYCLES)
50
(/)
w
3-8
-50
0
(/)
50
TIME (CYCLES)
Figure 8. Auto- and cross-correlations of single unit activity recorded from orientation-selective groups arranged in a 1 by 8 array (see insets at top) when a single long bar Oeft) or two short aligned bars (right) of appropriate orientation are moved through their receptive fields. Receptive field areas of adjacent groups overlap by about 60%. Correlations between units in groups with overlapping receptive field areas (3-4), directly linked by local reentrant connections, and non-overlapping receptive fields (3-6), only indirectly linked, are present in the case of a single continuous stimulus Oeft), but are not present in the discontinuous case (right).
226
0. Sporns, G. Tononi, and G. M. Edelman
are only allowed between adjacent groups in OR, thus directly linking only groups that have overlapping receptive fields. If connections are added between more distant groups, some degree of coherency between groups responding to each of the collinear bars is observed. In general, the correlation strength depends on the relationship between the extent of intra-areal reentrant connections and the width of the stimulus gap (data not shown; see also Schillen and Konig, 1990).
Given the limited extent of cross-columnar connections (Gilbert and Wiesel,
1983; Luhmann et al., l 990a), it is unclear whether the experimentally observed correlations over 7 mm of cortex (Gray et al., 1989) are sufficiently explained by exclusively local reentry within area 17 or whether other areas might be involved. The present model is consistent with the possibility that correlations might be generated via multiple and even indirect paths. In general, correlations can appear between distant groups that are linked through other intermediate groups or (as is illustrated in the following simulation) through groups in other areas (see also the "comparator model'' of Kammen et al., 1989; l 990a).
3.5 Inter-Areal Linking of Different Stimulus Features
So far, the simulations show the generation of oscillatory activity within neuronal groups and the occurrence of stimulus-dependent cross-correlations between distant groups with similar orientation specificity within a single area. In addition, the model presents an example of the constructive properties of reentry, such as the ability to create coherency between groups of different specificity within the same area, as well as between different areas. This was studied in simulations of OR and MO responding to a spatially extended moving contour (Figure 9 and 10).
The stimulus contour was shaped like a right-angle corner and thus contained line
segments of differing (in fact, orthogonal) orientation. If such a moving stimulus is presented, orientation- as well as motion-selective groups exhibit oscillatory activity, roughly within the same frequency range.
Oscillations within MO are driven by the direction-selective units,
whereas oscillations in OR do not depend upon oscillations in MO.
Since our model
architecture does not include reentrant connectivity linking orthogonal orientations, coherency among groups of different stimulus specificity cannot develop by local interactions alone. In the presence of inter-areal reentrant
connections, coherency develops between groups
responding to differently oriented parts of the contour moving together as one pattern. If the reentrant connections from MO to OR are cut (leaving connections from OR to MO intact), coherency of oscillations in OR exists only between groups of the same orientation preference and is due to reciprocal coupling via intra-areal reentrant connections (as described previously,
Dynamic Interactions of Neuronal Groups
227
Input Array
3
4
Moving
•••••••••• Contour •• 1• • • 2:• • 0
Cl)
z
3.0
1-2
3-4
With Reentry
1-3
J: I-
C!)
zUJ
cc
I-
C/)
z 0
i= c:( ..J UJ
3.0
Without
Reentry
cc cc 0
(.) I Cl) Cl)
0
cc (.)
TIME (CYCLES)
Figure 9. The effect of long-range reentrant connections between OR and MO in response to a simulated moving contour. The diagrams show the cross-correlation of the AM of neuronal groups in OR, in the presence (middle) and absence (bottom) of reentrant connections from MO to OR. Parts of the moving contour to which neuronal groups 1, 2, 3 and 4, located in OR, respond are indicated at the top. Cross-correlation strength is measured as the detectability index according to Equation 4 and is expressed in standard deviations (S.D.) above the background.
228
0. Sporns, G. Tononi, and G. M. Edelman
Figure 10. Six frames from a C.N.S. movie showing the oscillatory activity of neuronal groups responding to a stimulus contour moving in a south-east direction. Panels A to F correspond to cycles 889, 891, 892, 893, 895, and 897 of the simulation run; overall statistics of this run are displayed in Figure 9. The input array (central upper square in each panel) shows the moving comer-shaped contour.
(Movement of the stimulus contour is
too slow to be noticed in this short segment of the run.) Simulated cortical area OR is split into two subparts; the box on the left of each panel Oabeled "OR: VERTICAL")contains orientation-selective neuronal units responding optimally to vertical bars, the box at the lower center of each panel Oabeled "OR: HORIZONTAL") contains orientation-selective neuronal units responding optimally to hori2.ontal bars. On the right of each panel is shown the simulated cortical area MO, with two boxes containing pattern motion-selective neuronal units responding optimally to contours moving south-east (box labeled "MO: RIGHT-DOWN") and north-west (box labeled "MO: LEFT-UP"). Each of the four boxes comprising the simulated cortical areas OR and MO contains 16 neuronal groups topographically arranged in a 4 x 4 grid. In OR, only two layers of neuronal units are displayed, the orientation-selective units (in the upper half of each group) and the inhibitory units (in the lower quarter of each group); direction-selective units and their associated inhibitory units are omitted for clarity of the display. In MO, pattern-motion selective units occupy the upper two-thirds and inhibitory units the lower one-thirds of each group. In panel A, motion-selective neuronal groups in MO begin to respond to the motion of the stimulus contour in a south-east direction. Their reentrant signals reaching OR facilitate the onset of correlated activity in orientation-selective neuronal groups (panel B). In return, the activity of motion-selective groups grows to be even more pronounced. Panels C and D show the oscillatory activity in both OR and MO at its peak; notice, that groups in both the VERTICALand the HORIZONTALparts of OR are activated in a synchronous fashion. Panels E and F show the activity slowly dying away, restoring the initial situation.
Dynamic Interactions of Neuronal Groups
( A)
(B)
u=
.. .. ..
u=
.. :: .. ..
•DDDDDDODO.C: 0- .........
::~~?!~?~~~ O•
MO
O•
lCH
229
O• O• O•
LON
.
MO
0•
....
OR •
;
- -
-·
:"--=- ·
••
-~-
., __ :.+i:
~·
•.-
VCRTIC.t,L
OR:
.,-.
...
.;,,.·
...
HORlZOtlTA\.
".JV
.·;·-'{':J.
•.•
'
.
.
;::,
-
...... ,
' .-.
::;' .-
OR:
..•
.
.r.
...
......
. • -1 1.10; L(rl-UP
HORJZOHTAL
'I
'
(D)
[a
........ :_ [a::.
•ooooooooolll a ... ,•••,,•,
Oo
g:
lCH
MO
D•
·'
OR:
UC:
Rl'CNT-DOViN
'·
.._ ..
··
•.
MO
O•
·
•.
··
·
MO; L(tr-UP
~:
(E)
..,.
:
·,-
VERflCAL
m ... -· ··· ·-UO: 1111:ICMT-OOVIN
"
'
·,
,.
HORIZONTAL
O•
i:
·~··::;=, · -· .. --~
..~
. ,·· \l(RTl'CAL
·
eoooooooooc o• .... ,, • • • • ..
LCN
·.:,;'.. ·- m' ·~·-·
...
OR:
HORIZONTAL
UO:
-· ... _··.--·..'.'.' UFT-UP
(F)
u3
lCH
.. ..
:.·• ...... [a::.
_,DOOOOODD-OC O• • • + • • + • + •
::
.. ..
MO
..
•00•0000000
o• • • •• • • • • •
::
lCH
MO
::
OR
m .
.
()fl:
•
...
-
OR: VERTICA.L
UO; U:Fr-u~
( C)
OR:
-
,. -··,-
m·---·--··· ~
.
•.:::,;....
._..,_~ · ·
·-~·:, ~- -· -~
l
"'le
~
•• OR:
m·· ___ ,,_.
V£RfICAL
.
uom, """.,'"
UO;
U.FT-UP
'
.
- ' . ~
... .
. DA:
- ......
VCRTICAL
--
:
.... . OR:
..
......
.
HORIZOHT.-..L
.
[i-., . .. . .
IIO:
.,,
u:rr-up
..
~
230
0. Sporns, G.1bnoni, and G. M. Edelman
see Figure 8). Thus, the dynamic linkage of responses in OR depends on reentrant signals arriving from another segregated visual area, MO. This dynamic linkage is reflected in both the population response of neuronal groups as represented by the AAF as well as in single tm.it discharges (Figure 10). The model (Spoms et al., 1989) predicted that oscillatory activity is present in another extrastriate cortical area, specialized for the analysis of stimulus movement. The experimentally observed occurrence of neuronal oscillations in area PMLS, an analog to area MT in the monkey and their coherency with simultaneously recorded oscillatory activity in area 17 (Singer, 1990), lends further support to the model. An additional property of inter-areal reentry is that it links together the responses to the
contour of the stimulus with those to its coherent movement, thus establishing a relationship between two different feature domains, orientation and movement.
Without reentry, the
orientation and movement properties of the stimulus would remain segregated.
An active
reentrant circuit directly establishes a conjunction, without the need for additional hierarchical levels and specialized coincidence detectors. This mode of linking responses in different maps becomes even more advantageous, as more complex situations involving collections of maps are encountered.
3.6 Coherent Oscillations, ''Linking Features" and the Magnocellular System It was recognized early on by Gestalt psychologists that some visual features are particularly useful in order to relate parts of an image, link those parts which belong to the same object, and distinguish the object from the background. Barlow (1981) has called those features, which are used to create coherency in a visual image, "linking features". Recently, in reviewing previous psychophysical experiments, Livingstone and Hubel (1987,1988) have provided new evidence that some features like common orientation (collinearity), movement and disparity are apparently used for spatial linking, while others such as color are not. Furthermore, they have argued that linking by collinearity, movement and depth is a property of the achromatic, magnocellular system only, since it collapses at equiluminance.
They
concluded that the magnocellular system "tends to integrate information from different parts of the visual field; it seems to be able to correlate and link spatially separate stimuli" (Livingstone and Hubel, 1987, p. 3464; see however Ingling and Grigsby, 1990).
Dynamic Interactions of Neuronal Groups
231
The recent experimental evidence on cortical oscillations, as well as the present computer simulations (and other models, see next section) suggest that one possible mechanism of spatial linking might be the establishment of coherent oscillations mediated by reentrant connectivity among neuronal groups with non-overlapping receptive fields. Thus, if the parvocellular system is actually not involved in spatial linking, it might be suggested that the occurrence of coherent oscillations among distant groups is restricted to the magnocellular system. [f this prediction is correct, anatomical and physiological differences between the magnocellular and parvocellular systems should be responsible for the presence or absence of spatial linking in these systems. Such differences could include the extent and termination pattern of cortico-cortical collaterals and their conduction velocities.
3.7 Comparisons with Other Models
Coupled nonlinear oscillators have been a topic of physical and mathematical interest for a long time.
It is by now well-known that such systems can have complex dynamics,
displaying an entire range of behaviors from phase-locking and symmetry breaking to chaos (Schuster, 1984; Spoms et al., 1987).
The recent experimental work on cortical neuronal
oscillations has prompted a number of mathematical models based on the physical paradigm of coupled oscillators (e.g. Eckhom et al., 1989; Kammen et al., 1989; Schillen and Konig, 1990; Sompolinsky et al., 1990; Wang et al., 1990), which have provided a number of important insights. The approach taken in our model (Spoms et al., 1989) is different. We attempt to describe and explain the dynamical behavior of neuronal populations that are modeled explicitly with defined structural and physiological properties. Simulation studies of this kind have been done before for several oscillating systems of the brain (Farley, 1962; Andersen et al., 1966; Lopes da Silva et al., 1974; MacGregor and Palasek, 1974) and are particularly useful in connecting theoretical concepts to actual experiments.
The results
obtained from our simulations are entirely consistent with recent mathematical analyses, but also extend the scope of these analyses in several respects:
(i) The model demonstrates that structural variability of a population-based oscillator can
yield variable dynamical behavior of a kind that is highly characteristic for cortical neuronal groups (Gray et al., 1990a), such as statistical shifts in frequency and phase. [t thus provides another example of the importance and ubiquity of variability in the nervous system. [f such variability is at all taken into account in mathematical models (e.g. Sompolinsky et al., 1990)
232
0. Sporns, G. Tononi, and G. M. Edelman
it does not emerge from the interactions of the system's components, but is provided externally as added noise. (ii) The model explores the simultaneous function of reentrant projections at two distinct
scales of organization: intra- and inter-areal.
It thus resembles more closely the actual
situation in the cortex and combines two extreme architectures which have previously only been studied in isolation (Kam.menet al., 1989; 1990a). A structurally refined model, which is open to progressive change and is not constrained by what is mathematically analyzable, might be a useful tool for understanding the function of cortical oscillations.
4. Groups and Reentry: Elements of Cortical Integration The simulations presented in this paper have shown that an architecture consisting of reentrantly connected neuronal groups can give rise to intra-group, intra-areal and inter-areal coherent oscillations in close agreement with experimental findings. In addition, the concept of reentry among neuronal groups provides a general framework for understanding the occurrence and the possible functional significance of coherent oscillations. In what follows, we will briefly swrunarize the results of the simulations as well as some experimental evidence by distinguishing different levels of reentrant interactions among populations of cells. (i) Neuronal groups.
The model shows how coherent oscillations can anse among
neurons sharing similar input/output relationships and relatively strong local interconnections, or, in other words, within neuronal groups. On the other hand, the discovery that neurons in the visual cortex engage in cooperative interactions leading to synchronous oscillations provides strong support to the concept of neuronal groups as basic building blocks of cortical function. It also appears from our simulations that such oscillatory behavior, if it is based on local populations of neurons, is an inherently rich and variable phenomenon. The interactions of neurons within a group might help the sharpening of their functional characteristics. For example, it has been pointed out that "... orientation selectivity is essentially a property of a resonant ensemble of selectively coupled neuron clusters [i.e. neuronal groups]" (van der Malsburg and Singer, 1988). Furthermore, an oscillating group would be sensitive to input only intermittently. As a consequence, other inputs to that group arriving out of phase or at a different frequency would be less efficient in influencing the group or would be suppressed
Dynamic Interactions of Neuronal Groups
233
altogether. Correspondingly, the output of that group would be particularly effective, due to the strong swnmation of synchronous EPSP's on target neurons.
(ii) Intra-areal reentry. In the model, coherent oscillations established through reentrant
connectivity link together neighboring groups of matching orientation selectivity. The results of these simulations closely resemble the experimental findings by Gray et al. (1989) with collinear stimuli. Spatial linking of this kind could be an important mechanism to relate those parts of an image which belong to the same object and to distinguish it from the background (the so-called segmentation or figure-ground problem; van der Malsburg, 1981; 1985; van der Malsburg and Schneider, 1986; Reitboeck et al., 1987; Spoms et al., 1989; 1990; Gray et al., 1990b) or from other objects (the multiple objects problem).
Purely intra-areal reentry is,
however, not always sufficient to serve as a basis for such linking tasks, as when the figure consists of different features.
Moreover, the spatial extent over which coherency with zero
phase delay is attainable might be limited (Kamm.en et al., 1989).
(iii) Inter-areal reentry. In our simulations, reentry among different maps (OR and MO)
containing neuronal groups responsive to different stimulus attributes
(orientation and
movement) but sharing common primary dimensions (here gross topography of visual space), can give rise to coherent oscillations between them. Furthermore, the responses of neuronal groups that are not locally connected within a map can be made coherent by shared reentrant pathways with another segregated map.
The occurrence of coherent oscillations between
different brain areas is supported by some experimental evidence (Eckhom et al., 1988). In general, the establishment of coherent oscillations between different areas might provide a solution to at least some instances of the so-called "binding problem" (Treisman and Gelade, 1980; Sejnowski, 1986; Damasio, 1989).
This problem arises whenever an entity is
represented over two or more different areas, each of which is devoted to particular stimulus dimensions. In the model, for example, MO is responsive to the direction of motion of the contour, but not the orientation and precise position of the parts of which it is composed. The converse is true for OR; it is responsive to orientation and precise position of the parts of the contour, but does not respond to the overall motion of the entire stimulus.
The full
representation of the stimulus as a "moving comer" is only achieved through reentrant interactions and coherent oscillations between the two maps. Another possible instance of this problem would be the linkage of color and motion of an object, since the available evidence suggests that in the primate visual system color and movement tend to be analyzed in separate channels (Zeki, 1978; Livingstone and Hubel, 1987).
234
0. Sporns, G. Tononi, and G. M. Edelman
(iv) Global reentry. According to the theory of neuronal group selection (Edelman 1978, 1987), reentry also occurs among maps which lack common primary dimensions, among predominantly sensory and predominantly motor maps, and even among mapped and non-mapped regions. Examples could be a topographic map connected to a conceptual map, e.g. for object recognition, or to structures like the hippocampus and the basal ganglia. Furthermore, reentry is expected to take place simultaneously across several of these regions. Such an arrangement is called a global mapping (Edelman, 1987). Not much is known about the occurrence of coherent oscillations in these cases, and other mechanisms like short-term synaptic modifications (van der Malsburg, 1981) might play a role in linking together different regions through reentrant connections. Moreover, no computer simulations have yet attempted to model such complex interactions.
Whatever the actual linking mechanism might be, the
establishment of correlations across multiple brain areas by reentry represents a possible solution to the general problem of cortical integration and, as such, constitutes a fundamental ingredient in a neurobiological theory of consciousness (Edelman, 1989).
Acknowledgements.
This work was carried out as part of the Institute Fellows in
Theoretical Neurobiology program at The Neurosciences Institute, which is supported by the Neurosciences Research Foundation.
We are particularly grateful to the Office of Naval
Research for a grant in partial support of this research.
0. S. is a Charles and Mildred
Sclmurmacher Fellow. This research was carried out in part using facilities of the Cornell National Supercomputer Facility.
Dynamic Interactions of Neuronal Groups
235
References
Adelson, E.H., and J.A. Movshon (1982)
Phenomenal coherence of moving visual patterns.
Nature 300:523-525. Aertsen, A.M.H.J., and G.L. Gerstein (1985) Evaluation of neuronal connectivity: Sensitivity of crosscorrelation.
Brain Res. 340:341-354.
Albright, T.D. (1984) Direction and orientation selectivity of neurons in visual area MT of the macaque. J. Neurophysiol. 52:1106-1130. Alonso, A., and R.R. Llinas (1989)
Subthreshold Na+-dependent theta-like rhythrnicity in
stellate cells of entorhinal cortex layer II. Nature 342:175-177. Andersen, P., M. Gillow, and T. Rudjord (1966)
Rhythmic activity in a simulated neuronal
network. J. Physiol. (Land.) 185:418-428. Barlow, H.B. (1981) Critical limit factors in the design of the eye and visual cortex. Proc. R. Soc. Land. B 212:1-34. Chagnac-Amitai, Y., and B.W. Connors (1989) Synchronized excitation and inhibition driven by intrinsically bursting neurons in neocortex. J. Neurophysiol. 62:1149-1162. Damasio, A.R. (1989) The brain binds entities and events by multiregional activation from convergence zones. Neural Comp. 1:123-132. Dewan, E.M. (1964) Nonlinear oscillations and electroencephalography. J. Theor. Biol. 7:141159. Eckhom, R., R. Bauer, W. Jordan, M. Brosch, W. Kruse, M. Munk, and H.J. Reitboeck (1988) Coherent oscillations: A mechanism of feature linking in the visual cortex?
Multiple
electrode and correlation analyses in the cat. Biol. Cybem. 60:121-130. Eckhom, R., H.J. Reitboeck, M. Arndt, and P. Dicke (1989)
A neural network for feature
linking via synchronous activity: Results from cat visual cortex and from simulations. In Models of Brain Function, R.M.J. Cotterill, ed., Cambridge University Press, Cambridge, UK. Edelman, G.M. (1978) Group selection and phasic re-entrant signalling: A theory of higher brain function. In The Mindful Brain. G.M. Edelman and V.B. Mountcastle, eds., pp. 51100, MIT Press, Cambridge. Edelman, G.M. (1987) Neural Darwinism. The Theory of Neuronal Group Selection, Basic Books, New York. Edelman, G.M. (1989) The Remembered Present. A Biological Theory of Consciousness, Basic Books, New York.
236
0. Sporns, G. Tononi, and G. M. Edelman
Engel, A.K., P. Konig, C.M. Gray, and W. Singer (1990)
Stimulus-dependent neuronal
oscillations in cat visual cortex: II. Inter-columnar interaction as determined by crosscorrelation analysis. Eur. J. Neurosci., in press. Farley, B.G. (1962)
Some similarities between the behavior of a neural network model and
electrophysiological experiments. In Self-Organizing Systems 1962, M.C. Yovits, G.T. Jacobi and G.D. Goldstein, eds., pp. 535-550, Spartan Books, Washington. Finkel, L.H., and G.M. Edelman (1989)
The integration of distributed cortical systems by
reentry: A computer simulation of interactive functionally segregated visual areas. L Neurosci. 9:3188-3208. Freeman, W.J., and G. Viana di Prisco (1985)
EEG spatial pattern differences with
discriminated odors manifest chaotic and limit cycle attractors in olfactory bulb of rabbits. In Brain Theory. G. Palm and A. Aertsen, eds., pp. 97-119., Springer, Berlin. Gilbert, C.D., and T.N. Wiesel (1983) Clustered intrinsic connections in cat visual cortex. L Neurosci. 3:1116-1133. Gilbert, C.D., and T.N. Wiesel (1989)
Columnar specificity of intrinsic horizontal and
corticocortical connections in cat visual cortex. J. Neurosci. 9:2432-2442. Gray, C.M., and W. Singer (l 987a) Stimulus-dependent neuronal oscillations in the cat visual cortex area 17. Neurosci. (Suppl.) 22:S434. Gray, C.M., and W. Singer (1987b)
Stimulus-specific neuronal oscillations in the cat visual
cortex: A cortical functional unit. Soc. Neurosci. Abstr. 13:1449. Gray, C.M., and W. Singer (1989)
Stimulus-specific neuronal oscillations in orientation
columns of cat visual cortex. Proc. Natl. Acad. Sci. USA 86:1698-1702. Gray, C.M., P. Konig, A.K. Engel, and W. Singer (1989)
Oscillatory responses in cat visual
cortex exhibit inter-columnar synchronization which reflects global stimulus properties. Nature 338:334-337. Gray, C.M., A.K. Engel, P. Konig, and W. Singer (1990a)
Stimulus-dependent neuronal
oscillations in cat visual cortex: I. Receptive field properties and feature dependence. Eur. J. Neurosci., in press. Gray, C.M., P. Konig, A.K. Engel, and W. Singer (1990b)
Synchronization of oscillatory
responses in visual cortex: A plausible mechanism for scene segmentation. In Proceedings of the Conference on Synergetics of the Brain, Schloss Elmau, Germany, in press. Hata, Y., T. Tsumoto, H. Sato, K. Hatihara, and H. Tamura (1988) Inhibition contributes to orientation selectivity in visual cortex of cat. Nature 335:815-817. Hubel, D.H., and T.N. Wiesel (1962)
Receptive fields, binocular interaction and functional
architecture in the cat's visual cortex. J. Physiol. (Land.) 160:106-154.
Dynamic Interactions of Neuronal Groups
237
Ingling, C.R., and S.S. Grigsby (1990) Perceptual correlates of magnocellular and parvocellular channels: Seeing form and depth in afterimages. Vision Res. 30:823-828. Jones, E.G., and T.P.S. Powell (1970) An antomical study of converging sensory pathways
within the cerebral cortex of the monkey. Brain 93:793-820. Kammen, D.M., P.J. Holmes, and C. Koch (1989)
Cortical architecture and oscillations in
neuronal networks: Feedback versus local coupling. In Models of Brain Function. R.M.J. Cotterill, ed., pp. 273-284, Cambridge University Press, Cambridge, UK. Kammen, D.M., P.J. Holmes, and C. Koch (1990a) Origin of synchronized oscillations in visual cortex: Global feedback versus local coupling. Proc. Natl. Acad. Sci. USA, submitted. Kammen, D.M., E. Niebuhr, and C. Koch (1990b)
Neural connectivity and phase coherence
in two dimensional simulations of striate cortical neurons. Soc. Neurosci. Abstr. Koch, C., and T. Poggio (1985) The synaptic veto mechanism: Does it underlie direction and orientation selectivity in the visual cortex? In Models of the Visual Cortex. D. Rose and V.G. Dobson, eds., pp. 408-419, Wiley, Chichester. Konig, P., C.M. Gray, A.K. Engel, and W. Singer (1989)
Synchronization of oscillatory
responses in cat cortical area 17 reflects global coherency of visual stimuli.
Soc.
Neurosci. Abstr. 15:798. Kreifeldt, J. (1970) Ensemble entrainment of self-sustaining oscillators: A possible application to neural signals. Math. Biosci. 8:425-436. Livingstone, M.S., and D.H. Hubel (1987) Psychophysical evidence for separate channels for the perception of form, color, movement and depth. J. Neurosci. 7:3416-3468. Livingstone, M.S., and D.H. Hubel (1988) Segregation of form, color, movement and depth: Anatomy, physiology and perception. Science 240:740-749. Llinas, R., and A.A. Grace (1989) Intrinsic 40 Hz oscillatory properties of layer N neurons in guinea pig cerebral cortex in vitro. Soc. Neurosci. Abstr. 15:660. Llinas, R.R. (1988)
The intrinsic electrophysiological properties of mammalian neurons:
Insights into central nervous system function. Science 242:1654-1664. Lopes da Silva, P.H., A. Hoeks, H. Smits, and L.H. Zetterberg (1974) Model of brain rhythmic activity. The alpha-rhythm of the thalamus. Kybemetik 15:27-37. Luhmann, H.J., J.M. Greuel, and W. Singer (1990a)
Horizontal interactions in cat striate
cortex: I. Anatomical substrate and postnatal development.
Eur. J. Neurosci. 2:344·
357. Luhmann, H.J., J.M. Greuel, and W. Singer (1990b)
Horizontal interactions in cat striate
cortex: III. Ectopic receptive fields and transient exuberance of tangential interactions. Eur. J. Neurosci. 2:369-377.
238
0. Sporns, G. Tononi, and G. M. Edelman
Marr, D., and S. Ullman (1981) Directional selectivity and its use in early visual processing. Proc. R. Soc. Land. B 211:151-180. Matsubara, J., M. Cynader, N.V. Swindale, and M.P. Stryker (1985)
Intrinsic projections
within visual cortex: Evidence for orientation-specific local connections. Proc. Natl. Acad. Sci. USA 82:935-939. MacGregor, R.J., and R.J. Palasek (1974)
Computer simulation of rhythmic oscillations in
neuron pools. Kybernetik 16:79-86. Melssen, W.J., and W.J.M. Epping (1987)
Detection and estimation of neural connectivity
based on crosscorrelation analysis. Biol. Cybern. 57:403-414. Menon, V., and D.S. Tang (1990)
Synchronization in distributed neural systems.
MCC
Technical Report No. ACT-HI-466-89. Michalski, A., G.L. Gerstein, J. Czarkowska, and R. Tarnecki (1983) Interactions between cat striate cortex neurons. Exp. Brain Res. 51:97-107. Moore, G.P., J.P. Segundo, D.H. Perkel, and H. Levitan (1970)
Statistical signs of synaptic
interaction in neurons. Biophys. J. 10:876-900. Mountcastle, V.B. (1978) An organizing principle for cerebral function: The unit module and the distributed system. In The Mindful Brain, G.M. Edelman and V.B. Mountcastle, eds., pp. 7-50, MIT Press, Cambridge. Movshon, J.A., E.H. Adelson, M.S. Gizzi, and W.T. Newsome (1985) The analysis of moving visual patterns. In Pattern Recognition Mechanisms, C. Chagas, R. Gattass, and C. Gross, eds., pp. 117-152, Springer, Berlin. Payne, B.R., N. Berman, and E.H. Murphy (1980) Organization of direction preferences in cat visual cortex. Brain Res. 211:445-450. Pearson, J.C., L.H. Finkel, and G.M. Edelman (1987) Plasticity in the organization of adult cortical maps: A computer model based on neuronal group selection.
J. Neurosci.
7:4209-4223. Perkel, D.H., G.L. Gerstein, and G.P. Moore (1967a) Neuronal spike trains and stochastic point processes. I. The single spike train. Biophys. J. 7:391-418. Perkel, D.H., G.L. Gerstein, and G.P. Moore (1967b)
Neuronal spike trains and stochastic
point precesses. II. Simultaneous spike trains. Biophys. J. 7:419-440. Poggio, G.F., and L.J. Viernstein (1964) Time series analysis of impulse sequences of thalamic somatic sensory neurons. J. Neurophysiol. 27:517-545. Reeke, G.N., Jr., and G.M. Edelman (1987) implications for recognition automata.
Selective neural networks and their
Intern. J. Supercomp. Appl,, 1:44-69.
Dynamic Interactions of Neuronal Groups
Reeke, G.N., Jr., L.H. Finkel, 0. Sporns, and G.M. Edelman (1990)
239
Synthetic neural
modelling: A multi-level approach to brain complexity. In Signal and Sense: Local and Global Order in Perceptual Maps, G.M. Edelman, W.E. Gall, and W.M. Cowan, eds., Wiley, New York, in press. Reitboeck, H.J., R. Eckhom, and M. Pabst (1987)
A model of figure I ground separation
based on correlated neural activity in the visual system. In Computational Systems Natural and Artificial, H. Haken, ed., pp. 44-54, Springer, Berlin. Widespread periodic intrinsic connections in the tree
Rockland, K.S., and J.S. Lund (1982)
shrew visual cortex. Science 215:1532-1534. Rodman, H.R., and T.D. Albright (1989)
Single-unit analysis of pattern-motion selective
properties in the middle temporal visual area (MT). Exp. Brain Res. 75:53-64. Schillen, T.B., and P. Konig (1990)
Coherency detection by coupled oscillatory responses -
synchronizing connections in neural oscillator layers. In Parallel Processing in Neural Systems and Computers, R. Eckmiller, G. Hartmann, and G. Hauske, eds., pp. 139-142, Elsevier. Schuster, H.G. (1984)
Deterministic Chaos, Physik-Verlag, Weinhein.
Sejnowski, T. (1986)
Open questions about computation in cerebral cortex.
In Parallel
Distributed Processing, J.L. McClelland, and D.E. Rumelhart, eds., pp. 372-389, Cambridge, MIT Press. Silva, L.R.• Y. Chagnac-Amitai, and B.W. Connors (1989)
Intrinsic oscillatory properties of
layer 5 neocortical neurons. Soc. Neurosci. Abstr. 15:660. Singer, W. (1990) Temporal coherence, a coding principle for cortical processing. Abstr. Cold Spring Harbor Symposium. Sompolinsky, H., D. Golomb, and D. Kleinfeld (1990)
Global processing of visual stimuli in
a network of coupled oscillators. Proc. Natl. Acad. Sci. USA submitted. Sporns, 0., S. Roth, and F.F. Seelig (1987)
Chaotic dynamics of two coupled biochemical
oscillators. Physica 260:215-224. Sporns, 0., J.A. Gally, G.N. Reeke, Jr., and G.M. Edelman (1989) Reentrant signaling among simulated neuronal groups leads to coherency in their oscillatory activity. Proc. Natl. Acad. Sci. USA 86:7265-7269. Sporns, 0., G. Tononi, and G.M. Edelman (1990) Coherent oscillations in a population-based model: Their role in visual perception. Soc. Neurosci. Abstr. Symonds, L.L., and A.C. Rosenquist (1984)
Laminar origins of visual corticocortical
connections in the cat. J. Comp. Neural. 229:39-47.
240
0. Sporns, G. Tononi, and G. M. Edelman
Toyama, K., M. Kimura, and K. Tanaka (1981a)
Cross-correlation analysis of interneuronal
connectivity in cat visual cortex. J. Neurophysiol. 46:191-201. Toyama, K., M. Kimura, and K. Tanaka (198lb)
Organization of cat visual cortex as
investigated by cross-correlation technique. J. Neurophysiol. 46:202-214. Traub, R.D., R. Miles, R.K.S. Wong (1989)
Model of the origin of rhythmic population
oscillations in the hippocampal slice. Science 243:1319-1325. Treisrnan, A., and G. Gelade (1980)
A feature-integration theory of attention.
~
Neuropsychol. 12:97-136. Ts'o, D.Y., C.D. Gilbert, and T.N. Wiesel (1986) Relationships between horizontal interactions and functional architecture in cat striate cortex as revealed by cross-correlation analysis. J. Neurosci. 6:1160-1170. Van Essen, D.C. (1985) Functional organization of primate visual cortex. In Cerebral Cortex. Vol. 3. Visual Cortex, A. Peters and E.G. Jones, eds., pp. 259-329, Plenum Press, New York. Van Essen, D.C., and J.H.R. Maunsell (1983) Hierarchical organization and functional streams in the visual cortex. Trends Neurosci. 6:370-375. von der Malsburg, C. (1981) The Correlation Theoty of Brain Function, Internal Report 812, Department
of Neurobiology, Max-Planck-Institute for Biophysical Chemistry,
Gottingen, West Germany. von der Malsburg, C. (1985) Nervous structures with dynamical links. Ber. Bunsenges. Phys. Chern. 89:703-710. von der Malsburg, C., and W. Schneider (1986)
A neural cocktail-party processor.
Biol.
Cybern. 54:29-40. von der Malsburg, C., and W. Singer (1988) Principles of cortical network organization. In Neurobiology of Neocortex, P. Rakic, and W. Singer, eds., pp. 69-99, Wiley. Wang, D., J. Buhmann, and C. von der Malsburg (1990) Pattern segmentation in associative memory. Neural Comp. 2:94-106. Wiener, N. (1961) Cybernetics. Second Edition, MIT Press, Cambridge. Zeki, S. (1969) Representation of central visual fields in prestriate cortex of monkey. Brain Res. 14:271-291. Zeki, S. (1978) Functional specialization in the visual cortex of the rhesus monkey. Nature 274:423-428. Zeki, S., and S. Shipp (1988) The functional logic of cortical connections. Nature 335:311317.