devices, such as PDAs (Personal Digital Assistant) or laptops, have been ...... A laptop (HP-Compac nc6120), always oriented to the north, was used for taking ...
This article has been accepted for publication in a future issue of this journal, but has not been fully edited. Content may change prior to final publication. IEEE TRANSACTIONS ON MOBILE COMPUTING
1
Nonparametric Model Comparison and Uncertainty Evaluation for Signal Strength Indoor Location Carlos Figuera, Inmaculada Mora-Jiménez, Alicia Guerrero-Curieses, José Luis Rojo-Álvarez, Member, IEEE, Estrella Everss, Mark Wilby, and Javier Ramos-López
Abstract— Indoor Location (IL) using Received Signal Strength (RSS) is receiving much attention, mainly due to its ease of use in deployed IEEE 802.11b (WiFi) wireless networks. Fingerprinting is the most widely used technique. It consists of estimating position by comparison of a set of RSS measurements, made by the mobile device, with a database of RSS measurements whose locations are known. However, the most convenient data structure to be used, and the actual performance of the proposed fingerprinting algorithms, are still controversial. In addition the statistical distribution of indoor RSS is not easy to characterize. Therefore, we propose here the use of nonparametric statistical procedures for diagnosis of the fingerprinting model, specifically: (1) A non parametric statistical test, based on paired bootstrap resampling, for comparison of different fingerprinting models; (2) New accuracy measurements (the uncertainty area and its bias) which take into account the complex nature of the fingerprinting output. The bootstrap comparison test and the accuracy measurements are used for RSS-IL in our WiFi network, showing relevant information relating to the different fingerprinting schemes that can be used. Index Terms— Received Signal Strength, Indoor Location, Fingerprinting, Uncertainty, Leave One Out, Bootstrap Resampling, IEEE 802.11b, WiFi.
I. I NTRODUCTION The indoor location (IL) problem consists of determining the physical position of mobile terminals within a network [1]–[4] and is becoming an important potential service [5], [6]. Different approaches to the problem have been recently proposed, the most popular being the use of the received signal strength (RSS) at a mobile device from a set of fixed radio devices. Such systems are attractive because the base infrastructure is typically already present in the form of the Wireless Ethernet, specifically IEEE 802.11b (also known as Wireless Fidelity, or WiFi). This approach depends on finding some functional dependence between the RSS and the position of the mobile device [7]–[9]. This is a non-trivial issue, because of the complexity of the radio propagation typical in the indoor scenario [10], [11]. The RSS information for IL applications has been processed in two different ways. On the one hand, the use of a physical radio propagation model, together with information about the building geometry, yields an estimation of the RSS in each location, which can be compared to the Authors are with Departamento de Teoría de la Señal y Comunicaciones, Universidad Rey Juan Carlos, Camino del Molino, s/n, 28943, Fuenlabrada, Madrid, Spain. E-mail to {carlos.figuera, inmaculada.mora, alicia.guerrero, joseluis.rojo, estrella.everss, mark.wilby, javier.ramos}@urjc.es. This work has been supported by Research Project TEC2007-68096-C02/TCM from Spanish Government.
actual strength measurements. These approaches are called propagation model-based techniques, and they provide good results with light calibration effort as long as the proposed propagation model and building description describes the scenario properly. On the other hand, a database of RSS measurements made at a set of known locations can be initially assembled. This is done in an off-line phase, and the resultant database is used as the training set for a statistical learning model [10], [12]–[14]. Then, in an on-line phase, the learning model is used to estimate a location from a given new set of RSS values (testing set). This technique, known as fingerprinting, generally overcomes several of the limitations of the propagation model-based approaches, specially in complex scenarios. To our understanding, though much work has been done in indoor location, there are still several open issues that have not been definitely established. First, different statistical descriptions of the RSS space has been proposed. The distribution of the RSS, its stationarity or which statistical parameters must be taken into account are still open issues. Second, technological factors such as the use of different mobile devices, such as PDAs (Personal Digital Assistant) or laptops, have been analyzed, but it is not clear which are the optimal technological choices, nor if the technologies can be mixed. And finally, many statistical learning algorithms have been proposed for fingerprinting, but it is as yet unclear if any of these approaches is significantly better than any of the others. All of these aspects are important for implementing a RSSIL system. Therefore, it is clear that quantifying the quality of a location system and comparing different approaches are important issues that must be addressed. Our first contribution is a non parametric statistical test, based on paired bootstrap resampling, which yields a clear cut-off test for comparing a single performance indicator when measured in two different fingerprinting location systems. This test can be separately applied to several different performance indicators, hence allowing to give a principled comparative evaluation of these location systems. The second contribution is the definition of two new merit figures for location accuracy, which we call uncertainty and bias. These merit figures are based on nonparametric distribution estimation and can take into account the complexity of the distribution of the RSS in indoor scenarios. Moreover, along with two other classical performance metrics, i.e. the mean distance error and the standard deviation of the error, they form a complete set of quality indicators which can be used to compare any two location systems.
Authorized licensed use limited to: Univ Rey Juan Carlos. Downloaded on June 8, 2009 09:59 from IEEE Xplore. Restrictions apply. Digital Object Indentifier 10.1109/TMC.2009.37 1536-1233/$25.00 © at 2009 IEEE
This article has been accepted for publication in a future issue of this journal, but has not been fully edited. Content may change prior to final publication. IEEE TRANSACTIONS ON MOBILE COMPUTING
In summary, given a deployed communication infrastructure, and a set of measurements of the RSS from the existing access points (APs), we propose a procedure for taking a decision about any issue that affects the location performance, such as technology or algorithms. This procedure consists of a nonparametric statistical method for performance comparison and a detailed set of merit figures. The structure of the paper is as follows. In the next section, we review the elements of the RSS-IL systems proposed in the literature that are relevant to our proposal. Then, in Section III, we present the bootstrap-based nonparametric methods for system comparison and for location accuracy evaluation. Section IV summarizes the characteristics of our WiFi network. Section V describes an experimental procedure to analyze a particular network and justifies the choice of a particular statistical method for comparing two different location systems. Section VI presents several experiments for characterizing the accuracy of several fingerprinting schemes in order to provide some examples of our proposed nonparametric statistical method. Finally, in Section VI, some conclusions are drawn. II. E LEMENTS OF RSS BASED IL S YSTEMS In this section we carry out a review of the fingerprintingbased location literature by grouping the main works according to the following aspects of the problem: the RSS features used for the location algorithm and the statistical description of the RSS, some relevant technological issues, the statistical learning algorithm used for processing the database, and the performance characterization used to evaluate the algorithms. A. Input Space For the design of an appropriate fingerprinting model, the information to be stored in a database and to be used as the input for the algorithm is a key issue, and we will call it the input space. We next summarize the most common RSS features used for the input space and the different RSS statistical descriptions found in the literature. 1) RSS Features: Signal strength information can be compiled in different ways. Most authors use the mean value of a vector of instantaneous measurements [14]–[17], and hence, the statistical structure or the temporal variability is not taken into account. In [18], a classification algorithm is presented in which this variability is used for determining the cluster to which the estimated location belongs. In probabilistic approaches, the instantaneous values for each measured location are stored in order to estimate the probability density function (pdf ) of the RSS [9], [12], [13], [19]–[23]. In [14], a significant degradation in the location estimation accuracy is observed due to changes on the orientation of the mobile device’s antenna. However, other authors [18] report that the effect of orientation can be ignored. Given that a mobile device in a given location gets the RSS from several APs, a relevant question is which APs are necessary for obtaining a required location accuracy, and very different answers have been given [12], [13], [19], [21], [24]–[26].
2
2) Statistical Description of the RSS: The RSS measured at a given location is the sum of a deterministic term, which could be predicted with an appropriate propagation model, plus a random term, which is mainly due to the non-determinicity of the wireless channel. On the one hand, many authors just assume a symmetric stationary distribution of the RSS and use the sample mean as its only representative value. On the other hand, probabilistic algorithms require a more detailed knowledge of the RSS pdf . In [9], [13], [20] a previously defined form for the pdf is assumed and its parameters are estimated from the measured samples. However, nonparametric probabilistic algorithms make no assumption on the shape of the RSS distribution, but instead it is estimated from the data using some nonparametric method [12], [19]. In [23], the non-stationarity of the distribution is considered by computing several distributions for each location at different time instants. In [9], a study of the pdf of the RSS shows a non-Gaussian, left-skewed, device-dependent, and sometimes even multi-modal distribution. B. Technology Several types of 802.11b devices have been used for the experimental setup of RSS-IL. The wireless adapter plays an important role in the performance of the location system, since it acts as the sensor of the input space. The most common wireless adapters used in IL works are Orinoco models [10], [18], [22], [27], [28] or Intel PRO/Wireless [9], [23], [26]. As shown in [9], different devices behave in a different way and generate different RSS distributions. In [29], these differences are analyzed, showing that they could cause a significant degradation of the location accuracy when the devices in the on-line and off-line phases are not the same. The measurements are usually taken with a PDA or a laptop, and using standard software (for example, NetStumbler [30] using NDIS drivers [31]). C. Statistical Learning Algorithms One of the first proposed learning algorithm that provided an acceptable solution for the RSS-IL problem was k-nearest neighbors (k-nn) [14], [32], [33], in which the measured RSS is compared with a set of RSS’s stored in a table during a previous phase. A variable number of locations in the table, given by the points that have RSS values similar to the measured one are used to estimate the location by using a possibly weighted averaging. Other approaches have considered more complex statistical models to describe the RSS distributions at several locations [12], [19], [20]. In [22], a Bayesian Network is used to infer the location of a device and the likelihood that the owner of the device will inhabit a particular location is incorporated into the Bayesian Network. In [19], a clustering technique is used in order to constrain the search space and to reduce the complexity of the algorithm. In [34], the information of the visibility of each AP is included in a Bayesian method to improve the robustness of the algorithm. Recently, modern tools from statistical learning, such as Neural Networks (NN) or Support Vector Machines (SVM) [15], [24], [35], [36], have also been
Authorized licensed use limited to: Univ Rey Juan Carlos. Downloaded on June 8, 2009 at 09:59 from IEEE Xplore. Restrictions apply.
This article has been accepted for publication in a future issue of this journal, but has not been fully edited. Content may change prior to final publication. IEEE TRANSACTIONS ON MOBILE COMPUTING
applied to the problem of IL in WiFi networks, aiming to improve the location accuracy. When comparing the performance of all these algorithms, there seems to be no clear winner. In fact, it has even been suggested that none of the fingerprinting based location algorithms performs better than any of the others, despite the amount of literature on this topic [15]. To our understanding, the lack of a clear procedure for comparison among the different fingerprinting schemes is one of the sources of this controversial. D. Performance Characterization Several comparative studies have been conducted, aiming to establish the higher performance of each proposed fingerprinting technique. The two most relevant elements for characterizing the performance of an algorithm are the performance metric used, and the statistical method for estimating that metric. Here, we go through the most representative comparison studies of fingerprinting algorithms. We will see that no clear performance comparison framework has yet been established. Most works on comparison use the same two performance metrics to evaluate algorithms: (1) the mean distance error, computed by averaging the euclidean distance between the estimated and the actual location; and (2) the cumulative distribution function (cdf ) of the errors. In order to estimate these quality indicators, a testing set of N points is used to compute N local estimates of the performance metric, and then the average or the cdf are calculated from these estimates. In [37], three fingerprinting models (k-nn, NN, and probabilistic) are compared with this method, concluding that k-nn exhibits a better global performance. In [15] the compared algorithms are k-nn, Generalized Radial Neural Networks and a MultiLayer Perceptron (MLP), but the conclusion here is that all of them have similar performance. In [18], the k-nn is compared with a NN and a probabilistic algorithm, but in this case the NN algorithm is the winner. In this work also the number of times that a point is classified in the wrong cluster is used as a performance metric. Another interesting comparison among four representative techniques (weighted k-nn, MLP, probabilistic method, and SVM) is presented in [10], where the problem is addressed as a classification one, and the number of classification errors is used as a performance metric. In this case, the leave-one-out technique is used to estimate the mean distance error and all the fingerprinting techniques seem to have a similar performance. Finally, [27] describes the limits of location performance in indoor environments. Three area-based algorithms are developed which do not return a single location point, but instead a possible area containing it. The development of these algorithms attempts to facilitate the computation of the location uncertainty (called precision in this work) measured as the size of the returned area. In fact, precision is not computed by the comparison method but is returned by the algorithm itself, so this performance metric might not be easily applied to any given algorithm. The authors also conclude that all the classical approaches have a similar performance in accuracy.
3
E. Concluding Remarks To summarize the previous review, we can point out the main key aspects of the problem of comparing two fingerprinting schemes as follows. Several quality indicators have been used in the literature, but none of them seems to be conclusive enough. In fact, some authors [12] have pointed out that a fair comparison of the performance of different methods is a difficult task, because there are no standardized test procedures in this application field. Other authors claim that the main difference between algorithms is their location uncertainty, but there is not a well established method to quantify this parameter. The number of used samples for estimating the quality indicators is often small, and the accuracy of the estimation methods have not been analyzed in detail. As a result of all of these limitations, very different and even contradictory comparison results have been obtained, and they might be network-dependent. After all the considerations discussed in this section, our proposal has two main contributions: A non parametric statistical test for comparison of different fingerprinting models, and two new quality indicators (uncertainty and bias) which take into account the complex nature of the fingerprinting output. III. N ONPARAMETRIC S TATISTICAL A NALYSIS This section summarizes the theoretical fundamentals of our proposal for accuracy evaluation and model comparison in fingerprinting systems. We start with a brief outline of bootstrap resampling principles in order to provide the basic understanding and notation of this technique and to make this section self-contained. Then we propose a generic problem statement for fingerprinting systems based on statistical learning theory. Using this foundation, we introduce the proposed two new performance indicators for fingerprinting systems. Finally, we propose a new statistical test for comparing between two fingerprinting systems. A. An Introduction to Bootstrap Resampling Bootstrap resampling techniques provide a useful method for nonparametric estimation of the pdf of statistical magnitudes in a wide number of applications. Bootstrap techniques have shown to provide very accurate estimations of statistical magnitudes even when the observation set is small. Therefore, we propose to use it for estimating the performance indicators used in this work and to compare these performance indicators for different fingerprinting models. A detailed description and discussion on nonparametric bootstrap resampling can be found in [38]. We briefly present here the basic elements of bootstrap resampling. Let Z = {zj , j = 1, . . . , N } be a set of N observed measurements, which have been obtained from sampling an unknown distribution fz (z), and be u a statistical magnitude which is estimated from the sample using an operator O on the observed set, this is, u = O(Z). For instance, u can represent the sample average used to estimate the mean value of fz (z). Then, the question we want to answer here is how good the estimator u is, or, from an analytical perspective, which is the distribution of u, that is, fu (u). Since the actual fz (z) is
Authorized licensed use limited to: Univ Rey Juan Carlos. Downloaded on June 8, 2009 at 09:59 from IEEE Xplore. Restrictions apply.
This article has been accepted for publication in a future issue of this journal, but has not been fully edited. Content may change prior to final publication. IEEE TRANSACTIONS ON MOBILE COMPUTING
4
unknown, only a finite number of samples are available, and the operator O can be complex, fu (u) may be impractical to compute. For this purpose, the bootstrap principle works under the assumption that the set Z contains enough information about fz (z), such that we implicitly approximate the unknown pdf with the empirical one, given by: fz (z) � fˆz (z) =
N 1 � δ(z − zj ) N j=1
(1)
where δ(z) is the Dirac’s delta function. Then, we proceed by taking different resamples from this empirical distribution, which is equivalent to construct different resamples of Z. A set Z ∗ (b) is called a resample from Z when obtained by sampling with replacement up to N elements of Z, and accordingly, each observed measurement in Z will be present in Z ∗ (b) zero, one, or several times. The plug-in-principle, which is a fundamental assumption in bootstrap techniques, states that any operator applied to the actual pdf fz (z) has a bootstrap replication when applying it to fˆz (z). Hence, a replication of the statistical u is defined as the value obtained when using operator O on the resample, this is, u∗ (b) = O(Z ∗ (b)), and it represents an estimate of the statistic. By repeating the resampling and replication B times, a set of estimates are obtained for the statistic, i.e., {u∗ (1), . . . , u∗ (B)}, which by the plug-in principle, can be used to build the searched estimation of the pdf of this statistic, this is, fu (u) � fˆu (u) =
B 1 � δ(u − u∗ (b)) B
(2)
b=1
B. Problem Statement and Notation One of the basic elements of IL systems in WiFi networks is the use of learning-from-samples algorithms. Now we introduce a problem statement based on statistical learning theory which provides the notation for the rest of the paper. Let us assume that we have n APs in our network. At a given location, the RSS from the ith AP is a stochastic process denoted by RSS i (t). The vector RSS(t) = {RSS 1 (t), . . . , RSS n (t)} contains the raw temporal information for all the APs. Instead of using this raw temporal information, some features can be obtained for characterizing the algorithm input space. For instance, using the median value of the RSS’s over a given time interval, the input space would be RSS = [median{RSS 1 (t)}, . . . , median{RSS n (t)}] ∈ Rn for a given location. Direct and Inverse Problems. For the sake of simplicity, we develop the theoretical framework for a two dimensional location problem. The generalization for multi-dimensional problems is straightforward. Let v = [x, y] denote the vector containing the coordinates in a 2 dimensional IL problem (for instance, data from a single level in a building). A functional relationship between the coordinates and the measurement vector can be stated, which is given by RSS(v) = gf (v) + r(v)
(3)
where gf : R2 −→ Rn represents the physical radioelectric equations, and accounts for the typically nonlinear, deterministic, and predictable component of the RSS, and r is the RSS non-deterministic component. Equation (3) is a direct problem statement, and the estimation of gf from the knowledge of both the radioelectric field equations and the building characteristics has been addressed in IL systems [14]. Instead of a direct problem statement, fingerprinting systems follow an inverse problem approach, which avoids the explicit knowledge of the radioelectric equations and of the building geometry. The purpose of this approach is to define an equation to estimate a spatial location from a given RSS vector, this is, v = gf−1 (RSS) + e(RSS)
(4)
where e is the nondeterministic component, and gf−1 (.) needs to be estimated. For this purpose, the use of a set of RSS examples measured in a grid of N known locations is required. This set is called the training set and is denoted here as A ≡ {A1 , A2 , . . . , AN }, with Al = (RSS l , v l ), the measurements from n sensors and the corresponding known locations. Then, the problem consists of estimating the inverse of gf (.) with some nonlinear function using the information of the training set. Hence, we assume a model h(A, w) : Rn −→ R2 , which is capable of approximating the nonlinear mapping from the input space to location v, where w is a vector parameter which characterizes model h. Therefore, our learning-from-samples problem can be stated as follows: Using the samples in training set A, find the parameters w such that, for a given observation RSS, an estimate of v is obtained. Weight parameters w are obtained by optimizing a cost function, also known as risk [39], which is a performance measurement, denoted by Jh (Al ). Thus, learning is usually based on the minimization of an empirical estimate of the mean risk (called the empirical risk), given by Jhemp (A) =
N 1 � Jh (Al ) N
(5)
l=1
For instance, usual criteria are the Mean Absolute Error, where Jh (Al ) = ||h(Al , w) − v l ||1 , or the Mean Squared Error, where Jh (Al ) = ||h(Al , w) − v l ||22 . The minimization of the empirical risk yields an estimation of the weight vector, this is, wopt = arg min Jhemp (A) w
(6)
and a wide number of learning-from-samples algorithms, such as k-nn, NN, SVM, and many others, are in general available for this purpose. Finally, it is important to point out that the learningfrom-samples algorithms have a set of free parameters which affects the algorithm performance and hence must be adjusted properly. For this purpose, the risk Jh is computed for different possible values of the parameters using an independent set of samples, obtaining the so-called actual risk. The values which minimize the actual risk are chosen as the algorithm optimum parameters.
Authorized licensed use limited to: Univ Rey Juan Carlos. Downloaded on June 8, 2009 at 09:59 from IEEE Xplore. Restrictions apply.
This article has been accepted for publication in a future issue of this journal, but has not been fully edited. Content may change prior to final publication. IEEE TRANSACTIONS ON MOBILE COMPUTING
5
to use Parzen window density estimation as an appropriate method for estimating pvˆl (v) from V l . The Parzen approach estimates the pdf by interpolation, placing a kernel κσl on ˆ l (b), this is, each of the B locations v
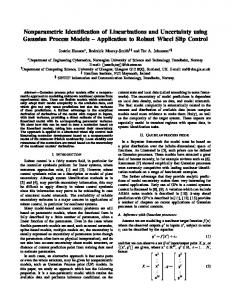
Estimated pdf Plane π
pˆvˆl (v) =
(8)
b=1
Contour lines Area = 1.53 m2
Fig. 1. Calculation of the Uncertainty parameter on a 2-D space by estimation of the empirical pdf of the fingerprinting predicted location. For easy of area visualization, the contour lines comprise the 50% of probability.
C. Performance Indicators In order to characterize the performance of a fingerprinting scheme, we need to choose the metrics to be used. In this work we propose to use a set of four performance indicators for comparing two fingerprinting systems. Two of them have been widely used in the literature, the Mean Distance Error (MDE), which indicates the magnitude of the averaged distance error, and the standard deviation of the error (STD), which gives a measure of the error variability. However, when using the MDE and the STD, we are implicitly assuming that the two dimensional distance error distribution is radially symmetric. In order to complement the information given by MDE and STD in the cases when distance errors are not radially symmetric, and to consider relatively complex distributions for the distance errors, we propose to use two new accuracy indicators: the Uncertainty (UNC), and the Bias (BIA). Uncertainty. We define the Uncertainty as the size of the region where the estimated location of a target point is to be given with a probability α. The procedure for computing this parameter is described as follows. Let v l be a particular location which is estimated with vˆl from the feature vector RSS l . As seen before, vˆl = h(A, wopt )
B 1 � ˆ l (b)) κσl (v − v B
(7)
Then, v ˆl is a random variable that depends on the distribution of the training data. Firstly, assume that this distribution is known. In this case, the pdf of v ˆl , denoted as pvˆl (v), can be calculated by using that distribution and (7). From pvˆl (v), the area that contains a fraction α of the total volume of the three-dimensional pdf can be computed, yielding the UNC parameter. Secondly, consider that the distribution of the data is not available, but instead a set of B estimates V l ≡ {ˆ v l (b), b = 1, . . . , B}, which empirically represents the distribution pvˆl (v) is available. Therefore, a method for estimating pvˆl (v) is needed and, since we do not make any assumption on the distribution of the location estimates, a non-parametric method must be used for this purpose. Parzen window density estimation [40] is a non-parametric tool which does not make any assumption on the data distribution. Moreover, it is accurate even when the number of samples is small, and it is rather simple to implement. For these reasons, we propose
where κσl is chosen here to be a symmetric non-negative kernel function that integrates to one, and σl > 0 is the kernel smoothing parameter. The choice of the kernel, according to [40], must fulfill two conditions: Being non-negative and integrating to one (this can be assured by requiring the kernel itself be a density function). Among kernels which satisfies these conditions, Devijver and Kitler [41] propose to use kernels with a maximum in the origin and monotonically decreasing as the distance from the origin increases. Although different kernels can be proposed, the most widely used is the gaussian kernel. In our experiments, we have considered an spherical Gaussian kernel [41], i.e., � � ˆ l (b)||2 1 ||v − v ˆ l (b)) = (9) κσl (v − v exp − 2πσl2 2σl2 ˆ l (b) and σl are the Gaussian center and the Gaussian where v width, respectively, and ||.||2 is the square of the Euclidean norm. To determine parameter σl , according to [42], a set of possible values for σl are tested using the leave-oneout method. This method consists of removing each sample and estimating the distribution with the rest of the samples, measuring the error for the removed sample. The error is computed for each sample and the mean error is computed for the tested value of σl . The best value for σl is the one which provides the lowest mean error. From the estimation of the pdf (8), we can determine the level curve comprising 100α% of probability, as well as the size (in square meters) of the corresponding area, which is our parameter UNC. Useful values for α are in the interval 0.8 to 0.95, given that lower values would give little information, whereas higher values would take into consideration odd points of the pdf . Figure 1 shows an example of the steps followed to obtain the uncertainty level. The starting points are the black dots in the xy plane, which represent the set ˆ l , obtained with bootstrap resampling of B estimations of v method. The 3 dimensional mesh surface is the estimated pdf with spherical Gaussian kernels (for σ = 0.23, obtained according to [42]). For a clearer view, we indicate the plane π such that the part of the estimated pdf above plane π integrates to 0.5 (instead of 0.9). The corresponding contour lines (intersection between π and the pdf ) are shown both on plane π and on the xy plane. The area encompassed by the contour lines is the value of parameter UNC, 1.53m2 for this example. This represents a non parametric estimation of the distribution of the estimated location, and it is flexible enough to detect relatively complex distributions, such as nonGaussian or unconnected ones. Bias. We define parameter BIA as the distance between the center of gravity of the uncertainty area and the actual location. This parameter complements the information given by UNC:
Authorized licensed use limited to: Univ Rey Juan Carlos. Downloaded on June 8, 2009 at 09:59 from IEEE Xplore. Restrictions apply.
This article has been accepted for publication in a future issue of this journal, but has not been fully edited. Content may change prior to final publication. IEEE TRANSACTIONS ON MOBILE COMPUTING
Given a particular location, a system which provides estimates concentrated in a small area but far away from the actual point, will have a small uncertainty but also a high bias, that is, the estimation will be stable and not spatially scattered, but the quality of the location system will be poor. D. Statistical Methods for Computing the Performance Indicators We describe here three non-parametric statistical methods to compute the quality indicators described in Section IIIC. Although we propose the third one for our comparison framework, it is useful to describe also the leave-one-out method and the local estimation method as generalizations of what has been done in previous works. Leave-one-out Method. This technique computes a local estimation of the distance error for each location v l in the training set. First, it is necessary to extract (i.e., to leave out) the lth sample Al from the training set A, and then to build a new training set A�l ≡ {A1 , · · · , Al−1 , Al+1 , · · · , AN } with the remaining N − 1 measurements. Then, an estimate ˆ l , is obtained from this new training set of v l , denoted by v and the RSS corresponding to v l . A local estimation of the distance error is computed by DEl = ||ˆ v l − v l ||2 . Repeating this procedure for all the locations, a set of estimates of the distance error is obtained. From this set, the mean value of the distance error (MDE) can be computed as its sample mean. Note that the estimator of the MDE will have a high variability since it is derived from local estimators which will be highly spatial dependent. Local Estimation Method and Quality Maps. Most works in fingerprinting literature measure the quality indicators using a local procedure, and then average the obtained set of local indicators to estimate the global performance parameter. We describe a similar approach, in which the local estimation is carried out using a bootstrap technique. For a given location v l , we again extract the corresponding sample from the training set and construct a new one, A�l , as in leave-one-out technique. Then, a set of B bootstrap replications of A�l can be built, and each of the resampled training sets {A∗l (b), b = 1, · · · , B} can be used to obtain an estimation of the actual location v l , which is a replication of ˆ l . In this way, we obtain a set V ∗l ≡ {ˆ v ∗l (b), b = 1, . . . , B} v ˆ l . From V ∗l that we consider as an empirical distribution on v a local estimation of the four quality indicators proposed in this work can be obtained. A local estimation of the MDE and STD can be computed, respectively, as the mean and the standard deviation of the error distances between the points in V ∗l and the actual point v l . For computing the UNC and BIA parameters, the procedure described in Section III-C is used by applying the plug-in principle and hence substituting the set of estimated points V l with its bootstrap replication V ∗l . We call this method local estimation method. With the preceding resampling scheme, local estimations of performance can be obtained. If these local estimations of the four quality indicators are graphically represented, a Quality Map is obtained. This can be used as a representation of the spatial (local) distribution of the quality indicators.
6
Bootstrap Method. With this non-parametric method, a set of estimates of the global parameters are obtained using a bootstrap approach. Then, the global performance parameter is computed as the average of the obtained set of estimators. Now, since the spatial dependence of each estimate is small, the variability of the resulting distribution will be reduced and the accuracy of the estimator will be higher than in the other two proposed methods. For this reason, this is the method we propose in this work. The method is described as follows. First, B resamples are taken from the whole set of samples, A, which are denoted by A∗in (b), with b = 1, · · · , B. Since each resample is obtained by sampling with replacement of the training set, each sample of set A is included in A∗in (b) several, one, or zero times. Another subset A∗out (b) is obtained as the set difference between A and A∗in (b). Second, the set A∗in (b) is used as a training set and the algorithm is evaluated in each of the points of A∗out (b), which contains Q(b) samples with locations v outq with q = 1, · · · , Q(b). Then the corresponding Q location estimations v ˆoutq and the corresponding Q distance error values (DEoutq = ||v outq − v ˆoutq ||2 ) are obtained. ˆ Finally, a global estimate of MDE and STD, that is M DE(b) and STˆD(b) is obtained for each A∗out (b) by applying the corresponding sample operator (mean or standard deviation) on the set of Q distance error values. Repeating this procedure for each of the B initial resamples, an empirical distribution of the global quality indicators is obtained. When computing the UNC and BIA parameters, the final step of the procedure is slightly different. As these parameters account for the distribution of the location estimation of one point, a distribution must be estimated for each of the Q validation points. Hence, a new resampling process of B � resamples of the training set A∗in (b) is needed, denoted by A∗in (b, b� ), with b� = 1, · · · , B � . Using this new resampling, B � estimated locations are obtained for each of the Q validation points. Then the procedure described in Section III-C can be applied to those B � points to compute the UNC and BIA ˆ C q (b) and estimates for each location v outq . Specifically, U N ˆ BIAq (b) with q = 1, · · · , Q. Finally, for each of the B initial resamplings the estimation of UNC and BIA is the ˆ C(b) = mean corresponding Q values, that is U N �Qof the 1 ˆ q=1 U N C q (b). Q
E. Model Comparison with Paired Bootstrap Hypothesis test. We want to make a statistical comparison between any two fingerprinting models, which we will generically call Model 1 and Model 2. Note that we use the label Model to denote the whole set of technological and algorithmic elements that constitute the location system. For this purpose, we establish a decision statistic and a hypothesis test for deciding whether the differences between Model 1 and Model 2 are statistically relevant or not in terms of that decision statistic. Let Jh,M 1 and Jh,M 2 denote the quality indicators obtained for Models 1 and 2, respectively. A suitable hypothesis test is
Authorized licensed use limited to: Univ Rey Juan Carlos. Downloaded on June 8, 2009 at 09:59 from IEEE Xplore. Restrictions apply.
This article has been accepted for publication in a future issue of this journal, but has not been fully edited. Content may change prior to final publication. IEEE TRANSACTIONS ON MOBILE COMPUTING
the following: � H0 : Models 1 and 2 have the same risk H1 : Models 1 and 2 have different risk
7
H0 is fulfilled: None of M1 or M2 is better in terms of risk Jh
Jh,M 2 (b) = ΔJ(b) =
H1 is fulfilled: M1 outperforms M2 in terms of risk Jh
(12)
act ∗ Jh,M 1 (Aout (b))
(13)
Jh,M 1 (b) − Jh,M 2 (b)
(14) (15)
act ∗ Jh,M 2 (Aout (b))
0
(11)
Paired Boostrap. In order to approximate the pdf of Jh,M 1 , of Jh,M 2 , and subsequently of ΔJ, we propose to use a paired bootstrap resampling method. For this purpose, we use exactly the same resampling sets, A∗in (b) and A∗out (b) for computing the model quality indicator, that is Jh,M 1 (b) =
PCI (Jh,M1 - Jh,M2) כ0
(b)
An estimation of the confidence interval for ΔJ, which we call Paired Confidence Interval (P CI), can be easily obtained from bootstrap resamples ΔJ(b). Now the null hypothesis is fulfilled if the PCI contains the zero point. Otherwise, the alternative hypothesis is fulfilled and we can state that one model outperforms the other in terms of the quality indicator Jh . Both situations are illustrated in Figure 2. In Figure 2(a), the PCI contains the zero point, and therefore H0 is fulfilled and none of the models can be considered to outperforms the others in terms of Jh . In Figure 2(b) the PCI does not overlap the zero point and contains negative values, so the risk for Model 1 is lower than the risk for Model 2, so the first one outperforms the other in terms of Jh . Following a similar reasoning, if the result is similar to the one presented in Figure 2(c), Model 2 outperforms Model 1 in terms of Jh . We propose to use this hypothesis test as a clear cut-off test for model comparison in terms of any performance indicator Jh . Note that if we use the same resampling for estimating the quality indicator for both models, we are controlling the resampling variability of the ΔJ estimate, and the variance of the estimator will be due to the differences between the models. This approach is called a paired bootstrap test. A detailed discussion on bootstrap resampling for hypothesis test can be found in [38]. IV. O UR N ETWORK The network system measured was within our office complex. The building we occupy is also the library of our university, and as such, it is subject to very volatile changes in occupancy. The section of the building in which the measurements were taken is 460m2 of size, 13m long in the x axis and 43m long in the y axis. This area corresponds to 8 rooms, two small halls and a long corridor. The whole plant and the experimental area, marked by bold line, are shown in Figure 3. Within this region, we had a grid of specific
PCI (Jh,M1 - Jh,M2) כ0
(c)
0
H1 is fulfilled: M2 outperforms M1 in terms of risk Jh Fig. 2. Examples of the three possible results of the paired bootstrap test: (a) none of the models is better in terms of the considered risk, Jh ; (b) Model 1 outperforms Model 2 in terms of the considered risk, Jh ; and (c) Model 2 outperforms Model 1 in terms of the considered risk, Jh .
AP4 AP3
AP2
43m
then the hypothesis test can be stated as: � H0 : ΔJ = 0 H1 : ΔJ �= 0
0
(10)
where H0 , H1 denote the null and the alternative hypothesis. If we define the risk difference as ΔJ = Jh,M 1 − Jh,M 2
PCI (Jh,M1 - Jh,M2) כ0
(a)
AP1
y
13m x
Fig. 3. Floor plan of the building used in our experiments. The box with dashed line indicates the region where the measurements were taken.
established and previously known locations. The spacing of this grid was approximately one meter, and all measurements were made only at these specific locations. In this way, we could reference measurements through time as well as space. Within the sampling region, we measured RSS from 4 APs distributed over the first floor. The APs were Proxim ORiNOCO AP-700, using software version 3.1. Each AP used an external antenna, HyperLink Technologies 3.5 dBi ceiling mounted antennas. V. P RACTICAL P ROCEDURE D ESCRIPTION The purpose of the nonparametric method described in Section III is to provide a complete set of quality indicators and a clear and easy-to-use cut off test to compare different location models in terms of any performance metric. In this section, the experimental procedure is developed in detail in order to
Authorized licensed use limited to: Univ Rey Juan Carlos. Downloaded on June 8, 2009 at 09:59 from IEEE Xplore. Restrictions apply.
This article has been accepted for publication in a future issue of this journal, but has not been fully edited. Content may change prior to final publication. IEEE TRANSACTIONS ON MOBILE COMPUTING
8
A. Example Description The motivation for applying preprocessing filtering as a practical example for this study was that, a priori, it seemed reasonable and intuitive that a smoothing filtering of the data could partially reduce the noise level present at the input space. The question was if it would improve or degrade the performance of a fingerprinting system and more importantly if it would have any significant effect. To test the hypothesis, we built two different fingerprinting models for this first comparison: Model 1, which used a spatial median filtering on the RSS before using the algorithm; And Model 2, which did not use any preprocessing stage on the input space. For each location v l , the spatial median filter takes the closest points to v l constructing the set Cl . Then, for the i-th access point, the value of the RSS in v l (RSSli , i = 1, · · · , n) is substituted with the median of the RSS values of Cl , this is, � � RSSli = median RSSiCl , i = 1, · · · , n (16)
Fig. 4. Temporal median of RSS measured at each location in the grid from AP1, AP2, AP3, and AP4. RSS below threshold at -100 dBm (the sensitivity of the wireless card) are represented by the threshold level.
clarify the theoretical concepts. As a practical example, we start by analyzing the convenience of a spatial median filter for preprocessing the stored RSS data. Note that the purpose of this experiment is neither to propose a location method nor to determine whether the median filter improves or not the performance of a fingerprinting algorithm in any network. Instead, the objective is to make use of a simple example to evaluate different statistical methods for model comparison and to justify the choice of the most suitable cut off test. In this sense, the proposed bootstrap method is compared with the leave-one-out technique and the local estimation technique presented in Section III-D. Since a detailed description of the experimental procedure is presented, also some useful tools for analyzing a network deployment are provided.
where RSSiCl is the vector of RSS at locations in the set Cl for i − th AP. In our case, the neighbors closer than 1.2 m are considered for the spatial filter. Since the grid separation is about 1 m, this means 4 points at most. A laptop (HP-Compac nc6120), always oriented to the north, was used for taking the measurements. Originally, measurements for four orientations (north, east, south and west) were taken and a comparison test between them was carried out, resulting in better performance for the north orientation. Therefore, this orientation has been taken for all the experiments in this work. All the four APs represented in Figure 3 were considered for the input space. The value of the RSS corresponded to the time median value of a vector of samples acquired during 15 seconds with sampling rate of 10 ms (1501 samples). The use of the time median instead of the time average was previously checked to provide us with a simple way to discard odd values caused by fast fading and occasional measurement errors. The algorithm used for both models was k-nn. The number of neighbors used for each models has been searched among a vector of possible values between 1 and 30 using a leave-one-out technique for computing the MDE for each candidate and choosing the value of k which minimizes the MDE. The resulting optimal values are k = 1 for Model 1 and k = 2 for Model 2. B. RSS Spatial Distribution Before analyzing the fingerprinting models, it is convenient to visualize the maps of the spatial distribution of RSS in our scenario, which are depicted in Fig. 4 for the APs considered in our input space. These maps represent the median RSS received from each AP at each given location. Those locations in which an AP could not be seen because its RSS was under the device threshold (in this case, -100 dBm), were represented by a constant level equal to the threshold. A consistent behavior of the RSS with the positions of the APs and with the floor structure could be observed. Some points exhibited unexpected RSS values, which was probably a consequence of the complex propagation pattern that is typical in indoor scenarios. For example, the region in the lower
Authorized licensed use limited to: Univ Rey Juan Carlos. Downloaded on June 8, 2009 at 09:59 from IEEE Xplore. Restrictions apply.
This article has been accepted for publication in a future issue of this journal, but has not been fully edited. Content may change prior to final publication. IEEE TRANSACTIONS ON MOBILE COMPUTING
9
y
x
(a)
y
x
(b) Fig. 5. Examples of uncertainty areas for the k-nn in five locations (numbered from 1 to 5): (a) With spatial preprocessing filter (Model 1, k = 1); (b) Without spatial preprocessing filter (Model 2, k = 2).
Fig. 6.
(a)
(b)
(c)
(d)
Quality Maps of MDE and UNC, with spatial preprocessing filter (Model 1, left) and without the spatial filter (Model 2, right).
right corner of AP4 map is affected by a deep spatial fading, probably due to the metal elevator which is placed around coordinates (9,37). Also, there are two walls between AP4 and the corridor, one with girders and another thick one with small windows. As a consequence, the coverage of AP4 is clearly constrained to the right half part of the floor.
C. Uncertainty Indicators Now we illustrate the meaning and usefulness of the uncertainty indicators (UNC and BIA) with a graphical example. The procedure explained in Sections III-C and III-D for estimating uncertainty areas and its bias was carried out for each location, with B = 200 resamples. The results for some representative locations are shown in Figure 5 for
Authorized licensed use limited to: Univ Rey Juan Carlos. Downloaded on June 8, 2009 at 09:59 from IEEE Xplore. Restrictions apply.
This article has been accepted for publication in a future issue of this journal, but has not been fully edited. Content may change prior to final publication.
Model 1
IEEE TRANSACTIONS ON MOBILE COMPUTING
40
100
20
50
0
Model 2
60
2
4
6
8
10
0 40
0
2
4
6
8
10
0
2
4
6
8
10
40 20 20 0
Difference
0
10
0
2
4
6
8
10
30
0 80
20
40
10 0 -3
-2
-1 0 1 MDE (Bootstrap)
2
3
0 -5
0 MDE (Leave-One-Out)
5
Fig. 7. MDE estimation, in meters, using bootstrap (left) and leave-one-out (right), for model with spatial preprocessing filter (Model 1) and without the spatial filter (Model 2).
Model 1 and Model 2. It can be seen that the shape of the uncertainty areas is neither predetermined nor clearly given by a common pattern, but instead, they vary significantly from one point to another. Moreover, the areas can even be unconnected. This is again due to the well-known complexity of the indoor propagation phenomena, which can result in similar measurements in different locations. Note also that both algorithms tend to yield uncertainty areas that are located in the correct room. However, uncertainty areas produced by Model 1 are markedly larger than the areas produced by Model 2. D. Quality Maps With the local estimation method described in Section IIID, the local BIA, MDE, and STD can also be calculated. Then, a spatial distribution representation for each of the four quality indicators, called quality maps, can be constructed. The quality maps of two representative indicators are shown in Figure 6 for the previous models. In these maps, it can be seen that the quality indicators are highly dependent on the geographic location. Structured errors can be present in several regions, such as the area near the origin, the region around the point v = [40, 6], which corresponds to the end of the corridor, near the metal elevator, or the area close to the point v = [40, 12] which is behind the elevator. With this representation, problems with specific location measurements can easily be detected. This makes it easy to check if the performance degradation is a measurement artifact, or real. It can also be seen that the error indicators are in general higher in Model 1 than in Model 2. Additionally, the map for the UNC indicator shows more significant performance differences between both models than the MDE (and than the STD and the BIA indicators, not shown). E. Evaluation of Significant Differences Between Models We give here a comparison among the three possible alternative methods we use: (1) Leave-one-out method; (2)
Local estimation method; And (3) bootstrap method. In order to evaluate them, we compare the confidence intervals from the quality indicators histograms, following the idea that the narrower the confidence interval, the more accurate the estimation of the parameter. Moreover, we use the paired version of these three techniques to validate the hypothesis test for each quality indicator (as explained for the bootstrap method in section III-E). For each statistical method, the alternative hypothesis is fulfilled if the zero point is not contained in the PCI. We start by analyzing the performance of both models with leave-one-out method, widely used in the literature to measure the performance of RSS-IL algorithms. Right column in Figure 7 represents the histograms of the MDE estimated using leaveone-out, for Model 1, Model 2 and their paired difference, that is, the paired leave-one-out: MDE(Model 1) - MDE(Model 2). At each histogram, the left and the right vertical lines represent the 95% confidence interval, while the central vertical line corresponds to the mean value. Histogram for Model 1 has no values below about one meter (the spatial grid resolution), due to the fact that this model uses the information of only one point (the nearest neighbor) and the leave-one-out technique leaves the target location out of the training set, so the minimum estimated error turns to be the spatial grid. Also, histogram for Model 1 exhibits longer upper tails for MDE than Model 2. Partially due to the long tails in the histogram of the MDE in each model, the paired histogram obtained from leave-one-out has also long and heavy tails, which makes it difficult to establish a cut-off test when comparing the confidence interval of the histogram with the zero level. In the left column of Figure 7, the MDE estimated with paired bootstrap yields much narrower histograms, showing significant differences in the averaged MDE level between Model 1 and Model 2 (i.e., the PCI does not contain the zero point). As far as the average MDE difference is positive, it represents an advantage in performance for Model 2, even though the difference value is near to the grid resolution. We also used the histograms of the local estimation method for the four quality indicators, and compared these histograms with the ones obtained with the bootstrap method. Figure 8 shows the individual and paired histograms for two quality indicators (MDE and UNC), using both local estimation and the bootstrap technique. The bootstrap resampling method yielded narrower confidence intervals than when using the spatial distribution of the local estimations, so we conclude that the first one is more accurate. We can explain the markedly narrower histograms obtained with bootstrap method by noting that the histograms from the spatial distributions represent a local estimation of each parameter in each location, and then suffer from the spatial variability of each parameter, whereas the histogram from the bootstrap technique accounts for the distribution of the global averaged parameter. Moreover, independence among samples is not at all fulfilled in the histograms from the spatial maps, but it is respected in the bootstrap resampling of averaged merit figures. Therefore, the bootstrap method gives us more accurate estimations for all the indicators (MDE, STD, UNC and BIA) than the other two explored approaches.
Authorized licensed use limited to: Univ Rey Juan Carlos. Downloaded on June 8, 2009 at 09:59 from IEEE Xplore. Restrictions apply.
This article has been accepted for publication in a future issue of this journal, but has not been fully edited. Content may change prior to final publication. IEEE TRANSACTIONS ON MOBILE COMPUTING
11
20
Model 1
Model 1
100 50 0
2
4
6
8
10
0
12
20
Model 2
Model 2
100 50 0 4
6
8
10
20
Difference
Difference
20 0 0
1 2 3 MDE (Local Estimation)
4
5
30 20 10 0 2
4
6
8
10
12
14
16
18
20
22
Model 2
Model 2
2.5
3
3.5
4
1.5
2
2.5
3
3.5
4
20
10 0 0.2
6
Model 1
Model 1
-1
0.4
0.6
0.8
1 1.2 1.4 MDE (Bootstrap)
1.6
1.8
2
2.2
20 15 10 5 0 15
2
3
4
5
6
7
8
9
3
4
5
6
7
8
9
10 5 0
0 2
4
6
8
10
12
14
16
4
6
8
10
12
18
20
22
Difference
Difference
2
10
12
40
30
1.5
0 2
60
40
10
20 10 0 -2
0
2
14
16 18
UNC (Local Estimation)
2 20 15 10 5 0 1.5
2
2.5
3
3.5
4
4.5
5
5.5
6
UNC (Bootstrap)
Fig. 8. Histograms for MDE and UNC indicators using local estimation method (left) and bootstrap method (right). Each group shows the histogram for Model 1 (upper plot), Model 2 (middle plot) and the paired histogram (lower plot).
Finally, we used the proposed paired bootstrap hypothesis test to compare the four error indicators for both models. Table I summarizes the main results using the local estimation method histograms and the bootstrap method. For both methods, the mean and the 95% confidence interval are reported for each model and for the paired difference. Those indicators whose PCI do not overlap the origin are considered as significantly different in a statistical sense, and they are in bold figures. When using the bootstrap method, the performance in terms of MDE (P CI = [0.3, 1.5]), BIA (PCI = [0.22, 1.25]), and UNC (P CI = [1.74, 4.85]) is better for Model 2, since for the paired histogram we are subtracting the results of Model 2 from the results for Model 1. In this case, the P CI for STD contains the zero point. Then, following the theoretical framework described in Section III-E, we cannot expect that one of the two models will outperform the other in terms of STD, and they can be considered to have the same performance for that indicator. Only one indicator turns out to give statistically significant differences when using the local estimation method. The UNC parameter is in this case the one that shows an advantage for Model 2, with a PCI of [0.1, 13.6]. According to Table I, the use of a spatial median filter, though having a noise reduction effect, also has a blurring effect which is detrimental for the complete fingerprinting scheme. We also analyze the effect of probability parameter α (see Section III-C) in the paired bootstrap test for UNC and BIA indicators. In Figure 9, the mean value of the paired UNC and
BIA parameters, and their PCI, are represented. We observe that, as α increases, the uncertainty areas get larger, and the difference for the UNC parameter between Model 1 and Model 2 is also scaled. However, the PCI remains clearly above the zero point, so that the result of the test does not change for different values of α. The BIA parameter is almost constant with α, since it is related with the center of gravity of the area, which does not change significantly. Hence, although the absolutes values of these quality indicators change for different values of α, the result of the test remains stable. Two main conclusions arise from Table I. First, the confidence intervals are narrower when using the bootstrap method. Therefore, the proposed statistical procedure demonstrates a more accurate estimation of all the quality indicators. Consequently, also the PCI is narrower for the bootstrap method and it provides a more conclusive comparison between Model 1 and Model 2 for three of the four performance indicators. Second, in this experiment, the UNC indicator shows statistical significant difference between both models even when it is computed using the local estimation method, so it represents a clear difference between Model 1 and Model 2. Hence the use of the new quality indicators and the paired bootstrap for comparing two fingerprinting models has been justified. Then, we propose to use a table similar to the lower middle part of Table I as an appropriate tool for comparing two location systems.
Authorized licensed use limited to: Univ Rey Juan Carlos. Downloaded on June 8, 2009 at 09:59 from IEEE Xplore. Restrictions apply.
This article has been accepted for publication in a future issue of this journal, but has not been fully edited. Content may change prior to final publication. IEEE TRANSACTIONS ON MOBILE COMPUTING
12
6 Paired UNC UNC (m )
5
Paired BIA PCI
STATISTICAL DIFFERENCES BETWEEN MODELS ARE MARKED IN
2
4
TABLE II C OMPARISONS OF THE FOUR PERFORMANCE INDICATORS WHEN INCREASING THE NUMBER OF AP S : M EAN [95% CI]. S IGNIFICANT BOLDFACE .
3 2
BIA (m)
M DE ST D UNC BIA
1 0
0.8
0.85
α
0.9
0.95
Fig. 9. Paired bootstrap results for UNC and BIA parameters for different values of probability parameter α. The PCI is represented with vertical segments and the dashed and dotted lines represent the mean value of the paired UNC and BIA parameters respectively. TABLE I C OMPARISON OF THE FOUR PERFORMANCE INDICATORS FOR M ODEL 1 AND M ODEL 2, USING THE LOCAL ESTIMATION METHOD AND THE BOOTSTRAP METHOD :
M EAN [95% CI]. I N THE RIGHT COLUMN , THE PCI. S IGNIFICANT STATISTICAL DIFFERENCES BETWEEN M ODEL 1 AND M ODEL 2 ARE MARKED IN BOLDFACE .
M DE ST D UNC BIA
M DE ST D UNC BIA
2 APs VS 1 AP AP1, AP3 AP1 2.56 [2.15,3.18] 5.18 [4.45,5.98] 2.44 [1.65,3.70] 4.79 [3.62,6.33] 2.87 [2.34,3.57] 6.89 [5.27,8.59] 2.85 [2.44,3.46] 5.32 [4.37,6.07] 3 APs VS 2 APs AP1, AP3, AP2 AP1, AP3 1.94 [1.51,2.57] 2.56 [2.15,3.18] 2.06 [0.95,4.04] 2.44 [1.65,3.70] 2.85 [2.33,3.52] 2.87 [2.34,3.57] 2.24 [1.84,2.78] 2.85 [2.44,3.46] 4 APs VS 3 APs All AP AP1, AP3, AP2 1.85 [1.44,2.43] 1.94 [1.51,2.57] 1.73 [0.87,4.00] 2.06 [0.95,4.04] 2.71 [2.14,3.28] 2.85 [2.33,3.52] 2.14 [1.71,2.63] 2.24 [1.84,2.78]
Difference -2.62 [-3.58,-1.73] -2.35 [-4.27,-0.84] -4.02 [-6.12,-2.22] -2.47 [-3.37,-1.73] Difference -0.62 [-1.13,-0.07] -0.38 [-1.50,1.74] -0.02 [-0.81,0.55] -0.61 [-1.07,-0.20] Difference -0.09 [-0.65,0.38] -0.33 [-2.52,1.47] -0.14 [-0.52,0.24] -0.10 [-0.56,0.24]
CONFIDENCE INTERVAL CORRESPONDS TO THE
COMPARISON USING LOCAL ESTIMATION METHOD Model 1 Model 2 Difference (with filter) (without filter) M DE 2.57 [1.35,6.10] 1.81 [0.86,4.65] 0.76 [-0.2,3.0] ST D 1.70 [0.56,7.62] 1.11 [0.27,4.06] 0.59 [-0.04,3.4] UNC 11.8 [3.0,18.3] 3.5 [1.7,7.4] 8.3 (8.5) [0.1,13.6] BIAS 2.43 [0.22,10.72] 1.92 [0.23,5.94] 0.51 [-0.7,4.5] COMPARISON USING BOOTSTRAP METHOD Model 1 Model 2 Difference (with filter) (without filter) M DE 2.65 [1.92,3.43] 1.85 [1.44,2.43] 0.80 [0.3,1.5] ST D 2.81 [1.21,4.82] 1.73 [0.87,4.00] 1.08 [-0.1,3.5] UNC 6.02 [4.56,7.59] 2.71 [2.14,3.28] 3.31 [1.74,4.85] BIA 2.68 [2.16,3.33] 2.14 [1.71,2.63] 0.54 [0.22,1.25]
VI. E XPERIMENTS In this section, we apply the procedure described in Section V for three example experiments. The paired bootstrap estimations of the four quality indicators are presented in three tables, which are devoted to the study of the number of APs, the mobile devices (two PDAs and one laptop), and four representative fingerprinting algorithms, which are the k-nn algorithm, the probabilistic method in [12], the Generalized Regression Neural Network (GRNN) in [43], and the SVM algorithm in [10]. The results shown in those tables summarizes the comparison method between models, as shown in Section V. A. Experiment I: Number of Access Points We applied the procedure described in Section V for comparing the location performance when using different sets of APs. However, we did not intend to establish a procedure for selecting the optimal set of APs, since this issue has been
already addressed in the literature [26]. For this purpose, we obtained the changes in the four performance indicators when the number of APs is progressively increased from one to four, starting from AP1 (on the left end of the corridor), then including AP3 (opposite end of the corridor), then including AP2 (center of the corridor), and finally including AP4 (behind the elevator). The inclusion order was according to their a priori expected performance (from better to worse). The k-nn algorithm was used for all the models, taking the measurements with the laptop orientated to the north, and without the spatial pre-processing filter. Table II shows the four error indicators. When including AP3 all of them shows significant differences, with P CIs under the zero point (so the performance when using two APs is higher). However all of the quality indicators show that the improvement provided by AP4 is not statistically significant, and hence, from the point of view of the location system performance, AP4 could be discarded. The improvement achieved with the inclusion of AP2 is statistically significant in terms of MDE and BIA, which is still an indication that significant improvement is obtained with AP2 inclusion. Note that in the first two comparisons the couple UNC-BIA provides a difference between the two model, and only in the third case, where no difference appears to be present do these two parameters fail to show a significant statistical difference. B. Experiment II: Wireless Devices In this section we give a simple example of comparison in performance among three different devices working in the same scenario: A Laptop (HP-Compac nc6120), and two PDAs (PDA1, Dell Axim X51v; and PDA2, Fujitsu-Siemens Pocket Loox N560). The RSS measurements were simultaneously taken from the three devices orientated to the north, and they were used as the training set for a k-nn algorithm, without
Authorized licensed use limited to: Univ Rey Juan Carlos. Downloaded on June 8, 2009 at 09:59 from IEEE Xplore. Restrictions apply.
This article has been accepted for publication in a future issue of this journal, but has not been fully edited. Content may change prior to final publication. IEEE TRANSACTIONS ON MOBILE COMPUTING
13
TABLE III C OMPARISONS OF THE FOUR PERFORMANCE INDICATORS USING DIFFERENT DEVICES : M EAN [95% CI]. S IGNIFICANT STATISTICAL DIFFERENCES BETWEEN DEVICES ARE MARKED IN BOLDFACE .
M DE ST D UNC BIA
M DE ST D UNC BIA
M DE ST D UNC BIA
LAPTOP VS PDA1 Laptop PDA1 1.81 [1.46,2.41] 2.67 [2.37,3.03] 1.62 [0.87,3.81] 1.74 [1.37,2.11] 2.71 [2.14,3.28] 7.02 [5.52,8.83] 2.14 [1.71,2.63] 2.67 [2.33,3.04] LAPTOP VS PDA2 Laptop PDA2 1.81 [1.46,2.41] 3.60 [3.17,4.04] 1.62 [0.87,3.81] 2.46 [2.46,2.46] 2.71 [2.14,3.28] 4.85 [3.80,6.86] 2.14 [1.71,2.63] 4.01 [3.31,4.92] PDA1 VS PDA2 PDA1 PDA2 2.67 [2.37,3.03] 3.60 [3.17,4.04] 1.74 [1.37,2.11] 2.46 [2.46,2.46] 7.02 [5.52,8.83] 4.85 [3.80,6.86] 2.67 [2.33,3.04] 4.01 [3.31,4.92]
Difference -0.86 [-1.32,-0.25] -0.12 [-1.07,2.01] -4.31 [-6.27,-2.84] -0.53 [-1.13,0.07] Difference -1.79 [-2.39,-1.09] -0.84 [-2.32,1.61] -2.14 [-4.77,-1.13] -1.87 [-3.02,-1.06] Difference -0.93 [-1.49,-0.43] -0.72 [-1.95,-0.18] 2.17 [-0.11,3.35] -1.34 [-2.53,-0.69]
using the spatial pre-processing filter and using the four APs available. The results of this comparison are presented in Table III. According to Table III, the Laptop outperforms the two PDA devices in terms of MDE and UNC. This result was the expected behavior since the laptop has a better sensitivity. Between PDA1 and PDA2, the first one performed better in terms of MDE (PCI = [−1.49, −0.43]), STD (PCI = [−1.95, −0.18]), and BIA (PCI = [−2.53, −0.69]). The test in terms of UNC is not conclusive and we can only state that PDA1 and PDA2 had similar performance in terms of uncertainty. Hence, PDA1 provided a slightly better location performance in our WiFi network. Interestingly, in this case the comparison in terms of UNC and the comparison in terms of STD does not provide the same result. This is an example that shows that the two indicators are not always equivalent. From our point of view, the UNC indicator gives a more general description of the inherent uncertainty of the location system since it is based on a nonparametric estimate of the pdf of the location estimation. C. Experiment III: Fingerprinting Algorithm As previously seen, there is controversy concerning the performance of different fingerprinting algorithms. We have analyzed the performance of four different fingerprinting algorithms within our network. All the measurements were taken using the four APs available, and without using the spatial preprocessing filter. The algorithm used as a baseline for comparison was k-nn. We also considered the probabilistic algorithm described in [12]. In particular, the histogram method was used to estimate the pdf of the RSS time series in each point, and a maximum likelihood estimator was used to choose the location among all those possible. Only one free parameter, the number of bins of the histogram, had to be fixed for this algorithm. After some preliminary tests, 20 bins were used for obtaining a good approximation of the pdf . The data used for this algorithm were obtained using PDA1, since for technical
TABLE IV C OMPARISON OF THE FOUR PERFORMANCE INDICATORS USING k- NN VS PROBABILISTIC , GRNN, AND SVM ALGORITHMS : M EAN [95% CI]. S IGNIFICANT STATISTICAL DIFFERENCES BETWEEN ALGORITHMS ARE MARKED IN BOLDFACE .
M DE ST D UNC BIA
1.83 1.62 7.02 2.63
M DE ST D UNC BIA
1.82 1.64 2.71 2.14
k-NN VS PROBABILISTIC k-nn P robabilistic [1.50,2.39] 2.33 [1.67,3.18] [0.85,3.53] 3.06 [1.44,5.26] [5.52,8.83] 1.26 [1.02,1.61] [2.33,2.95] 3.15 [2.80,3.55] k-NN VS GRNN k-nn GRN N [1.41,2.46] 1.88 [1.53,2.55] [0.90,3.86] 1.64 [0.86,3.94] [2.14,3.28] 1.81 [1.57,2.09] [1.71,2.63] 2.18 [1.74,2.73]
1.93 1.88 2.71 2.14
k-NN VS SVM k-nn SV M [1.55,2.60] 2.76 [2.11,3.72] [1.08,3.93] 2.94 [1.60,5.05] [2.14,3.28] 5.81 [4.20,7.44] [1.70,2.63] 2.98 [2.35,3.73]
M DE ST D UNC BIA
Difference -0.50 [-1.43,0.14] -1.44 [-3.86,0.38] 5.76 [4.40,7.82] -0.52 [-0.93,-0.15] Difference -0.06 [-0.27,0.13] -0.00 [-0.43,0.39] 0.90 [0.50,1.29] -0.04 [-0.18,0.10] Difference -0.85 [-1.53,-0.35] -1.06 [-2.78,0.50] -3.10 [-5.36,-1.80] -0.84 [-1.42,-0.32]
reasons the instantaneous values are more accurate when using this device. For the remaining algorithms the laptop was used. Additionally, a GRNN was also used to give a comparison with a neural algorithm. The only free parameter analyzed was the width of the kernel function, found with a leaveone-out technique. Finally, two independent SVM with Radial Basis Function (RBF) kernels were used, one for each x and y coordinate independently, as explained in [10]. Four free parameters had to be tuned in this algorithm: The RBF width, the insensitivity parameter, the regularization parameter, and the margin for the support vectors. Since an extensive search using leave-one-out was impractical, a 10-fold algorithm was used for the free-parameters search. Table IV summarizes the comparison results. For the probabilistic algorithm, the MDE (PCI = [−1.43, 0.14]) and the STD (PCI = [−3.86, 0.38]) were not statistically different for both models, but a difference in the UNC (PCI = [4.40, 7.82]) was obtained for our setup, which was significantly better for the probabilistic algorithm. The BIA parameter (PCI = [−0.93, −0.15]) shows the k-nn algorithm to be better, but the difference is small compared with the improvement in terms of uncertainty. This can be explained as follows: The probabilistic algorithm returns the index of the most probable location, so that it can only return a point belonging to the training set and all the estimates have to fall on the grid defined by the training set. Hence we have a sparse set of estimate points, and as a consequence the pdf of the location estimations is composed of several spikes. When looking at the shape of the uncertainty area, it is then formed by unconnected small areas around the actual point, but the global area is still small. This means that we have less uncertainty about where the estimated location is (since we have very few options) but, as it can be seen with the BIA parameter, this does not mean that the expected estimated location is closer to the actual point. Note that the results for the k-nn algorithm are not the same as those obtained in the
Authorized licensed use limited to: Univ Rey Juan Carlos. Downloaded on June 8, 2009 at 09:59 from IEEE Xplore. Restrictions apply.
This article has been accepted for publication in a future issue of this journal, but has not been fully edited. Content may change prior to final publication. IEEE TRANSACTIONS ON MOBILE COMPUTING
comparisons of the other two experiments (GRNN and SVM). This is due to the fact that the device used was different. From the results of the GRNN, it can be seen that only the UNC indicator shows a statistically significant difference between the GRNN and the k-nn. However, in this case, the k-nn outperforms the neural estimator (UNC PCI = [0.50, 1.29]). Finally, in the case of SVM, we can see that this algorithm performs worse than the k-nn, in terms of MDE (PCI = [−1.53, −0.35]) and BIA (PCI = [−1.42, −0.32]), but specially in terms of UNC (PCI = [−5.36, −1.80]). In our case two independent algorithms were used for each dimension, which fails to utilize the SVM’s capabilities properly. We attribute the bad performance of the SVM to problems when tuning the free parameters, coupled with a lack of correlation between the two dimensions of the problem. VII. D ISCUSSION AND C ONCLUSIONS In this paper, a nonparametric framework for comparing fingerprinting systems has been proposed, mainly based on: (1) A clear cut-off test using paired bootstrap resampling; And (2) A complete set of merit figures, including two indicators (UNC and BIA) which quantify the location uncertainty for a fingerprinting system. There exist fundamental differences between the statistical method for model comparison proposed here and those described in Section II-D. In most works, the quality indicators used are basically the distance error, measured with its mean value or its cdf , and accuracy, measured as the number of misclassifications. We propose two new indicators (UNC and BIA) that complement the performance information. These indicators measure the uncertainty associated with the location estimation provided by each system, by taking into account the inherent complexity of the distribution of that estimate. Combining this with the newly proposed statistical method for model comparison we have a means of providing a clearer cut-off test for system comparison in terms of any performance metric. Indeed, previous works are based either on local estimation methods or on the leave-one-out method, which have been shown to produce estimators with wider confidence intervals and hence are less conclusive than the bootstrap approach. The work proposed in [27] describes the precision parameter in a similar way to what we do with the UNC parameter in this work. However, there are two fundamental differences between both works. Firstly, the areas described by Elnahrawy et al. are not computed under a statistical comparison framework, but returned by the three proposed areabased algorithms themselves. Therefore, precision parameter can not no be directly used for comparing any two given location techniques. The main contribution of that work is a useful description of the performance limits of RSS-based indoor location, not the description of a performance metric nor a methodology to compare any given couple of algorithms. Secondly, the approach taken in that work is parametric, and presumes Gaussian or t-distribution for the RSS. Our approach is a nonparametric method for computing the uncertainty in the location provided by any existing location technique. As a final conclusion, experiments show that our nonparametric approach provides a robust procedure for comparison
14
among different fingerprinting schemes, in terms of technology, number of access points, and fingerprinting algorithms. Further work will be devoted to analyzing some open issues, as the spatio-temporal correlation of the RSS indoor distribution, and the development of other fingerprinting algorithms for increasing the performance of IL systems. R EFERENCES [1] F. Gustafsson and F. Gunnarsson, “Mobile positioning using wireless networks,” IEEE Signal Processing Mag., vol. 22, no. 4, pp. 41–43, July 2005. [2] G. Sun, J. Chen, W. Guo, and K. R. Liu, “Signal processing techniques in network-aided postioning: a survey of state-of-the-art positioning designs,” IEEE Signal Processing Mag., vol. 22, no. 4, pp. 12–23, July 2005. [3] A. Sayed, A. Tarighat, and N. Khajehbouri, “Network-based wireless location,” IEEE Signal Processing Mag., vol. 22, no. 4, pp. 24–40, July 2005. [4] N. Patwari, J. N. Ash, S. Kyperountas, A. O. Hero-III, R. L. Moses, and N. S. Correal, “Locating the nodes,” IEEE Signal Processing Mag., vol. 22, no. 4, pp. 54–69, July 2005. [5] Y. Ke, J. Chen, and H. Refai, “WLAN-based, indoor medical residents positioning system,” in Second IFIP Int’l Conf. on Wireless and Optical Communications Networks (WOCN), Mar. 6–8, 2005, pp. 556–560. [6] R. Christ and R. Lavigne, “Radio frequency-based personnel location systems,” in Proc. IEEE 34th Annual Int’l Carnahan Conf. on Security Technology, Oct. 23–25, 2000, pp. 141–150. [7] A. Harder, L. Song, and Y. Wang, “Towards an indoor location system using RF signal strength in IEEE 802.11 networks,” in Int’l Conf. on Information Technology: Coding and Computing, vol. 2, Apr. 4–6, 2005, pp. 228–233. [8] M. Anlauff and A. Sünbül, “Deploying localization services in wireless sensor networks,” in Proc. IEEE 24th Int. Conf. on Distributed Computing Systems Workshops (ICDCSW), Mar. 23–24, 2004, pp. 782–787. [9] K. Kaemarungsi, “Distribution of WLAN received signal strength indication for indoor location determination,” in 1st Int’l Symposium on Wireless Pervasive Computing, Jan. 15–18, 2006, pp. 6–11. [10] M. Brunato and R. Battiti, “Statistical learning theory for location fingerprinting in Wireless LANs,” Computer Networks, vol. 47, no. 6, pp. 825–845, Apr. 2005. [11] R. Jan and Y. Lee, “An indoor geolocation system for wireless LANs,” in Proc. IEEE Parallel Processing Workshops, Oct. 6–9, 2003, pp. 442– 454. [12] T. Roos, P. Myllymäki, H. Tirri, P. Misikangas, and J. Sievanen, “A probabilistic approach to WLAN user location estimation,” Int’l Journal of Wireless Information Networks, vol. 9, no. 3, pp. 155–164, July 2002. [13] K. Kaemarungsi and P. Krishnamurthy, “Modeling of indoor positioning systems based on location figerprinting,” in Proc. INFOCOM, vol. 2, Mar. 7–1, 2004, pp. 1012–1022. [14] P. Bahl and V. Padmanabhan, “Radar: A in-building rf based user location and tracking system,” in Proc. INFOCOM, Mar. 2000, pp. 775– 784. [15] G. Wassi, C. Despins, Grenier, and C. Nerguizian, “Indoor location using received signal strength of IEEE 802.11b access point,” in Proc. IEEE Canadian Conf. on Electrical and Computer Engineering (CCECE), May 1–4, 2005, pp. 1367–1370. [16] J. Pan, J. Kwok, Q. Yang, and Y. Chen, “Multidimensional vector regression for accurate and low-cost location estimation in pervasive computing,” IEEE Trans. Knowledge Data Eng., vol. 18, no. 9, pp. 1181–1193, Sept. 2006. [17] P. P. Krishnan, A. S. Krishnakumar, J. Wen-Hua, C. Mallows, and S. N. Gamt, “A system for LEASE: location estimation assisted by stationary emitters for indoor RF wireless networks,” in Proc. INFOCOM, vol. 2, Mar. 7–11, 2004, pp. 1001–1011. [18] S. Saha, K. Chaudhuri, D. Sanghi, and P. Bhagwat, “Location determination of a mobile device using IEEE 802.11b access point signals,” in Proc. IEEE Wireless Communications and Networking Conf. (WCNC), Mar. 16–20, 2003, pp. 1987–1992. [19] M. Youssef, A. Agrawala, and A. Shankar, “WLAN location determination via clustering and probability distributions,” in Proc. IEEE Int’l Conf. on Pervasive Computing and Communications (PerCom), Mar. 23–26, 2003, pp. 143–150.
Authorized licensed use limited to: Univ Rey Juan Carlos. Downloaded on June 8, 2009 at 09:59 from IEEE Xplore. Restrictions apply.
This article has been accepted for publication in a future issue of this journal, but has not been fully edited. Content may change prior to final publication. IEEE TRANSACTIONS ON MOBILE COMPUTING
[20] D. Madigan, E. Elnahrawy, R. Martin, W.-H. Ju, P. Krishnan, and A. Krishnakumar, “Bayesian indoor positioning systems,” in Proc. INFOCOM, vol. 2, Mar. 13–17, 2005, pp. 1217–1227. [21] A. S. Krishnakumar and P. Krishnan, “The theory and practice of signal strength-based location estimation,” in Proc. IEEE Int’l Conf. on Collaborative Computing: Networking, Applications and Worksharing, Dec. 19–21, 2005, p. 10 pp. [22] P. Castro, P. Chiu, T. Kremenek, and R. Muntz, “A probabilistic room location service for wireless networked environments,” in Third Int’l Conf. on Ubiquitous Computing (Ubicomp), Sept. 30-Oct. 2, 2001, pp. 18–34. [23] A. Kushki, K. N. Plataniotis, A. N. Venetsanopoulos, and C. S. Regazzoni, “Radio map fusion for indoor positioning in wireless local area networks,” in Proc. IEEE 7th Int’l Conf. on Information Fusion, vol. 2, July 25–28, 2005, pp. 1311–1318. [24] U. Ahmad, A. Gavrilov, S. Lee, and Y.-K. Lee, “Modular multilayer perceptron for WLAN based localization,” in Proc. IEEE Int’l Conf. on Neural Networks (IJCNN), July 16–21, 2006, pp. 3465–3471. [25] O. Baala and A. Caminada, “WLAN-based indoor positioning system: experimental results for stationary and tracking MS,” in Proc. Int’l Conf. on Communication Technology (ICCT), Nov. 2006, pp. 1–4. [26] A. Kushki and A. V. K.N. Plataniotis, “Kernel-based positioning in wireless local area networks,” IEEE Trans. on Mobile Computing, vol. 6, no. 6, pp. 689–705, June 2007. [27] E. Elnahrawy, X. Li, and R. Martin, “The limits of localization using signal strength: a comparative study,” in Proc. IEEE Int’l Conf. on Sensor and Ah hoc Communications and Networks (SECON), Oct. 4–7, 2004, pp. 406–414. [28] A. Howard, S. Siddiji, and G. S. Sukhatme, “An experimental study of location using wireless ethernet,” in Proc. 4th Int’l Conf. on Field and Service Robotics, vol. 24, July 14–16, 2003, pp. 145–153. [29] S. Ito and N. Kawaguchi, “Data correction method using ideal wireless LAN model in positioning system,” in Proc. IEEE 17th Int’l Symposium on Personal, Indoor and Mobile Radio Communications, Sept. 2006, pp. 1–5. [30] Netstumbler web page. [Online]. Available: http://www.netstumbler.com [31] Ndis developer’s reference. [Online]. Available: http://www.ndis.com [32] T. Mantoro and C. W. Johnson, “ηk-nearest neighbor algorithm for estimation of symbolic user location in pervasive computing environments,” in Proc. IEEE Int’l Symposium on a World of Wireless Mobile and Multimedia Networks (WoWMoM), June 13–16, 2005, pp. 472–474. [33] A. Ault, X. Zhong, and E. J. Coyle, “K-Nearest-Neighbor analysis of received signal strength distance estimation across environments,” in Proc. IEEE First Workshop on Wireless Network Measurements (WiNMee), Apr. 2005, pp. 75–84. [34] A. Ladd, K. Bekris, A. Rudys, D. Wallach, and L. Kavraki, “On the feasibility of using wireless ethernet for indoor localization,” IEEE Trans. Robot. Automat., vol. 20, no. 3, pp. 555–559, June 2004. [35] C. Nerguizian, C. Despins, and S. Affes, “Geolocation in mines with an impulse response fingerprinting technique and neural networks,” IEEE Trans. Wireless Commun., vol. 5, no. 3, pp. 603–611, Mar. 2006. [36] R. Battiti, A. Villani, and T. L. Nha, “Neural network models for intelligent networks: deriving the location from signal patterns,” in Proc. Symposium on Autonomous Intelligent Networks and Systems (AINS), May 8–9, 2002. [37] L. Tsung-Nan and L. Po-Chiang, “Performance comparison of indoor positioning techniques based on location fingerprinting in wireless networks,” in Proc. Int’l Conf. on Wireless Networks, Communications and Mobile Computing, vol. 2, June 13–16, 2005, pp. 1569–1574. [38] B. Efron and R. Tibshirani, An Introduction to the Bootstrap. Chapman & Hall/CRC, 1994. [39] V. Vapnik, The Nature of Statistical Learning Theory. Springer Verlag, 1995. [40] O. Duda, P. Hart, and D. Stork, Pattern Classification. John Wiley & Sons, 2001. [41] P. Devijver and J. Kittler, Pattern Recognition: A Statistical Approach. Prentice-Hall International, 1982. [42] C. Archambeau, M. Valle, A. Assenza, and M. Verleysen, “Assessment of probability density estimation methods: Parzen window and finite gaussian mixtures,” in Proc. Int’l Symposium on Circuits and Systems (ISCAS), May 21–24, 2006, pp. 1–4. [43] D. F. Specht, “A general regression neural network,” IEEE Trans. Neural Networks, vol. 2, no. 6, pp. 568–576, Nov. 1991.
15
Carlos Figuera received the Telecommunication Engineering Degree in 2002 from Polytechnic University of Madrid and the M.Sc. Degree in 2006 from Carlos III University of Madrid. He is currently working as an Assistant Professor in the Department of Signal Theory and Communications at University Rey Juan Carlos in Madrid, Spain. His research interests include signal processing for wireless communications and statistical learning theory with applications to location systems.
Inmaculada Mora-Jiménez received the Telecommunication engineering degree from Universidad Politécnica de Valencia, Spain, in 1998, and the PhD degree from University Carlos III de Madrid, Spain, in 2004. Currently, she is an Associate Professor in the Department of Signal Theory and Communications at University Rey Juan Carlos in Madrid, Spain. Her main research interests include statistical learning theory, neural networks, and their applications to image processing, bioengineering, and communications.
Alicia Guerrero-Curieses received the Telecommunication Engineer Degree from Universidad de Valladolid, Spain, in 1998, and the PhD in Telecommunication in 2003 from University Carlos III de Madrid. She is currently an Associate Professor at the Department of Signal Theory and Communications, University Rey Juan Carlos in Madrid, Spain. Her research interests include statistical learning theory, pattern recognition, and their applications to wireless communications, image processing and remote sensing.
José Luis Rojo-Álvarez (Member, 01) received the Telecommunication Engineering Degree in 1996 from University of Vigo, Spain, and the PhD in Telecommunication in 2000 from the Polytechnical University of Madrid, Spain. Since 2006, he has been an Associate Professor in the Department of Signal Theory and Communications, University Rey Juan Carlos in Madrid, Spain. He has published more than 40 papers and more than 80 international conference communications. His main research interests include statistical learning theory, digital signal processing, and complex system modeling, with applications to location problems and to cardiac signal and image processing.
Estrella Everss was born in Valencia, Spain. She obtained the BA Degree (1995) and the PhD (2003) in Psychology from Universitat de Valencia, Spain. In 2007 she joined the Department of Signal Theory and Communications at the University Rey Juan Carlos in Madrid. Her research focuses on signal processing analysis for indoor location systems and for biomedical applications.
Mark Wilby has a PhD in Physics from Imperial College London. He has worked in several fields and has held both academic and commercial posts. He is currently a lecturer at the University Rey Juan Carlos in Madrid.
Javier Ramos received the B.Sc and M.Sc. degrees from the Polytechnic University of Madrid, Spain. Between 1992 and 1995 he cooperated in several research projects at Purdue University, Indiana, USA, working in the field of Signal Processing for Communications. He received the PhD degree on 1995. During 1996 he was Post-Doctoral Research Associate at Purdue University. Dr. Ramos received the Ericsson award to the best Ph.D. dissertation on Mobile Communications in 1996. From 1997 to 2003 Dr Ramos was associate professor at University Carlos III de Madrid. Since 2003 Dr Ramos is the Dean of the Telecommunications Engineering department at the University Rey Juan Carlos in Madrid. His present fields of research are Broadband Wireless Services and Technologies, Wireless Networks Security and distributed sensing
Authorized licensed use limited to: Univ Rey Juan Carlos. Downloaded on June 8, 2009 at 09:59 from IEEE Xplore. Restrictions apply.