ORIGINAL RESEARCH published: 01 December 2016 doi: 10.3389/fnins.2016.00551
Novel Methodology for Creating Macaque Retinas with Sortable Photoreceptors and Ganglion Cells Shreyasi Choudhury 1 , Christianne E. Strang 2 , John J. Alexander 3 , Miranda L. Scalabrino 1 , Julie Lynch Hill 4 , Daniel T. Kasuga 4 , C. Douglas Witherspoon 4 , Sanford L. Boye 1 , Paul D. Gamlin 3 † and Shannon E. Boye 1* † 1
Department of Ophthalmology, University of Florida, Gainesville, FL, USA, 2 Department of Psychology, University of Alabama at Birmingham, Birmingham, AL, USA, 3 Department of Human Genetics, Emory University, Atlanta, GA, USA, 4 Department of Ophthalmology, University of Alabama at Birmingham, Birmingham, AL, USA
Purpose: The ability to generate macaque retinas with sortable cell populations would be of great benefit to both basic and translational studies of the primate retina. The purpose of our study was therefore to develop methods to achieve this goal by selectively labeling, in life, photoreceptors (PRs) and retinal ganglion cells (RGCs) with separate fluorescent markers. Edited by: Stylianos Michalakis, Ludwig Maximilian University of Munich, Germany Reviewed by: Claudio Punzo, University of Massachusetts Medical School, USA Marius Ader, Dresden University of Technology, Germany *Correspondence: Shannon E. Boye
[email protected] †
Joint senior authors.
Specialty section: This article was submitted to Neurodegeneration, a section of the journal Frontiers in Neuroscience Received: 01 September 2016 Accepted: 16 November 2016 Published: 01 December 2016 Citation: Choudhury S, Strang CE, Alexander JJ, Scalabrino ML, Lynch Hill J, Kasuga DT, Witherspoon CD, Boye SL, Gamlin PD and Boye SE (2016) Novel Methodology for Creating Macaque Retinas with Sortable Photoreceptors and Ganglion Cells. Front. Neurosci. 10:551. doi: 10.3389/fnins.2016.00551
Methods: Labeling of macaque (Macaca fascicularis) PRs and RGCs was accomplished by subretinal delivery of AAV5-hGRK1-GFP, and retrograde transport of micro-rubyTM from the lateral geniculate nucleus, respectively. Retinas were anatomically separated into different regions. Dissociation conditions were optimized, and cells from each region underwent fluorescent activated cell sorting (FACS). Expression of retinal cell type- specific genes was assessed by quantitative real-time PCR to characterize isolated cell populations. Results: We show that macaque PRs and RGCs can be simultaneously labeled in-life and enriched populations isolated by FACS. Recovery from different retinal regions indicated efficient isolation/enrichment for PRs and RGCs, with the macula being particularly amendable to this technique. Conclusions: The methods and materials presented here allow for the identification of novel reagents designed to target RGCs and/or photoreceptors in a species that is phylogenetically and anatomically similar to human. These techniques will enable screening of intravitreally-delivered AAV capsid libraries for variants with increased tropism for PRs and/or RGCs and the evaluation of vector tropism and/or cellular promoter activity of gene therapy vectors in a clinically relevant species. Keywords: macaque, photoreceptors (PRs), retinal ganglion cells (RGCs), adeno associated virus (AAV), subretinal injection, lateral geniculate nuclei (LGN) injection, fluorescent activated cell sorting (FACS)
INTRODUCTION The ability to manipulate gene expression within the retina aids in our understanding of the molecular mechanisms underlying degenerative retinal disease. Furthermore, targeted gene expression in specific cell types offers the possibility of modeling human disease and developing treatment strategies. From a utilitarian perspective, it can be also used to selectively label retinal
Frontiers in Neuroscience | www.frontiersin.org
1
December 2016 | Volume 10 | Article 551
Choudhury et al.
Sorting Macaque Photoreceptors and RGCs
In this report we describe a combinatorial approach to create, in life, macaque retinas containing both sortable photoreceptors and RGCs, and methods for efficiently isolating and validating each respective cell population. This general method may be used to interrogate transduction profiles of existing vectors as well as the activity of regulatory elements used for driving transgene expression. As has been previously done with transgenic reporter mouse models (Kay et al., 2013; Cronin et al., 2014; Boye et al., 2016), this approach can also be used as a screening method for identifying novel viral vectors (i.e., within capsid libraries) best suited for targeting individual retinal cell populations in a clinically relevant species.
cells via the differential expression of fluorescent proteins. These cells can then be isolated by fluorescence activated cell sorting (FACS) for further characterization (Chan et al., 2004; Morgan et al., 2005; Akimoto et al., 2006; MacLaren et al., 2006; Dhingra et al., 2008; Lakowski et al., 2010; Pearson et al., 2012; Mansergh et al., 2015). In mice, manipulations of genes in specific retinal cell types can be achieved via traditional germline transgenesis. However, while transgenic mice are invaluable for many studies, their utility as a model for human disease is limited by substantial differences in their ocular anatomy/retinal topography relative to primates. These differences include, but are not limited to, the absence of a cone exclusive fovea (the region of the primate retina responsible for high acuity vision), differential patterns of retinal vascular and basement membrane thicknesses and a significantly smaller globe. These differences present challenges for translating findings in mice to patients with retinal disease and point to the need to develop useful models in primates. Macaques, (genus Macaca), have ocular characteristics most similar to man (Curcio and Allen, 1990; Rolling, 2004; Frenkel et al., 2005; Buch et al., 2008; Stieger et al., 2009; Beltran et al., 2010) but, due to cost and time, germline transgenesis is currently not feasible. Therefore, a different approach is necessary. Adeno associated virus (AAV)-mediated transgenesis is a frequently used method for modifying gene expression in specific retinal cell types after terminal differentiation and has been employed to create various rodent models of human retinal disease (Matsumoto et al., 1984; Qi et al., 2003; Justilien et al., 2007; Yu et al., 2012). Conversely, AAVmediated gene supplementation has been used to correct phenotypes in a myriad of retinal disease models (Boye et al., 2013; Carvalho and Vandenberghe, 2015; Schön et al., 2015). The establishment of AAV serotype and promoter combinations capable of restricting transgene expression to photoreceptors has been further extended to non-human primates (NHP; Vandenberghe et al., 2011, 2013; Boye et al., 2012; Ramachandran et al., 2016) and can be used in conjunction with a separate method that fluorescently labels retinal ganglion cells (RGCs). RGC axons project to various regions of the primate brain with the largest projection to the lateral geniculate nucleus (LGN). Fluorescent dextrans injected into the LGN of macaques undergo retrograde transport to the cell bodies of ganglion cells, thus selectively labeling these cells (Dacey et al., 2003, 2005). By combining both AAVmediated transgenesis of PRs and retrograde labeling of RGCs, the same type of experimentation carried out in mouse models with constitutively fluorescing retinal cells is now possible in macaques.
MATERIALS AND METHODS Animals Two adult, male macaques (Macaca fascicularis) were used in this study. All procedures performed on macaques were approved by Institutional Animal Care and Use Committees at the University of Alabama at Birmingham (UAB) and performed in accordance with the Association for Research in Vision and Ophthalmology Statement for the use of animals in ophthalmic and vision research. Animal AV263 (Age ∼20 years) received no in-life treatment. Retinal cells were labeled with micro-rubyTM post sacrifice. Animal SA76A (Age ∼8 years) received in-life bilateral subretinal injections of AAV to label photoreceptors and bilateral LGN injections of micro-rubyTM to label RGCs (Tables 1, 2).
AAV Vector The AAV vector comprising the 292 base pair human rhodopsin kinase promoter (hGRK1) driving GFP (Beltran et al., 2010) packaged in AAV serotype 5 has been previously described (Zolotukhin, 2005; Jacobson et al., 2006a). Virus stock at a titer of 8.0 × 10¹³ vector genomes per milliliter (vg/ml) was diluted in the same buffer used for AAV storage, balanced salt solution (BSS) (Alcon, Fort Worth, TX) with 0.014% Tween 20 (JT Baker, Philipsburg, NJ) to the delivered dose concentration of 1 × 10¹² vg/ml ∼1 h prior to subretinal injections. The vector dosing solution was allowed to warm to room temperature to prevent off-gassing during injection.
Micro-Ruby Preparation Tetramethylrhodamine and biotinylated dextran 3000 MW, lysine fixable (micro-rubyTM , #D-7162; Thermo Fisher Scientific) was reconstituted to 10% in sterile saline.
TABLE 1 | Animal and experimental details. ID#
AV263
DOB
8/17/1995
Photoreceptor Labeling
RGC Labeling
Label
Method
Label
Method
PNA- 5 µg/ml (1 mg/ml diluted 1:20) in 0.1 M PBS/5% FBS
Dissociated cells incubated with 5 µg/ml PNA for 15 min at RT
Microruby-2.5 mg/ml diluted in oxygenated Ames media
Optic nerve head incubated with 2.5 mg/ml microruby solution for 3 h at RT
Frontiers in Neuroscience | www.frontiersin.org
2
Sacrifice
4/12/2015
December 2016 | Volume 10 | Article 551
Choudhury et al.
Sorting Macaque Photoreceptors and RGCs
TABLE 2 | Animal and experimental details. ID#
DOB
Photoreceptor Labeling Injection date
SA76A
6/8/2007
5/2/2015
RGC Labeling
Vector, volume
Injection date
AAV5-hGRK1-GFP
5/27/2015
1 × 10¹²
In life imaging
Sacrifice
5/22/2015
6/3/2015
Volume Microruby injections at 6–8 sites in LGN
OS- 480 µl injected
in both hemispheres
at 5 sites
Total volume per LGN = 6 µl
OD- 250 µl injected at 5 sites
Subretinal Injections
for 3 h at room temperature, after which the eye was dissected (maintaining orientation) and the retina cut into 4 quadrants. Quadrant 1 (superior nasal retina) was set aside for use in an unrelated experiment. Retina from quadrant 2 (inferior nasal) was fixed for 1 h at room temperature in 4% PFA, washed and mounted for imaging (data not shown). Retinal tissue from quadrants 3 (superior temporal) and 4 (inferior temporal) were used to optimize cell sorting conditions as described below. The dissociated cells from quadrants 3 and 4 were incubated with 5 µg/ml Alexa-488 fluorophore-conjugated peanut agglutinin (PNA) in 1x PBS/5% FBS for 15 min at room temperature. A detailed summary of experimental design for animal AV263 can be found in Figure 1. From the eyecups of animal SA76A, 4 mm punches were made with sterile disposable biopsy punch (Sklar surgical instrument, PA Cat #SK96-1115) to isolate the macula/fovea under a dissecting microscope. The remaining OS retina was divided into superior and inferior hemispheres. The OD retina minus the macula was divided into four equal quadrants. Quadrant 1 (temporal superior retina) was kept for an unrelated experiment. Quadrant 2 (temporal inferior retina) was fixed for 1 h at room temperature in 4% PFA and mounted for imaging with a Zeiss Axioscope wide field fluorescence microscope with a 40 × 1.4 NA objective. Quadrants 3 and 4 (nasal inferior and nasal superior retina, respectively) were combined with the inferior and superior regions from the OS retina, respectively to constitute the “Superior” and “Inferior” samples. The macula/foveal punches from both OD and OS eyes were combined to constitute the “Macula/Fovea” sample. Samples were dissociated and analyzed by FACS. A detailed summary of experimental design for animal SA76A can be found in Figure 2. SA76A was perfused through the aorta with 2 L 1% Sodium nitrite/0.9% Sodium chloride, and fixed with 4L of 4% paraformaldehyde in 0.1 M phosphate buffer. The brain was stereotaxically blocked in the coronal plane at the level of the brainstem, placed in 30% sucrose in 0.1 M phosphate buffer for 3–5 days, and then sectioned at 40 µm on a freezing, sliding microtome (AO 860). All sections from the level of the optic chiasm through the posterior LGN were collected for later processing. Selected sections though the LGN were rinsed and incubated in streptavidin-HRP (Rockland, 1:1000) in PBS plus 0.5% triton X-100. They were then rinsed and reacted with 3′ , 3′ diaminobenzidine (DAB), Pierce metalenhanced solution for 12 min. Sections were rinsed, mounted
Subretinal injections in macaque eyes were performed according to our previously published methods (Boye et al., 2012). For a more detailed description, see Supplementary Materials.
In vivo Imaging In-life GFP expression was observed 20 days post-injection using a Topcon TRC 50EX fundus camera equipped with a Fundus Photo adapter, Canon EOS 6D digital camera, and New Vision Ophthalmic Imaging Software (Fundus Photo, LLC). This system employs interchangeable, custom excitation and barrier filters, and images of GFP expression were captured with a 469 nm excitation filter (Semrock FF01-469/35-32-D) combined with a 525 nm barrier filter (Semrock FF02—525/40).
Lateral Geniculate Nuclei (LGN) Injections Twenty five days post-subretinal injection and 5 days postfundus imaging, the lateral geniculate nuclei of animal SA76A were injected bilaterally with micro-rubyTM to retrogradely label RGCs as described previously (Dacey et al., 2003, 2005). For a more detailed description, see Supplementary Materials.
Tissue Processing At the time of sacrifice (32 days post-subretinal injections for SA76A), animals were deeply anesthetized and eyes were enucleated. The animals were euthanized immediately after enucleation. The anterior chamber and the vitreous were removed. The resulting eyecup was immersed in oxygenated Ames media while the retina was carefully and thoroughly isolated from the retinal pigment epithelia (RPE). Retina from the OS eye of animal AV263 was then dissected into four quadrants (Figure 1). Retinal tissue from quadrant 1 was set aside for use in an unrelated experiment. Quadrant 2 tissue was immersed in RNA later solution (Qiagen, CA, Cat #76104). RNA was extracted and cDNA prepared from this quadrant to validate macaque-specific primers to retinal expressed genes. Retinal tissue from quadrants 3 and 4 were used to optimize cell sorting conditions. Animal AV263’s OD eye was hemisected and submerged into oxygenated media as described above. To retrogradely label RGCs, the eye was stabilized with the optic nerve end up, a small piece of tygon tubing was attached to the back of the eye cup, creating a well around the severed end of TM the optic nerve. 2.5 mg/mL micro-ruby diluted in oxygenated Ames media was added to the well and allowed to incubate
Frontiers in Neuroscience | www.frontiersin.org
3
December 2016 | Volume 10 | Article 551
Choudhury et al.
Sorting Macaque Photoreceptors and RGCs
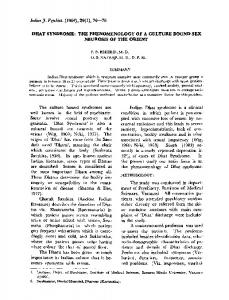
FIGURE 1 | Details of tissue processing from OD and OS eyes of animal AV263. Anterior segment and vitreous were removed from both eyes and eyecups immersed in oxygenated Ames media. Retinas were carefully isolated from RPE. The OS retina was divided into four quadrants, each intended for purposes described within the top panel. During incubation in Ames media, optic nerve from the OD eyecup was incubated in 2.5 mg/mL micro-rubyTM diluted in oxygenated Ames media for 3 h at room temperature. The OD retina was then divided into four quadrants, each intended for purposes described within the bottom panel.
FIGURE 2 | Experimental design and details of tissue processing from OD and OS eyes of animal SA76A. Subretinal injections of AAV5-hGRK1-GFP (1.0 × 10¹² vg/ml) were performed in five different sites of both OD (480 µl total) and OS (250 µl total) eyes. At 20 days post-injection, in life images (fluorescence fundus) were taken to confirm GFP expression within the subretinal blebs. Three days later, injections of micro-rubyTM were performed at a total of 9 sites (0.6 µl per site) within both lateral geniculate nuclei (LGN). At 32 days post injection, eyes were enucleated, and anterior segment and vitreous were removed. Four millimeters punches were made to isolate the macula/fovea from both eyes. The remaining OS retina was divided into superior and inferior hemispheres. The remaining OD retina was divided into 4 quadrants. Quadrant 2 of the OD eye was fixed and mounted for imaging. Quadrant 3- OD was combined with superior OS retina. Quandrant 4OD was combined with inferior OS retina. The macula/fovea punches from both eyes were combined. All pooled samples were subsequently dissociated and sorted.
Frontiers in Neuroscience | www.frontiersin.org
4
December 2016 | Volume 10 | Article 551
Choudhury et al.
Sorting Macaque Photoreceptors and RGCs
samples were free of genomic DNA contamination (data not shown).
on gel-subbed slides, and allowed to dry. They were then defatted in Xylene, and coverslipped with Permount. Whole brain sections were imaged at 2.65 µm resolution on a Canon 9000F mark II slide scanner. Contrast and brightness of images were subsequently adjusted in Photoshop for optimal clarity.
Quantitative Real-Time PCR (qPCR): Primer Design and Validation qPCR was performed using iTaqTM universal SYBR Green supermix (Bio-Rad, CA, Cat #172-5121) and CFX96 real-time PCR system (Bio-Rad laboratories, Inc., USA). Primers were validated in tenfold serial dilutions of sample. The cycling conditions were as follows: initial denaturation for 5 min at 95◦ C; 39 cycles of 15 s at 95◦ C, 30 s at 60◦ C, and a melting curve of 65◦ C to 95◦ C at an increment of 0.5◦ C per second. Data analyses, which included the determination of a standard curve, quantification cycle (Cq ) value, PCR efficiencies, slope of the standard curve and melt curve were automatically performed with the CFX ManagerTM Software system (Version 1.6; Bio-Rad Laboratories, Inc., USA). Relative expression of five different primate retinal cell- specific genes including Rhodopsin (RHO; rod specific), guanine nucleotide binding protein (G protein) alpha transducin activity polypeptide 2 (GNAT2; cone specific), glutamate receptor Metabotropic 6 (GRM6; ON bipolar cell specific), glutamate-ammonia ligase/glutamine synthetase (GLUL; Muller cell specific), and Thy-1 cell surface antigen (THY1; retinal ganglion cell-specific) was evaluated. Additionally a subset of samples was evaluated with primer pairs to the different cone opsins, M/L opsin, opsin1 (cone pigments), medium, or long-wave-sensitive (OPN1MW or OPN1LW) and S opsin, opsin1 (cone pigments), short-wave-sensitive (OPN1SW) and other RGC expressed genes, BRN3A, POU class 4 homeobox (POU4F1), melanopsin, Opsin 4 (OPN4) and Retinal pigment epithelium specific protein 65 kDa (RPE65) each assay was carried out using 2 µl (1:10 dilution) of cDNA in a total reaction volume of 20 µl containing 500 nM of each Forward and Reverse primers. A complete list of primers, their sequences, accession number used as reference sequence and their location on the respective cDNA can be found in Supplementary Table 1. All primers were designed to be identical matches to mRNA targets of M. fascicularis (used in this study) and M. mulatta unless otherwise noted. The primer pair for M/L opsin is predicted to equally amplify both M and L opsin cDNA based on annealing location and the existing polymorphisms between the two respective genes. All samples, including the standards, and negative control were run in triplicate. PCR cycling conditions were as follows: one cycle of initial denaturation at 95◦ C for 5 min; 40 cycles of 30 s at 95◦ C, 30 s at 58◦ C and 1 min at 72◦ C and a final extension step of 72◦ C for 7 min. GAPDH was used as an internal reference since all the samples used were retina and no comparison to other tissue types were made. Relative quantification was calculated with the 11Cq method. Prior to transcript analysis by qPCR, validation of all primer pair was performed conforming to MIQE guidelines (Bustin et al., 2009). Specifically standard curve analysis and confirmation of target specific by melting curve analysis (single peak) was performed utilizing the whole retina from the OS eye of AV263. No signals were detected in any of the “no template” controls (Supplementary Figure 1).
Retinal Dissociation and FACS The various retinal samples from animals AV263 and SA76A were dissociated with papain (Worthington Biochemical Corporation, NJ, Cat #3150) according to the manufacture’s protocol. In brief, papain was pre-incubated in 5 ml of Earle’s Balanced Salt Solution (EBSS) for 10 min at 37◦ C. After preincubation, 250 µl of DNase (dissolved in either 500 µl or 250 µl of EBSS) was added to a final concentration of ∼20 or 40 units/ml papain and 0.005% DNase. Dissected retina samples were placed in 15 ml falcon tubes containing 700 µl of papain/DNase and equilibrated with 95% O2 :5% CO2. Retina blocks were dissociated by incubation with activated papain at 37◦ C either for 20 or 45 min with constant agitation followed by trituration. Dissociated cells were spun down for 5 min at 2000 rpm and resuspended in 500 µl of resuspension media (430 µl EBSS, 50 µl albumin-ovomucoid inhibitor, 25 µl DNase). To prepare the density gradient, 600 µl of albuminovomucoid inhibitor was added to a 15 ml Falcon tube, and the cell suspension layered on top. Following centrifugation for 6 min at 1000 rpm, the cells were resuspended with 1x PBS/5% FBS. Dissociated cells from the retinal blocks of animal AV263 were incubated in 5 µg/ml of Alexa-488 fluorophoreconjugated PNA in 1x PBS/5% FBS for 15 min at RT before cell sorting. Sorting of PNA-positive or GFP-positive (GFP+), micro-rubyTM -positive (Ruby+) and unlabeled cells was performed on a BD FACS ARIA SORP equipped with BD FACS Diva software 8.0.1 and a 100 micron nozzle. The filters used to detect the PNA or GFP positive fraction were 505LP and 530/30BP (range 515–545 nm) off the Blue 488 nm laser. The filters used to detect micro-rubyTM were the 600LP and the 610/20BP (range 600–620 nm) off the Yellow Green 561 nm laser.
RNA Extraction and Reverse Transcription (cDNA Synthesis) FACS sorted cells were collected in 1x PBS/5% FBS, spun down for 5 min at 2000 rpm, and resuspended in lysis buffer. Total RNA was extracted from the cell lysate using the RNeasy mini RNA extraction kit according to the manufacturer’s protocol (Qiagen, CA, Cat #74104). The RNA samples were treated with DNase (to remove genomic DNA contamination) for 30 min at 37◦ C followed by 10 min at 75◦ C to deactivate DNase. The quantity and purity of RNA were determined using a NanoDropTM 2000 spectrophotometer (Thermo Scientific, MA) and 200 ng of total RNA used as template for reverse transcription using iScript Reverse transcription Supermix (BioRad, CA, Cat #1708890) at 25◦ C for 5 min, followed by 42◦ C treatment for 30 min and then 85◦ C treatment for 5 min. No RT control qPCR reactions were performed with primer pairs that targeted a discrete exon to confirm that
Frontiers in Neuroscience | www.frontiersin.org
5
December 2016 | Volume 10 | Article 551
Choudhury et al.
Sorting Macaque Photoreceptors and RGCs
RESULTS
cells when retina was dissociated for 45 min. Based on these preliminary results, we selected 45 min as the optimal duration with which to dissociate macaque retina in papain prior to sorting. However, due to the overlap of THY1 and GNAT2 in the PNA+ and Ruby+ captured cells relative to captured unlabeled cells, we concluded that labeling post-enucleation was insufficient to effectively isolate cones from RGCs. Additionally, PNA labeling only enables capture of cone photoreceptors. We therefore chose to utilize strategies that labeled RGCs and all photoreceptors in-life.
Labeling of Retinal Cells Post-Enucleation Leads to Insufficient Sorting Retina samples from animal AV263 were subjected to two different papain concentrations and incubation times that were selected based on conditions used previously by Han et al. in primate retina (Han et al., 2000). The dissociated samples then underwent FACS to isolate Ruby+ positive (561 nm), PNA+ (488 nm) and unlabeled cells. The scatter plots and the total number of micro-rubyTM , PNA positive and un-labeled cells collected under both conditions is presented in Figure 3. Regardless of the method used (20 vs. 45 min incubation in papain), some separation was achieved based on the differential profile of gene expression of THY1, RHO, and GNAT2 between the collected Ruby+, PNA+, and unlabeled cell populations (Figure 3). Ruby+ positive cells were enriched for THY1 expression regardless of the initial duration of papain incubation but GNAT2 expression was only enriched in PNA positive
Subretinal AAV5-hGRK1-GFP and LGN Injections of Micro-Ruby Efficiently and Selectively Label Primate Photoreceptors and RGCs, Respectively Subretinal delivery of AAV5-GRK1-GFP has previously been shown to drive GFP expression exclusively in rod and cone photoreceptors of all regions of macaque retina (Boye et al.,
FIGURE 3 | Isolation and characterization of macaque retinal cells labeled post sacrifice. Scatter plots show the different gating conditions used for isolating the Ruby+, PNA+, and unlabeled cells (blue rectangles) following incubation with papain for either 20 min (A) or 45 min (B). The total numbers of sorted Ruby+, PNA+, and unlabeled cells are shown below each respective scatter plot. Expression of THY1, RHO, and GNAT2 in Ruby+ and PNA+ cells following 20 min (C) or 45 min (D) papain dissociation. Expression was normalized to GAPDH and is shown relative to expression in unlabeled cells. Error bars represent SEM.
Frontiers in Neuroscience | www.frontiersin.org
6
December 2016 | Volume 10 | Article 551
Choudhury et al.
Sorting Macaque Photoreceptors and RGCs
Ruby+ and GFP+ Cell Populations Can Be Isolated by FACS
2012). Utilizing this same AAV vector, we performed a series of subretinal injections in both eyes of animal SA76A with the goal of transducing photoreceptors over a large retinal area. Prior to sacrifice, fluorescence fundus imaging was performed to assess GFP expression. En face fluorescent images revealed robust GFP expression at 20 days post-injection in both the central and peripheral retina that was restricted to the area of each respective subretinal bleb. GFP expression was observed in the macular blebs of each eye however its intensity was decreased relative to that seen in the peripheral blebs, an observation possibly due to natural pigmentation of the macular retina (Figure 4). Notably, by restricting individual bleb volumes to