This is an open access article published under a Creative Commons Attribution (CC-BY) License, which permits unrestricted use, distribution and reproduction in any medium, provided the author and source are cited.
Article http://pubs.acs.org/journal/acsodf
Novel Preparation, Microstructure, and Properties of Polyacrylonitrile-Based Carbon Nanofiber−Graphene Nanoplatelet Materials Xiaowen Wu,†,‡ Suntharavathanan Mahalingam,‡ Amalina Amir,‡ Harshit Porwal,§ Mike J. Reece,§ Valentina Naglieri,∥ Paolo Colombo,∥ and Mohan Edirisinghe*,‡ †
Beijing Key Laboratory of Materials Utilization of Nonmetallic Minerals and Solid Wastes, National Laboratory of Mineral Materials, School of Materials Science and Technology, China University of Geosciences, 29 Xueyuan Road, Beijing 100083, China ‡ Department of Mechanical Engineering, University College London, Torrington Place, London WC1E 7JE, U.K. § School of Engineering and Materials Science, Queen Mary University of London, Mile End Road, London E1 4NS, U.K. ∥ Department of Industrial Engineering, University of Padova, Via Marzolo, 35131 Padova, Italy ABSTRACT: Polyacrylonitrile (PAN) fibers containing various concentrations of graphene nanoplatelets (GNPs) were prepared by pressurized gyration, and carbon nanofibers (CNFs) were obtained after subsequent heat treatment and spark plasma sintering (SPS). The influence of processing parameters such as rotational speed, working pressure, carbonization, and SPS temperature on the diameter of the nanofibers has been studied. Furthermore, the thermal properties, morphologies, and crystallization properties of the CNFs have been investigated by using thermogravimetry, scanning and transmission electron microscopy, and Raman spectroscopy. Also, the electrical conductivity and the mechanical properties of these samples have been studied. The results suggest that the gyration conditions and the loading concentration of the GNPs significantly modified the properties of the nanofibers.
1. INTRODUCTION Carbon nanofibers (CNFs) are very promising materials in comparison to carbon fibers because of their nanostructure and superior properties. CNFs are used in many applications such as electrical devices and sensors, electrode materials for lithiumion batteries, microbial fuel cells and high-performance supercapacitors, catalysts or catalyst supports, and selective adsorption agents.1−7 Polyacrylonitrile (PAN) has been extensively studied for making carbon nanofibers because of its advantages of having a high carbon yield, compared with other polymers, and being relatively inexpensive.8−10 There are two common methods for fabricating CNFs: one is chemical vapor deposition, and the other is electrospinning followed by carbonization. Even though electrospinning is a well-established technique to generate a wide variety of polymeric fibers across the micrometer- to nanometer-scale range,10−12 this method requires high voltage (kV range) and shows poor cost−yield efficiency because essentially a single fiber emerges from the end of a nozzle carrying a polymeric solution. In the past few years, a method called pressurized gyration has been developed to form polymer fibers from the nanometer- to the micrometer-scale range. It consists of simultaneous centrifugal spinning and solution blowing and offers mass-production capabilities compared with electrospinning.13,14 Also, the diameter of fibers can be changed by varying the concentration of the polymeric solution, rotating © 2016 American Chemical Society
speed of the vessel, and the pressure of the gas added into the vessel. Graphene, a two-dimensional monolayer of sp2-bonded carbon atoms, has attracted a great deal of attention since its discovery in 200415 because of its large specific surface area,16 extraordinarily high electrical and thermal conductivities, excellent mechanical properties,17 and potentially low manufacturing cost.18 Although there exists a large body of information on graphene and its composites,19 there is a dearth of published information on graphene nanofibers, which can potentially be used as a substitute for CNFs in many applications. The reason for this could be the high cost and the difficulty in processing at high temperatures, which results in detrimental changes to the microstructure and properties. Spark plasma sintering (SPS) is an advanced technique that utilizes simultaneous application of uniaxial pressure and pulsed direct electrical current (pulsed DC) to densify powder compacts.20−25 The rapid heating rates involved minimizes damage/decomposition of graphene nanoplatelets (GNPs) by minimizing the sintering times24 and reduces the growth of nanocrystallites when synthesizing the GNPs from the amorphous phase. However, to date, no research work has Received: June 2, 2016 Accepted: July 18, 2016 Published: August 11, 2016 202
DOI: 10.1021/acsomega.6b00063 ACS Omega 2016, 1, 202−211
ACS Omega
Article
reported on the effects of SPS processing on the microstructure of CNFs, which makes this research topic timely and interesting. In the present study, PAN-based CNFs containing various concentrations of GNPs were synthesized by pressurized gyration, and subsequent heat treatments were performed using pressure-less SPS. This study focused on the influence of the additive concentration of GNPs as well as the forming parameters on the microstructure and properties of the CNFs. The morphologies and microstructures of the CNFs were studied in detail using scanning electron microscopy (SEM) and transmission electron microscopy (TEM). GNPs in CNFs were also characterized using Raman spectroscopy to understand the structural changes that took place during the hightemperature treatments.
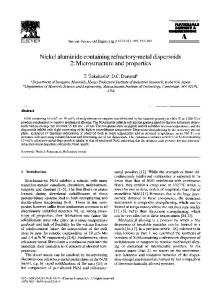
Figure 2. Schematic illustration of the pressurized gyration process.
mat on an aluminum foil placed on the inner wall of the collector. The compositions and processing parameters of the different samples are compiled and shown in Table 1.
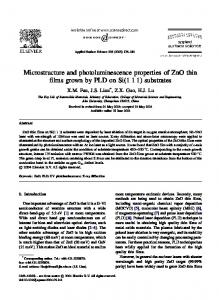
2. EXPERIMENTAL SECTION 2.1. Materials. PAN (average molecular weight 150 000; density 1.184 g/mL at 20 °C) and N,N-dimethylformamide (DMF) were purchased from Sigma Aldrich (St. Louis, MO) and used as received without further purification. The GNPs (XGNP-C750 grade) used in this study were produced by XG Science, USA, with an average thickness of ∼2 nm, diameter of 1−2 μm, average surface area of ∼750 m2 g−1, and bulk density of ∼0.2 g cm−3. A TEM micrograph of GNPs is shown in Figure 1. PX35 Continuous Tow carbon fiber was purchased from ZOLTEK (St. Charles, Missouri) and is a 50K filament fiber manufactured from a PAN precursor.
Table 1. Concentration of GNPs and Parameters of Pressurized Gyration GNP concentrationa in solution (wt %) 0 0.2 1.0 3.0 8.0
in as-spun fiber (vol %) 0 10.6 37.4 64.7 83.7
rotational speed (rpm) 10K, 24K, and 36K 10K and 24K 10K and 24K 10K and 24K 10K
working pressure (×105 Pa) 1, 2, and 3 1 1 1 1
a
The concentration of GNP in the solution was calculated by the weight of GNP divided by the total weight of GNP and PAN solution. The concentration of GNP in the as-spun fiber was calculated by the weight and density of GNP and PAN. The weight percentage value of GNP in solution has been used consistently as the GNP concentration in the following text for consistency.
2.2.2. Carbonization and SPS Processing. The as-spun PAN/GNP nanofibers were peeled off from the aluminum foil and placed in a horizontal tube furnace for heat treatment. Before carbonization, there was a stabilization process on the as-spun samples, which took place at 290 °C for 30 min. Then the samples were heated again from 290 °C with a heating rate of 2 °C/min and maintained for 1 h at 900 °C before further heating at a heating rate of 2 °C/min. Subsequently, the samples were maintained for 1 h at the final temperature under an argon gas flow (60 mL/min) for carbonization. The products were cooled to 25 °C in an argon atmosphere at a cooling rate set at 2 °C/min. This treatment was tailored to generate carbon nanofibers containing graphene. The carbonized samples were put into a 20 mm graphite crucible and then sintered in vacuum (1−3 Pa) in an SPS furnace. A heating rate of 200 °C/min was used, and the final temperature was 2000 °C, with a dwell time of 10 min. The applied DC in the SPS was 1000−1500 A, with a pulse duration of 12 ms applied at an interval of 2 ms. The CNF samples after carbonization and SPS processing are referred to in this work as pyrolyzed and after-SPS CNFs, respectively. 2.3. Characterization. 2.3.1. Average Fiber Size and Size Distribution. To measure the diameters of the as-spun PAN fibers and CNFs, an image analyzer (Image-Pro Express, Media Cybernetics Co., US) was used. At least five SEM images were
Figure 1. Typical TEM micrograph of GNPs. Specimen preparation involved ultrasonic dispersion before imaging. The as-received specification for the GNPs was 1−2 μm.
2.2. Preparation of CNFs. 2.2.1. Pressurized Gyration. The gyration solutions were prepared by dispersing an appropriate amount of GNPs (0, 0.2, 1.0, 3.0, and 8.0 wt %) in the PAN solution (10 wt % PAN in DMF). The solution was sonicated for 1 h in an ice-water bath to homogeneously disperse the GNPs. A schematic of the pressurized gyration equipment is shown in Figure 2. A cylindrical aluminum vessel, with a defined number of orifices (20) on the wall, forms micro to nanofibers by ejecting the polymer solution as the vessel is rotated at a high speed using a DC motor. An inlet pipe supplying N2 gas was connected from the top of the vessel to induce pressure in the rotating vessel. During gyration, the working pressure was varied from 1 to 3 × 10⁵ Pa by controlling the pressure of the inlet N2 gas into the vessel, and the rotational speed was varied from 10 000 to 36 000 rpm using a bi-directional regulator. The as-spun PAN/GNP precursor nanofibers were collected randomly as an overlaid 203
DOI: 10.1021/acsomega.6b00063 ACS Omega 2016, 1, 202−211
ACS Omega
Article
Figure 3. Diameter distributions for PAN-based fibers with various GNP concentrations of (a) 0, (b) 1.0, and (c) 8.0 wt % and under different conditions (as-spun, pyrolyzed, and after-SPS). n denotes the number of samples analyzed.
used for each sample. One hundred fibers were selected at random to calculate the average fiber diameter and distribution. 2.3.2. Thermogravimetric Analysis (TGA). TGA of fibers with and without GNPs was carried out on a universal V4.5A TA instrument at a heating rate of 3 °C/min to 1000 °C in a nitrogen atmosphere. 2.3.3. Morphology and Crystallization. The CNFs prepared before and after SPS were repeatedly washed using deionized water and dried in an oven. A field-emission scanning electron microscope (Hitachi S-3400N) was used to examine the morphologies of the prepared CNFs. The phase identification of the CNF samples was performed using a Renishaw-2000 laser Raman spectroscopy system with a He−Ne laser excited at 514 nm. The samples were also analyzed using TEM (JEOL 2000) at 200 keV. 2.3.4. Electrical Conductivity Measurements. Electrical conductivity measurements of the as-spun, pyrolyzed, and after-SPS fibers were carried out using a two-point multimeter. Fibrous mats of known weight and length were placed on a glass slide, and the ends of the fibers were soldered with silver paste to enable electrical contact. The cross-sectional area of the fibrous mats was calculated from the SEM images of the fracture surface of the CNF/PVA composites. Repeated
measurements were carried out to determine the average electrical conductivity of each sample. 2.3.5. Mechanical Property Tests. The mechanical properties of the CNFs were evaluated using Raman spectroscopy after four-point bend testing of the samples. Initially, the CNF mats were placed on a poly(methyl methacrylate) (PMMA) beam and covered with a thin layer of poly(vinyl alcohol) (PVA). The beam was then inserted into a four-point bending rig and deformed under various levels of strain. Subsequently, the samples were placed on a Raman microscope stage, and the surface strain was measured after three accumulations. It was assumed that the strain in the PVA resin was the same as in the PMMA substrate.
3. RESULTS AND DISCUSSION 3.1. Fiber Diameter Distributions. Figure 3 illustrates the statistical distributions of the diameter of the PAN-based fiber samples with 0, 1.0, and 8.0 wt % of GNPs prepared under different processing conditions, categorized as follows: as-spun, pyrolyzed, and after-SPS samples. With regard to the influence of the GNP concentration, it can be seen that the difference in the mean diameter becomes wide in totality, especially for the as-spun samples, even though it appears to be narrower at first 204
DOI: 10.1021/acsomega.6b00063 ACS Omega 2016, 1, 202−211
ACS Omega
Article
fiber diameter decreased first and then increased, irrespective of the processing conditions of the fiber. This can be the result of the uniformity of additive as well as the viscosity of the solutions. Consequently, the average diameter of the as-spun, pyrolyzed, and after-SPS samples resulted in finer fiber diameters of 1.05, 0.73, and 0.71 μm, respectively, at a GNP concentration of ∼1.0 wt %. The rotational speed and the working pressure of gyration were varied to study the effect on the average diameter of the fibers. Figure 5 shows a plot of the fiber diameter against
and then wider, when increasing the concentration of GNPs from 0 to 1.0 wt % and then to 8.0 wt %. This could be due to differences in the viscosity of the feed stock solution and the uniformity of the GNP distribution in the PAN solution. The GNPs dispersed well in the solutions when the concentration was low (1.0 wt %); thus, the differences in the diameter of these samples are narrower than the others. On increasing the content of GNPs, the solution became denser and some agglomeration of GNPs took place, thus worsening the dispersion. As a result, the diameter difference became larger again as the concentration of GNPs increased to 8.0 wt %. It can also be seen in Figure 3 that the largest statistical variation in the diameter for a particular GNP content is for the as-spun samples. After carbonization, the statistical difference in the diameter of the fibers became narrower, especially in the samples with GNPs of 1.0 and 8.0 wt % (Figure 3b,c). Furthermore, after SPS, the statistical difference in the diameter of the pyrolyzed samples further decreased, especially in the samples with 0 and 1.0 wt % GNPs (Figure 3a,b). The narrow diameter distribution indicates the uniformity in pyrolyzed and SPS samples, which is mainly attributed to the solvent and residue evaporation. Generally, a decrease in this trend is observed for fiber diameter of the as-spun, pyrolyzed, and afterSPS samples. For example, the average diameter of the pure PAN fibers changed from 3.21 to 2.44 μm from as-spun to pyrolyzed conditions. This change can be observed more clearly and intuitively from Figure 4.
Figure 5. Average fiber diameter for as-spun PAN with different rotational speeds and various working pressures.
rotational speed under different working pressures. A substantial reduction in the average fiber diameter was observed by increasing the rotational speed from 10 000 to 24 000 rpm at a working pressure of ≤2 × 10⁵ Pa. Thus, for the samples fabricated at 1 × 10⁵ Pa, increasing the rotational speed from 10 000 to 24 000 rpm reduced the fiber diameter from ∼3.6 to ∼2.6 μm. Similarly, for the samples fabricated at 2 × 10⁵ Pa, the fiber diameter decreased from ∼2.15 to ∼1.25 μm. However, with further increase in the rotational speed from 24 000 to 36 000 rpm, there was no significant further decrease, but actually a slight increase in the diameter of the fibers compared with the former. In comparison to the previous results for virgin polymer,13 there is a slight deviation of trend, but the overall tendency of diameter reduction with (initial) increase in the rotation speed is similar. As for the samples produced with a higher working pressure of 3 × 10⁵ Pa, the impact of rotational speed on diameter is not significant for the whole range of rotational speeds investigated (10 000−36 000 rpm). 3.2. Thermogravimetry of CNFs. Figure 6 displays the TGA curves and the differential TGA (DTGA) curves of the pure PAN fiber and PAN−GNP fiber with 8.0 wt % of GNPs, carried out in a nitrogen atmosphere. As observed from the TGA curve, there is a sharp decrease in weight in the temperature range of 80−100 °C because of loss of solvent and/or adsorbed water molecules in the fibers. Moreover, a large amount of weight loss in PAN−GNP fibers was observed at ∼250 °C, and the weight change of the sample in the temperature range of 270−300 °C was 16.1%, which was mainly due to the decomposition of the fibers.26 3.3. Morphologies of PAN-Based Fibers. The SEM micrographs of the as-spun, pyrolyzed, and after-SPS PANbased fibers with different concentrations of GNPs are shown in Figure 7. It can be seen that the as-spun PAN fibers are
Figure 4. Average fiber diameter of as-spun, pyrolyzed, and after-SPS samples with different concentrations of GNPs.
Figure 4 shows the difference in the fiber diameter between the as-spun, pyrolyzed, and after-SPS samples. It can be clearly seen that the average diameter of the PAN-based fibers decreased gradually after the carbonization and SPS processes, regardless of the GNP concentration. The average diameter of the fibers without GNPs decreased from 3.21 to 2.44 μm after the carbonization process at 900 °C, and then to 1.54 μm after SPS treatment at 2000 °C. Similarly, for the samples with 3.0 wt % GNPs, the average fiber diameter decreased from 2.79 to 2.12 μm after the carbonization process and then decreased to 1.38 μm after SPS treatment at 2000 °C. This result can be explained by the fact that shrinkage took place in the fibers during the high-temperature heat treatments because of decomposition reactions. Moreover, one can observe in Figure 4 that on increasing the concentration of GNPs, the average 205
DOI: 10.1021/acsomega.6b00063 ACS Omega 2016, 1, 202−211
ACS Omega
Article
nanometers on the surface of the fibers when the concentration of GNPs was increased to 1.0 wt % (Figure 7b). These particles are GNPs, which is verified and discussed in detail in section 3.4. On increasing the GNP concentration (to 8.0 wt %), the agglomeration of GNPs takes place and the surface of CNFs becomes rougher. Meanwhile, the diameter of the CNFs decreased initially and then increased (Figure 4). With regard to the after-SPS CNFs, it can be seen in Figure 7 that the SPS processing resulted in a rougher surface of the pure PAN-based fibers compared with those of pyrolyzed CNFs. The reason for this is that the graphitization takes place at a high temperature of 2000 °C during SPS.26 The amorphous structure of carbon transformed into graphite partly by heat treatment as well as by thermal decomposition at higher temperatures, which can be verified by the diffraction patterns of TEM (section 3.4.2). Meanwhile, the diameter of the pure PAN-based CNFs decreased, which is shown quantitatively in Figure 4. Furthermore, it can be seen in Figure 7 that the morphologies of the after-SPS CNFs with GNPs are significantly different compared with those of the pyrolyzed samples. This can be attributed to the relatively high temperature of the SPS process. This transformation of structure resulted in some movement of the nanoparticles on the surface of the fibers, and the surface appears different to that before the SPS treatment. Concerning the samples with a high concentration of 8.0 wt % of GNPs, it can be seen in Figure 7c that the aggregation of graphene still existed after SPS processing. Moreover, the content of graphene as well as the degree of graphitization could be improved by the heat treatment at such a high temperature.
Figure 6. TGA and DTGA curves of as-spun PAN fibers and PAN− GNP (8.0 wt %) nanofibers in a nitrogen atmosphere.
distributed randomly and the difference between their diameters is wide, as can be seen in Figure 3. Moreover, there are some beads within the fibers which were probably created by the mismatch of viscosity and processing parameters such as rotational speed and working pressures. As for pyrolyzed PAN-based CNFs, there are differences in the morphologies of the surfaces of fibers with different concentrations of GNPs. It can be observed in Figure 7 that the surface of the fibers is smooth when the concentration of GNPs is 0 wt % or low (0.2 wt %). However, on increasing the GNP concentration from 0 to 8.0 wt %, the surface of the CNF samples becomes increasingly rougher. Furthermore, there are many fine particles with a size on the order of hundreds of
Figure 7. SEM micrographs of PAN-based fibers made with various concentrations of GNPs (a) 0, (b) 1.0, and (c) 8.0 wt % and under different conditions (as-spun, pyrolyzed, and after-SPS). 206
DOI: 10.1021/acsomega.6b00063 ACS Omega 2016, 1, 202−211
ACS Omega
Article
Figure 8. Typical Raman spectra of pyrolyzed and after-SPS CNFs with different concentrations of GNPs (a) 0, (b) 1.0, and (c) 8.0 wt %. a.u. indicates arbitrary units.
Table 2. Intensity Ratio between the D-Band and G-Band (ID/IG), 2D-Band and G-Band (I2D/IG), as well as FWHM of the GBand of the CNFs with Various Concentrations of GNPs That Were Made under Different Conditions ID/IG sample (GNP in PAN solution) (wt %) 0 0.2 1.0 3.0 8.0
pyrolyzed 1.33 1.06 1.05 1.13 1.02
± ± ± ± ±
0.04 0.09 0.06 0.08 0.14
I2D/IG after-SPS 2.11 1.66 1.82 1.44 1.16
± ± ± ± ±
pyrolyzed
0.08 0.28 0.17 0.07 0.09
0.01 0.01 0.14 0.17 0.33
± ± ± ± ±
0.001 0.001 0.13 0.16 0.09
FWHMG after-SPS 0.74 0.94 0.76 0.69 0.86
± ± ± ± ±
0.11 0.12 0.15 0.09 0.03
pyrolyzed 60.75 64.30 58.01 57.33 60.70
± ± ± ± ±
2.05 2.40 3.98 4.31 1.92
after-SPS 68.30 65.87 68.37 64.21 59.43
± ± ± ± ±
1.73 4.13 1.72 2.34 4.13
(or not) of the band around 2680 cm−1, which is called the 2D band, and the intensity ratio between the D- and G-bands. First, in the case of pyrolyzed samples, there is no 2D-band in the pure PAN-based CNF sample (Figure 8a), whereas the 2Dband appeared in the spectra of the pyrolyzed samples that contained GNPs (Figure 8b,c). Combined with the G-band, the 2D-band is a Raman signature of graphitic sp2 materials, which indicates that pyrolyzed pure CNFs have a turbostratic structure. Moreover, on increasing the concentration of GNPs from 1.0 to 8.0 wt %, the 2D-band was detected more prominently and its intensity increased gradually. This is a
3.4. Analysis of Crystallite Structure of CNFs. 3.4.1. Raman Analysis on CNFs before and after SPS. Figure 8 illustrates the Raman spectra of the pyrolyzed and after-SPS CNFs with different concentrations of GNPs. Raman spectroscopy was performed at different locations on each sample to improve the sampling. It is evident that there are two main peaks (D- and G-bands) at about 1350 and 1583 cm−1 which are attributed to the existence of a disordered structure and stretching of the C−C bond, respectively,27 regardless of the GNP concentration and forming conditions. However, the differences in the Raman spectra are clearly due to the existence 207
DOI: 10.1021/acsomega.6b00063 ACS Omega 2016, 1, 202−211
ACS Omega
Article
Figure 9. Ratios of ID/IG (a), I2D/IG (b), and FWHMG (c) of CNF samples with various concentrations of GNPs made under different conditions (pyrolyzed and after-SPS).
higher temperature produced crystallization and ordering of the carbon in the fibers. Tuinstra and Koenig30 reported the ID/IG ratio to be inversely proportional to the crystallite size, which was later confirmed by Knight and White.31 The above results suggest that during the SPS heat treatment at 2000 °C, nanocrystals of graphene-nanoplatelets evolved from the amorphous structure. In fact, owing to the dependence of the ID/IG ratio on the excitation wavelength, Tuinstra and Koenig’s law becomes approximate and cannot be applied for a crystallite size below ∼10 nm.32 The smaller the volume of the GNPs, the larger the ID/IG ratio. For example, ID/IG of single-layer graphene is larger than that of double-layer and triple-layer graphene. Nevertheless, nanocrystals would grow resulting in a crystallite size larger than 10 nm in the SPS processing at a higher temperature. The effect of GNP content caused the ratio of ID/IG to drop when increasing the concentration of GNPs (even though the value for the sample with 2 wt % GNPs deviated to some extent). This deviation may have been caused by the inhomogeneity of GNP dispersion arising from the low concentration. On increasing the GNPs, the agglomeration of GNPs is stronger and the ratio of ID/IG decreased. Figure 9b shows that the value of the I2D/IG ratio increased after SPS treatment because after SPS the degree of graphitization of CNF samples is higher than that of the original samples (pyrolyzed). This ratio is widely used to determine the number of graphene layers in the structures.33 Actually, the I2D/IG ratio of single-layer graphene is larger than
result of the increase in the GNP concentration which is able to transform into nano-crystalline graphite. Similarly, for CNFs containing GNPs, it can be seen (Figure 8b,c) that the intensity of the 2D-band increased after SPS treatment in the Raman spectra compared to that of pyrolyzed samples. Furthermore, another aspect of SPS treatment of the samples is the change in the intensity ratio of D- to G-bands in the Raman spectra. The calculated results of the intensity ratio of D- to G-bands (ID/ IG), intensity ratio of 2D- to G-bands (I2D/IG), and full-width at half maximum (FWHM) of G-band of the different CNFs are compiled in Table 2. Generally, the higher the D-band intensity, the larger the number of defects, and from the double resonance theory, crystal defects scatter the excited electrons resulting in the wave vector condition, making the intensity of the D-band defectdependent.28,29 A narrow G-band is an indication of higher structural ordering and crystallinity.29 Therefore, the intensity ratio of the D- and G-bands and the shape of these bands can be used to determine the structural ordering in the CNFs. It is clearly seen from Table 2 that increasing the GNP concentration decreased the ID/IG ratio of the pyrolyzed samples, indicating greater graphitization in the samples. It is also true for the SPS-treated samples at 2000 °C. Figure 9 shows the dependence of GNP concentration and processing conditions on the FWHMG, ID/IG, and I2D/IG ratios. The ratio of ID/IG increased after SPS for all of the samples (different concentration of GNPs from 0 to 8.0 wt %). The 208
DOI: 10.1021/acsomega.6b00063 ACS Omega 2016, 1, 202−211
ACS Omega
Article
Figure 10. TEM images and diffraction patterns of CNFs from circled locations (a) and (d) after-SPS CNF without GNPs; (b,e) pyrolyzed CNFs with 8.0 wt % of GNPs; and (c,f) after-SPS CNFs with 8.0 wt % of GNPs.
determining the cross-sectional area of CNFs. The value of electrical conductivity of the as-spun PAN-based fibers increased from ∼4 to ∼46 × 103 S/m when increasing the GNP loading from 0 to 8.0 wt %. Similarly, for pyrolyzed CNFs, the value increased from ∼36 to ∼193 × 103 S/m as the concentration of GNPs increased from 0 to 8.0 wt %. Most strikingly, for a similar increase in GNPs, the increase in the electrical conductivity of the CNFs after SPS at 2000 °C was ∼179 to ∼272 × 103 S/m. The increase in the electrical conductivity of the pyrolyzed and SPS samples indicates that the degree of graphitization is higher in these samples than that of as-spun PAN fibers. This validates our Raman and TEM data showing nanocrystallites of graphites formed at higher temperature, which act as effective electron carriers. Figure 11c demonstrates this very clearly, where an LED lights up when connected in close-circuit using pyrolyzed samples, even before SPS. Thus, these samples have the potential to make conductivity bridges for electrical engineering applications. 3.6. Mechanical Properties of CNFs. The presence of 2D-band in the Raman spectra of the samples provides an opportunity to study the mechanical properties of the CNFs produced in this work because this band position in the spectra is very sensitive to deformation. Figure 12 shows the deformation-induced shifts in the 2D-band during four-point bend tests of the CNF composites (pyrolyzed CNFs). It can be seen that the band position of the CNFs decreased with tensile deformation; the higher the deformation, the higher the peak shift. The rate of Raman shift with respect to strain was obtained by fitting the data linearly in the strain range measured. This value was found to be −0.037 cm−1. It was reported that the rate of 2D Raman shift can be related to the modulus of the CNFs.35 There exists a universal calibration of −0.05 cm−1/GPa for the stress-induced shifts of the 2D-bands of CNFs pyrolyzed at 1000 °C. This calibration has been extensively used to obtain the modulus of graphene and carbon
that of multi-layer graphene. Similarly, there is an enhancement of I2D/IG ratio for the pyrolyzed CNFs because the GNPs added increased from 0 to 8.0 wt %. The reason for this can be the same as that for ID/IG, resulting from the agglomeration and growth of the GNPs, which can be verified by the SEM micrographs in Figure 7. Figure 9c shows that the FWHMG of after-SPS CNFs is higher than that of pyrolyzed samples for up to ∼8.0 wt % of GNPs. This can be due to the fact that the higher degree of graphitization after the high-temperature SPS processing produced a high intensity of G-band in the Raman spectra. 3.4.2. TEM Analysis on CNFs with GNPs. Figure 10 illustrates the key features of the microstructure of the CNFs determined from TEM images and diffraction patterns with different concentrations of GNPs (0 and 8.0 wt %) after carbonization as well as SPS treatments. It can be seen that graphene exists inside of the CNFs and can be more easily discerned at the edges of the fibers (Figure 10c). The selected area diffraction shows the crystallinity of the CNFs. From the diffraction patterns, the ordered graphitic layers present in the CNFs after carbonization treatment can be clearly seen. The diffraction planes in the fibers are identified as [002], [100], and [004] from the inner circle to the outer circle, respectively.34 Even though there is no graphene in the pure PAN-based fibers, diffraction patterns emerge after SPS at 2000 °C (Figure 10d), which indicates that nanocrystallites of graphite are formed at high temperatures. These results are consistent with the Raman results (section 3.4.1). 3.5. Electrical Properties of CNFs. Figure 11 shows that the electrical conductivity of CNFs made under different conditions is dependent on the concentration of GNPs. Increasing the GNP concentrations caused the conductivity of the CNFs to increase gradually, no matter how they were prepared (Figure 11a). Figure 11b shows a typical SEM image of the fracture surface after bending tests which was used for 209
DOI: 10.1021/acsomega.6b00063 ACS Omega 2016, 1, 202−211
ACS Omega
Article
Figure 11. Electrical conductivities of CNFs prepared in this work. (a) Conductivity dependent on the concentration of GNPs, (b) typical SEM micrographs of the fracture surface of CNFs/PVA composites, and (c) demonstration of performance in an activated electrical circuit of pyrolyzed CNFs.
4. CONCLUSIONS Carbon nanofibers were obtained by using pressurized gyration and high-temperature processing. The fiber diameter and distribution are controlled by the key forming parameters of rotating speed, working pressure, and loading concentration of the GNPs. The pyrolysis and the spark plasma temperature influenced the microstructures of the carbon nanofibers. A heattreatment temperature of 2000 °C in SPS produced nanofibers with a high degree of graphitization with properties superior to those of commercial carbon fibers. These nanofibers are useful in advanced engineering applications.
■
AUTHOR INFORMATION
Corresponding Author
*E-mail:
[email protected] Notes
Figure 12. Mechanical property relationship between Raman shifts versus the strain of CNFs made in this work obtained using four-point bend testing and Raman spectroscopy.
The authors declare no competing financial interest.
■
ACKNOWLEDGMENTS This work was possible because of EPSRC (UK) support for gyration research at University College London (Grants FP/ L023059/1 and EP/N 034228/1). X.W. thanks China Scholarship Council (CSC) for supporting his visit to University College London and financial support of the National Natural Science Foundation of China (Grant No.
36
nanotubes. Under this assumption, the calibration is also valid for the CNFs in our work, and the modulus of the CNFs is 74 GPa. This value is in agreement with those reported in the literature for cellulose-based carbon fibers37 but is substantially higher than that reported for carbon fibers derived from micron-sized cellulose fibers, which is 40 GPa.38 210
DOI: 10.1021/acsomega.6b00063 ACS Omega 2016, 1, 202−211
ACS Omega
Article
(22) Wang, L.; Zhang, J.; Jiang, W. Recent development in reactive synthesis of nanostructured bulk materials by spark plasma sintering. Int. J. Refrac. Met. Hard Mater. 2013, 39, 103−112. (23) Kali, R.; Mukhopadhyay, A. Spark plasma sintered/synthesized dense and nanostructured materials for solid-state Li-ion batteries: Overview and perspective. J. Power Sources 2014, 247, 920−931. (24) Porwal, H.; Grasso, S.; Mani, M. K.; Reece, M. J. In situ reduction of graphene oxide nanoplatelet during spark plasma sintering of a silica matrix composite. J. Eur. Ceram. Soc. 2014, 34, 3357−3364. (25) Porwal, H.; Tatarko, P.; Grasso, S.; Khaliq, J.; Dlouhý, I.; Reece, M. J. Graphene reinforced alumina nano-composites. Carbon 2013, 64, 359−369. (26) Rahaman, M. S. A.; Ismail, A. F.; Mustafa, A. A review of heat treatment on polyacrylonitrile fiber. Polym. Degrad. Stab. 2007, 92, 1421−1432. (27) Yan, Z.; Barron, A. R. Characterization of Graphene by Raman Spectroscopy. http://cnx.org/content/m34667/1.2/ (accessed July 14, 2016). (28) Dillon, A. C.; Yudasaka, M.; Dresselhaus, M. S. Employing Raman spectroscopy to qualitatively evaluate the purity of carbon single-wall nanotube materials. J. Nanosci. Nanotechnol. 2004, 4, 691− 703. (29) Schönfelder, R.; Avilés, F.; Knupfer, M.; Azamar-Barrios, J. A.; González-Chi, P. I.; Rümmeli, M. H. Influence of architecture on the Raman spectra of acid-treated carbon nanostructures. J. Exp. Nanosci. 2014, 9, 931−941. (30) Tuinstra, F.; Koenig, J. L. Raman spectrum of graphite. J. Chem. Phys. 1970, 53, 1126−1130. (31) Knight, D. S.; White, W. B. Characterization of diamond films by Raman spectroscopy. J. Mater. Res. 1989, 4, 385−393. (32) Mallet-Ladeira, P.; Puech, P.; Toulouse, C.; Cazayous, M.; RatelRamond, N.; Weisbecker, P.; Vignoles, G. L.; Monthioux, M. A Raman study to obtain crystallite size of carbon materials: A better alternative to the Tuinstra−Koenig law. Carbon 2014, 80, 629−639. (33) Deng, L.; Lewandowska, A. E.; Young, R. J.; Zhang, G.; Sun, R.; Eichhorn, S. J. Catalytic graphitization of electrospun cellulose nanofibres using silica nanoparticles. React. Funct. Polym. 2014, 85, 235−238. (34) Fan, Y.-Y.; Li, F.; Cheng, H.-M.; Su, G.; Yu, Y.-D.; Shen, Z.-H. Preparation, morphology and microstructure of diameter-controllable vapor grown carbon nanofibres. J. Mater. Res. 1998, 13, 2342−2346. (35) Cooper, C. A.; Young, R. J.; Halsall, M. Investigation into the deformation of carbon nanotubes and their composites through the use of Raman spectroscopy. Composites, Part A 2001, 32, 401−411. (36) Deng, L.; Eichhorn, S. J.; Kao, C.-C.; Young, R. J. The effective Young’s modulus of carbon nanotubes in composites. ACS Appl. Mater. Interfaces 2011, 3, 433−440. (37) Peng, S.; Shao, H.; Hu, X. Lyocell fibers as the precursor of carbon fibers. J. Appl. Polym. Sci. 2003, 90, 1941−1947. (38) Kong, K.; Deng, L.; Kinloch, I. A.; Young, R. J.; Eichhorn, S. J. Production of carbon fibres from a pyrolysed and graphitised liquid crystalline cellulose fibre precursor. J. Mater. Sci. 2012, 47, 5402−5410.
51372232). Data supporting this study are provided in the paper itself.
■
REFERENCES
(1) Rodriguez, N. M. A review of catalytically grown carbon nanofibers. J. Mater. Res. 1993, 8, 3233−3250. (2) Dai, H.; Wong, E. W.; Lu, Y. Z.; Fan, S.; Lieber, C. M. Synthesis and characterization of carbide nanorods. Nature 1995, 375, 769−772. (3) Matsumoto, M.; Hashimoto, T.; Uchiyama, Y.; Murata, K.; Goto, S. Use of modified carbon whiskers as an electrode in coulometric cells. Carbon 1993, 31, 1003−1004. (4) Pham-Huu, C.; Keller, N.; Ehret, G.; Charbonniere, L. J.; Ziessel, R.; Ledoux, M. J. Carbon nanofiber supported palladium catalyst for liquid-phase reactions: An active and selective catalyst for hydrogenation of cinnamaldehyde into hydrocinnamaldehyde. J. Mol. Catal. A: Chem. 2001, 170, 155−163. (5) Ramos, M. E.; Bonelli, P. R.; Cukierman, A. L.; Carrott, M. M. L. R.; Carrott, P. J. M. Adsorption of volatile organic compounds onto activated carbon cloths derived from a novel regenerated cellulosic precursor. J. Hazard. Mater. 2010, 177, 175−182. (6) Manickam, S. S.; Karra, U.; Huang, L.; Bui, N.-N.; Li, B.; McCutcheon, J. R. Activated carbon nanofiber anodes for microbial fuel cells. Carbon 2013, 53, 19−28. (7) Kim, B.-H.; Yang, K. S.; Ferraris, J. P. Highly conductive, mesoporous carbon nanofiber web as electrode material for highperformance supercapacitors. Electrochim. Acta 2012, 75, 325−331. (8) Kim, C.; Yang, K. S. Electrochemical properties of carbon nanofiber web as an electrode for supercapacitor prepared by electrospinning. Appl. Phys. Lett. 2003, 83, 1216−1218. (9) Liu, C.-K.; Lai, K.; Liu, W.; Yao, M.; Sun, R.-J. Preparation of carbon nanofibres through electrospinning and thermal treatment. Polym. Int. 2009, 58, 1341−1349. (10) Khan, W. S.; Asmatulu, R.; Rodriguez, V.; Ceylan, M. Enhancing thermal and ionic conductivities of electrospun PAN and PMMA nanofibers by graphene nanoflake additions for battery-separator applications. Int. J. Energy Res. 2014, 38, 2044−2051. (11) Jana, S.; Cooper, A.; Ohuchi, F.; Zhang, M. Uniaxially aligned nanofibrous cylinders by electrospinning. ACS Appl. Mater. Interfaces 2012, 4, 4817−4824. (12) Canbolat, M. F.; Gera, N.; Tang, C.; Monian, B.; Rao, B. M.; Pourdeyhimi, B.; Khan, S. A. Preservation of cell viability and protein conformation on immobilization within nanofibres via electrospinning functionalized yeast. ACS Appl. Mater. Inter. 2013, 5, 9349−9354. (13) Mahalingam, S.; Edirisinghe, M. Forming of Polymer Nanofibers by a Pressurised Gyration Process. Macromol. Rapid Commun. 2013, 34, 1134−1139. (14) Raimi-Abraham, B. T.; Mahalingam, S.; Edirisinghe, M.; Craig, D. Q. M. Generation of poly(N-vinylpyrrolidone) nanofibers using pressurised gyration. Mater. Sci. Eng., C 2014, 39, 168−176. (15) Novoselov, K. S.; Geim, A. K.; Morozov, S. V.; Jiang, D.; Zhang, Y.; Dubonos, S. V. Electric field effect in atomically thin carbon films. Science 2004, 306, 666−669. (16) Stankovich, S.; Dikin, D. A.; Dommett, G. H. B.; Kohlhaas, K. M.; Zimney, E. J.; Stach, E. A.; Piner, R. D.; Nguyen, S. T.; Ruoff, R. S. Graphene-based composite materials. Nature 2006, 442, 282−286. (17) Wu, Q.; Xu, Y.; Yao, Z.; Liu, A.; Shi, G. Supercapacitors Based on Flexible Graphene/Polyaniline Nanofiber Composite Films. ACS Nano 2010, 4, 1963−1970. (18) Kim, H.; Abdala, A. A.; Macosko, C. W. Graphene/Polymer Nanocomposites. Macromolecules 2010, 43, 6515−6530. (19) Porwal, H.; Grasso, S.; Reece, M. J. Review of Graphene− Ceramic Matrix Composites. Adv. Appl. Ceram. 2013, 112, 443−454. (20) Munir, Z. A.; Anselmi-Tamburini, U.; Ohyanagi, M. The effect of electric field and pressure on the synthesis and consolidation of materials: A review of the spark plasma sintering method. J. Mater. Sci. 2006, 41, 763−777. (21) Hungria, T.; Galy, J.; Castro, A. Spark Plasma Sintering as a Useful Technique to the Nanostructuration of Piezo-Ferroelectric Materials. Adv. Eng. Mater. 2009, 11, 615−631. 211
DOI: 10.1021/acsomega.6b00063 ACS Omega 2016, 1, 202−211