Apr 22, 2002 - electron bunches using the electro-optical method is described. In this scheme .... where Io and I are the intensities of the laser beam incident.
PHYSICAL REVIEW SPECIAL TOPICS - ACCELERATORS AND BEAMS, VOLUME 5, 042801 (2002)
Novel single shot scheme to measure submillimeter electron bunch lengths using electro-optic technique T. Srinivasan-Rao, M. Amin, V. Castillo, D. M. Lazarus, D. Nikas, C. Ozben, Y. K. Semertzidis, A. Stillman, and T. Tsang Brookhaven National Laboratory, Upton, New York 11973
L. Kowalski Montclair State University, Upper Montclair, New Jersey 07043 (Received 1 December 2001; published 22 April 2002) A novel, single shot, nondestructive scheme to measure the bunch length of submillimeter relativistic electron bunches using the electro-optical method is described. In this scheme, the birefringence induced by the electric field of the electrons converts the temporal characteristics of the bunch to a spatial intensity distribution of an optical pulse. Electric field characteristics, induced birefringence, and retardation are calculated for a few typical electron beam parameters and criteria limiting the resolution are established. DOI: 10.1103/PhysRevSTAB.5.042801
PACS numbers: 41.85.Ew, 07.60.-j, 07.77.Ka
I. INTRODUCTION
II. MEASUREMENT OF SUBPICOSECOND ELECTRON BUNCH LENGTH
In the past decade, the bunch lengths of electrons in accelerators have decreased dramatically to a few millimeters (⬃10 ps pulse duration) [1,2], and are becoming still shorter. The measurement of bunch lengths and their longitudinal distributions have been a topic of research in a number of institutions [3–8]. One of the techniques adopted successfully in the mm regime is to use the electric field induced by the passage of relativistic electrons to change the optical characteristics of a birefringent crystal [5–8]. Well-established electro-optic (EO) techniques can then be used to measure the temporal characteristics of the electron bunch. Although the inherent response of the crystal is in the femtosecond regime [9], the resolution in direct, single shot measurements of bunch lengths so far has been limited to 70 ps, by the bandwidth of the detection equipment [10]. Use of a streak camera can improve this resolution to a few picoseconds. A number of schemes to measure subpicosecond electron bunches have been proposed so far. These include [6,11] characterizing the frequency shift of a laser spectrum by the electron bunch, measuring the spectral content of a frequency chirped laser pulse modulated by the electron beam, performing autocorrelation measurements, and using the frequency resolved optical gating technique to determine both the frequency and time distribution of the laser beam transmitted through a birefringent crystal. In this paper we propose a novel, nondestructive, single shot approach that would convert the density profile of the electron bunch in time to the spatial information of the laser intensity and improve the resolution to tens of femtoseconds. The criteria to obtain subpicosecond resolution are also derived.
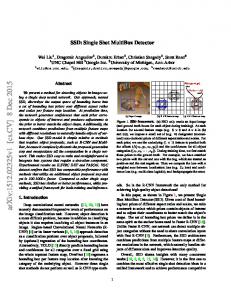
The conceptual experimental arrangement is shown in Fig. 1. A short, polarized laser pulse, focused by a cylindrical lens to form a line focus, propagates along the x axis. A thin birefringent crystal is positioned at the waist of the laser beam so that the laser beam passes through the crystal. The relativistic electron bunch propagates simultaneously above the crystal, but not intercepted by it, along the y axis, parallel to the length of the crystal, and at a distance r from the laser beam. The laser intensity transmitted by the crystal is passed through a crossed analyzer and detected by a linear detector array. For relativistic electrons, the induced electric field radiates from the electrons, normal to the direction of propagation. Hence, only the section of the crystal directly below the electron bunch will experience a time dependent change in the refractive index. Thus, the line focused, short laser pulse arriving at the crystal simultaneously undergoes a position dependent phase retardation that is proportional to the charge distribution of the electron beam directly above it. When viewed through the crossed analyzer and detected by the linear array, the spatial distribution of the transmitted laser energy is thus a measure of the temporal distribution of the charge in the electron bunch.
1098-4402 兾02兾5(4)兾042801(7)$20.00
III. THEORY Let us consider a focused electron beam of charge density s, and bunch length d. Let this relativistic charged particle beam move along the y axis, parallel to the length of a birefringent crystal and above the crystal, as shown in Fig. 2. © 2002 The American Physical Society
042801-1
T. SRINIVASAN-RAO et al.
PRST-AB 5
042801 (2002) Electron Beam
Laser Beam
Analyzer
Polarizer
Electro-Optic Crystal
FIG. 1. (Color) Simplified schematic of the experimental arrangement to measure subpicosecond electron bunches. The red arrow denotes the laser beam traveling through the crystal and crossed polarizers along the x axis to the CCD. The x dimension of the laser beam is determined by its pulse duration while the y and z dimensions are determined by the cylindrical focusing element used. The yellow arrow denotes the electron beam traveling along the y axis above the crystal.
The electric field in the crystal at a distance r from the electron beam, due to the charge sdy can be written as d E 苷 共g兾4p´0 兲sdy兾´r 2 r .
(1)
´ is the dielectric constant of the crystal in the z direction and g is the relativistic Lorentz factor. The field falls off rapidly along the y axis, beyond the extent of the bunch length, due to Lorentz contraction. Hence the major components of the field can be written as dE共x, t兲 苷 共g兾4p´0 兲sdy兾´r 2 共x៣ ? ៣r 兲 ,
(2)
dE共z, t兲 苷 共g兾4p´0 兲sdy兾´r 2 共z៣ ? r៣ 兲 .
(3)
Three sets of electron beam parameters are listed in Table I. Numerical calculations for the corresponding field distributions Ez (Figs. 3a–5a) and Ex (Figs. 3b–5b) at 1 mm from the beam are shown below. When this time dependent electric field is applied to an anisotropic crystal, the refractive index ellipsoid of the crystal undergoes a time dependent modulation. The equation of the index ellipsoid for an anisotropic crystal in the presence of an external electric field is given by [12]
Z
Crystal Y X
FIG. 2. (Color) Schematic of the focused electron beam (orange) traveling above the crystal and inducing a transient electric field in the crystal.
042801-2
x2
µ
µ ∂ ∂ 1 2 1 1 y 1 r E 1 r E 1j j 2j j 1 n12 n22 µ ∂ 2 1 1 r3j Ej 1 2yz共r4j Ej 兲 1 z n32 2xz共r5j Ej 兲 2 2xy共r6j Ej 兲 苷 1 ,
(4)
where x, y, and z are coordinates parallel to the principal dielectric axes of the crystal when no field is present. n1 , n2 , and n3 are the indices of refraction along x, y, and z, respectively, rij are the elements of the electro-optic tensor, and Ej ( j 苷 1, 2, 3) are the components of the applied field along x, y, and z. rij Ej 苷 ri1 E1 1 ri2 E2 1 ri3 E3 .
(5)
As can be seen from Eq. (4), the principal axes of the index ellipsoid in the presence of the electric field are in general not aligned with the axes of the field-free crystal, but rotated by an angle f. To obtain the velocity of a laser beam through the crystal in the presence of this electric field, the principal axis (Xi ) and the refractive indices (Ni ) of the modulated crystal have to be calculated. When a laser beam travels through the crystal, a retardation is introduced between the two orthogonal components (resolved along the new principal axes) of the laser beam due to the difference in the principal indices of refraction. This retardation can be written as 2p Z L d苷 共Nj 2 Ni 兲 dxk , (6) l 0 where xk is the direction of propagation of the laser beam while L is the thickness of the crystal through which the laser beam propagates. When the crystal is placed between crossed polarizers, the intensity modulation in the laser beam traversing the crystal, observed after the analyzer, can be written as 042801-2
NOVEL SINGLE SHOT SCHEME TO MEASURE …
PRST-AB 5
042801 (2002)
TABLE I. Three sets of electron beam parameters for the electric field simulations. Bunch duration/length ps兾mm
Radius mm
Charge nC
Energy MeV
Transverse profile
Longitudinal profile
3兾900
50
1
45
2兾600
50
3
9000
0.08兾24
50
3
9000
Gaussian Line charge, Gaussian in y Line charge, Gaussian in y
Gaussian Line charge, Gaussian in y Line charge, Gaussian in y
I 苷 Io sin2 共2u 1 2f兲 sin2
d , 2
(7)
where Io and I are the intensities of the laser beam incident on the crystal and exiting the analyzer, respectively, u is the angle made by the E vector of the laser beam with the
Shown in Figs. 3a,3b
4a,4b
5a,5b
y-z plane, and f specifies the field dependent orientation of new principal axes with respect to the old ones. In subsequent sections, lithium niobate (LiNbO3 ), a trigonal crystal with large electro-optic coefficients, is used as an example for calculating the rotation of the principal axes and the retardation introduced in a laser beam due to a relativistic charge bunch. The equation for the index
(b) (a)
FIG. 3. (Color) (a) Distribution of Ez for an electron beam of 3 ps bunch length, 45 MeV energy, and 1 nC charge with Gaussian distributions truncated at 1兾e in both transverse and longitudinal dimensions. (b) Distribution of Ex for an electron beam of 3 ps bunch length, 45 MeV energy, and 1 nC charge with Gaussian distributions truncated at 1兾e in both transverse and longitudinal dimensions.
(a) (b)
FIG. 4. (Color) (a) Distribution of Ez for an electron beam of 2 ps bunch length, 9000 MeV energy, and 3 nC charge with line charge; Gaussian distribution in y, truncated at 1兾e. (b) Distribution of Ex for an electron beam of 2 ps bunch length, 9000 MeV energy, and 3 nC charge with line charge; Gaussian distribution in y truncated at 1兾e.
042801-3
042801-3
T. SRINIVASAN-RAO et al.
PRST-AB 5
042801 (2002)
(b)
(a)
FIG. 5. (Color) (a) Distribution of Ez for an electron beam of 80 fs bunch length, 9000 MeV energy, and 3 nC charge with line charge; Gaussian distribution in y truncated at 1兾e. (b) Distribution of Ex for an electron beam of 80 fs bunch length, 9000 MeV energy, and 3 nC charge with line charge; Gaussian distribution in y truncated at 1兾e.
TABLE II. Angle of rotation of principal axes of the crystal f, induced by the electric field for three possible propagation directions of the optical and electron beams. Direction of propagation of charge bunch x y z
Direction of propagation of laser light x f⬃
1 2
36.4310212 Ey tan21 共 20.01613.4310212 Ey 221.1310 212 E 兲 z
f⬃
f⬃0
1 2
36.4310212 E
y tan21 共 20.01613.4310212 Ey 兲
f⬃ f⬃
y
z
f⬃0
f⬃0 f ⬃ 6p兾4
1 36.4310212 Ex 21 2 tan 共 20.016221.1310212 Ez 兲 1 36.4310212 Ex 21 2 tan 共 20.01623.4310212 Ey 兲
f⬃
1 2
E
tan21 共 Exy 兲
TABLE III. Total retardation d experienced by the laser beam for three possible propagation directions of the optical and electron beams. It is assumed that the optic axis is along the z direction, and the electric field along the direction of propagation is zero for charge bunches with g ¿ 1. Direction of propagation of charge bunch x
y
z
042801-4
Direction of propagation of laser light x 6 d 苷 2共1.19 3 10 RL兲L 2 共0.0014兲 0 Ez dx RL 1 共0.0003兲 0 Ey dx RL 2 共2.97 3 10212 兲 0 Ey2 dx RL 1 共1.95 3 10213 兲 0 Ez2 dx RL 2 共1.67 3 10214 兲 0 Ey Ez dx 1 · · · 6 d 苷 2共1.19 3 10 RL兲L 2 共0.0014兲 0 Ez dx RL 1 共1.95 3 10213 兲 0 Ez2 dx RL 2 共2.51 3 10223 兲 0 Ez3 dx 1 · · · d 苷 2共1.19 3 106 兲L RL 1 共0.0003兲 0 Ey dx RL 2 共2.97 3 10212 兲 0 Ey2 dx RL 2 共5.71 3 10222 兲 0 Ey3 dx 1 · · ·
y 6 d 苷 2共1.19 3 10 RL兲L 2 共0.0014兲 0 Ez dy RL 1 共0.0003兲 0 Ey dy RL 1 共1.95 3 10213 兲 0 Ez2 dy RL 2 共1.67 3 10214 兲 0 Ey Ez dy RL 2 共3.69 3 10215 兲 0 Ey2 dy 1 · · · 6 d 苷 2共1.19 3 10 RL兲L 2 共0.0014兲 0 Ez dy RL 1 共2.96 3 10212 兲 0 Ex2 dy RL 1 共1.95 3 10213 兲 0 Ez2 dy 1 · · · d 苷 2共1.19 3 106 兲L RL 2 共0.0014兲 0 Ez dy RL 1 共0.0003兲 0 Ey dy RL 2 共2.96 3 10212 兲 0 Ex2 dy RL 2 共5.92 3 10212 兲 0 Ey Ex dy RL 2 共3.69 3 10215 兲 0 Ey2 dy 1 · · ·
z RL
d 苷 2共0.0011兲 0 Ey dzR L 1 共6.69 3 10214 兲 0 Ey Ez dz RL 2 共3.51 3 10224 兲 0 Ey Ez2 dz RL 2 共9.13 3 10225 兲 0 Ey3 dz 1 · · · RL d 苷 2共0.0005兲 0 Ex dzR L 1 共3.34 3 10214 兲 0 Ex Ez dz RL 2 共1.76 3 10224 兲 0 Ex Ez2 dz RL 2 共1.14 3R10225 兲 0 Ex3 dz 1 · · · L d 苷 2共0.0005兲 0 Ex dz RL Ey2 2 共0.0007兲 0 Ex dz RL 2 共1.14 3 10225 兲 0 Ex3 dz 1 · · ·
042801-4
PRST-AB 5
NOVEL SINGLE SHOT SCHEME TO MEASURE …
042801 (2002)
ellipsoid for LiNbO3 (plane of reflection symmetry is perpendicular to x) in the presence of the applied field is as follows: ∂ µ 2 1 x 2 r22 Ey 1 r13 Ez 1 no2 ∂ µ ∂ µ 1 1 y 2 2 1 r22 Ey 1 r13 Ez 1 z 2 2 1 r33 Ez 1 no ne 2yz共r42 Ey 兲 1 2xz共r42 Ex 兲 2 2xy共r22 Ey 兲 苷 1 , (8) where x, y, and z are parallel to the principal axes of the crystal when no field is present. no and ne are the indices of refraction along and orthogonal to the optic axis, respectively. z is the optic axis. Ex , Ey , and Ez are the components of the applied field along x, y, and z. Tables II and III show the rotation of the index ellipsoid and the total retardation (expanded as a double Taylor series) for the three different directions of propagation of the laser light and the three possible directions of propagation of the electron bunch. The EO coefficients rij are of the order of 10212 m兾V. Hence for electric field magnitudes ,108 V兾m, the integrals linear in the electric field provide a good approximation to the series. From Table II we see that, in four out of the nine possible cases, the rotation of the index ellipsoid is a constant. For these four cases, the time dependent modulation arises only from d and not from f. If the laser beam propagates along the x axis while the electron bunch moves along the y axis, the EO integrals for retardation are dependent only on Ez , whereas in the other three cases the EO integrals contain mixed terms. The absence of rotation and cross terms makes this orientation ideal for measuring the temporal characteristics of the electron bunch. In addition, the large coefficient associated with the integral results in larger retardation for a given electric field. It should be noted, however, that there is a large static, time independent retardation. In orientations where the retardation is dependent on two components of the applied field, the trajectory of the charge bunch relative to the laser beam determines the dominant terms. Thus the crystal, its dimensions, and orientation have to be optimized to maximize the signal and minimize noise at the detector.
FIG. 6. (Color) The z component of the electric field as a function of y for electron bunches of 1 nC charge with constant linear charge density, bunch length of 3 ps (0.9 mm) and energies 4.5 (brown line), 45 (green line), 450 (blue line), and 4500 MeV (red line) at r 苷 1 mm. As g increases, the y extent of the electric field approaches the electron bunch length shown as the solid black bar.
tron beam, resulting in a more accurate measurement of longitudinal charge distribution. Similar plots for identical electron beam parameters, but at a distance of 100 mm from the laser beam are shown in Fig. 7. The comparison between Figs. 6 and 7 indicates that for a given charge and bunch length, lower energy electron beams need to be much closer to the laser beam. Hence, for low energy electron beams, lower emittance and smaller spot size are necessary. The length of the crystal that is illuminated by the laser beam must clearly be longer than the electron bunch length. However, the optimum length is determined by the available optical energy, sensitivity of the detection system, and
IV. OPERATIONAL CONSIDERATIONS As the energy of the electron beam increases, so does the electric field associated with it. For electron bunches of 1 nC charge with constant linear charge density, a bunch length of 3 ps (0.9 mm), and energy values of 4.5, 45, 450, and 4500 MeV, the z component of the electric field as a function of y in the crystal center (x 苷 0) at a distance of 1 mm from the laser beam is shown in Fig. 6. As can be seen from Fig. 6, as g ! `, Ey ! 0 and the field is confined to the region directly below the elec042801-5
FIG. 7. (Color) The z component of the electric field as a function of y for electron bunches of 1 nC charge with constant linear charge density, bunch length of 3 ps (0.9 mm) and energies 4.5 (brown line), 45 (green line), 450 (blue line), and 4500 MeV (red line) at r 苷 0.1 mm. The electron bunch length is shown as the solid black bar.
042801-5
PRST-AB 5
T. SRINIVASAN-RAO et al.
temporal jitter between the electron and laser beam. Since the temporal characteristics of the electron beam are converted into spatial information of the laser beam, timing jitter between the electron and laser beams is seen as the variation in the spatial location of the laser beam modulated by the electron beam. Hence, the line focus must be long enough to accommodate this variation. However, since the total optical energy is distributed over this length, the energy density of this beam available for modulation is decreased proportionately. Using a typical diode array of 1024 elements, crystal length of 1 cm and laser energy of ⬃100 pJ in a 1 cm line focus, jitter up to 30 ps can be tolerated as well as measured with this scheme. Mode locked lasers that are phase locked to external rf clocks with jitter ,2 ps are commercially available. If two pulses are selected from this mode locked pulse train using a Pockell’s cell, and one is used to generate the electron bunch while the other is used for bunch length measurement, the overall jitter between the electron and the laser pulse can be kept to well under the 30 ps requirement. A number of laser-electron bunch interaction experiments have been successfully completed [13] indicating that such synchronization is indeed feasible. The choice of the crystal thickness is dictated by the following factors. (1) The electric field induced by the electron bunch: As shown in Table II, the total retardation experienced by the laser beam is directly proportional to the electric field and the effective length of the crystal. Hence, the larger the field, the smaller is the thickness required. As shown in Figs. 3a and 3b, the range of x values over which Ez remains constant and Ex is ⬃0 is very narrow. The crystal thickness has to be comparable to this range as well. Crystals with thickness ⬃100 mm are commercially available. Thinner films have also been successfully grown [14] to meet this requirement. (2) Bunch length and resolution: The thickness of the crystal needs to be significantly smaller than the bunch length. One of the factors limiting the resolution is the distance traveled by the electron bunch during the transit time of the laser beam through the crystal. The transit time of the laser beam through a birefringent crystal of 30 mm thickness is 200 fs for a refractive index of 2. The relativistic electron bunch traverses 60 mm during this time. If the electron bunch length is 30 mm, this gives rise to a large uncertainty in the bunch length measurement. To reduce the uncertainty due to this movement and improve the resolution for ultrashort electron pulse durations, either this effect needs to be deconvoluted from the observed modulation or a thinner crystal has to be used. (3) Mechanical stability: As the ratio between the length and thickness of the crystal increases, mechanical integrity comes into question. Issues such as surface flatness and quality, parallelism between the two faces, and strain-induced birefringence need to be evaluated prior to measurement. Birefringent crystals with thickness as small 042801-6
042801 (2002)
as 30 mm are available and would be suitable for these measurements. (4) Radiation damage: Since the crystal is exposed to both the relativistic particles and x-ray beams, the radiation hardness of the crystal is another important consideration. Radiation damage studies [15] on lithium niobate crystals indicate that exposure up to 50 Mrad of gamma radiation does not affect the transfer characteristics and hence the optical properties of the modulator. In our experiments, when the 50 MeV, 1 nC electron bunch was deliberately steered into the birefringent crystal, we observed opacity of the crystal with opacity decay time of a few hours, after which the optical properties were restored to original values. Since in this scheme, the electron beams are not intercepted by the crystal, but typically interact through the electric field, we do not anticipate any damage. Indeed, except for the opacity mentioned before, no damage was observed to the lithium niobate crystal in the presence of the relativistic electron beam in more than three years of studies. Optical parameters: Since the electric field in the crystal must be constant across the transverse dimension, h of the laser beam, a tight focus (h ø r) in the z direction is required. This tight focusing also increases the number of photons/pixel of the detector. A well-defined spatial profile of the laser beam along the y axis is essential. To preserve the fidelity of the temporal characteristics of the electron bunch, the pulse duration of the laser beam must be a small fraction of the electron pulse duration. For an electron beam traveling along the y axis and the laser light along the x axis, f 苷 0. If the polarization of the E vector of the incident beam is set at 45± to the field-free optic axis (u 苷 45), Eq. (7) can then be rewritten as I共t兲 苷 I0 兵h 1 sin2 关db 1 d共t兲兴其 ,
(9)
where h is the intensity extinction coefficient of the optical arrangement (fraction of the transmitted intensity in the absence of the crystal), db is the static retardation, and d共t兲 is the time dependent component of the retardation. Figure 8 represents the dependence of the transmitted intensity as a function of the total retardation. In general, a wave plate is placed after the crystal so that the total static retardation is ⬃p兾4 where the operating region has the maximum linear dependence on the field. However, the time independent component arriving at the detector is nearly half the input intensity, which needs to be suppressed in order to measure the time dependent component. This requirement necessitates a very low noise laser as well as the capability to ac couple the signal. Choosing the operating regime in low db reduces the magnitude of the time independent component. However, the dependence of the signal on the field is sublinear, resulting in a smaller signal, but a higher modulation. 042801-6
NOVEL SINGLE SHOT SCHEME TO MEASURE …
PRST-AB 5
in part by the U.S. Department of Energy Contract No. DE-AC02-98CH10886.
1.2
Transmitted Signal Intensity (arb. units)
042801 (2002)
1 0.8 0.6 0.4 0.2 0 -40
-20
0
20
40
60
80
100
T(Deg)
FIG. 8. (Color) Dependence of the transmitted signal as a function of the total retardation.
V. CONCLUSION The analysis shows that the pulse duration of subpicosecond electron bunches can be determined using this novel, single shot, nondestructive, electro-optic technique that is relatively insensitive to the timing jitter between the electron and the laser beam. Choices of the birefringent crystal, laser beam, and optical arrangement are determined critically by the electron beam parameters. As the electron bunch length gets shorter, the induced electric field would contain high frequency components in the terahertz range. At these frequencies, the refractive indices are modified not only by the electronic contribution included in this analysis, but also by ionic contributions through optical phonon interaction. Hence more detailed, crystal specific, analysis is required for EO modulation by electrons with bunch lengths shorter than 30 mm. ACKNOWLEDGEMENTS The authors would like to express their appreciation of the strong support they received from Dr. H. Gordon, Dr. T. Kirk, Dr. M. Murtagh, Dr. P. Paul, and Dr. V. Radeka and cooperation from the members of the BNL Accelerator Test Facility. They also would like to acknowledge the expert technical assistance provided by R. Burns and J. Walsh. This work was supported
042801-7
[1] M. Uesaka et al., Phys. Rev. E 50, 3068 (1994). [2] S. Trotz, W. J. Brown, B. G. Danly, J.-P. Hogge, M. Khusid, K. E. Kreischer, M. Shapiro, and R. J. Temkin, in Proceedings of the Advanced Accelerator Concepts, edited by S. Chattopadhyay, J. McCullough, and P. Dahl (AIP Press, New York, 1997), p. 717. [3] M. Uesaka, T. Ueda, T. Watanabe, M. Kando, K. Nakajima, H. Kotaki, and A. Ogata, in Proceedings of the Advanced Accelerator Concepts (Ref. [2]), p. 687. [4] Y. Liu, D. B. Kline, X. J. Wang, M. Babzien, J. M. Fang, and V. Yakimenko, in Proceedings of the Advanced Accelerator Concepts (Ref. [2]), p. 664. [5] Y. K. Semertzidisy, V. Castillo, R. C. Larsen, D. M. Lazarus, B. Magurnoz, T. Srinivasan-Rao, T. Tsang, V. Usack, L. Kowalski, and D. E. Kraus, in Proceedings of 1999 Particle Accelerator Conference, New York, 1999, edited by A. Lucio and W. Mackay (IEEE, Piscataway, NJ, 1999), p. 490. [6] S. C. Hutchins, CERN, Geneva CTF Tech Note No. 2000-06, 2000. [7] M. J. Fitch, A. C. Melissinos, P. L. Colestock, J. P. Carneiro, H. T. Edwards, and W. H. Hartung, Phys. Rev. Lett. 87, 34 801 (2001). [8] X. Yan, A. M. MacLeod, W. A. Gillespie, G. M. H. Knippels, D. Oepts, and A. F. G. van der Meer, Phys. Rev. Lett. 85, 3404 (2000). [9] Q. Wu and X.-C. Zhang, Appl. Phys. Lett. 71, 1285 (1997). [10] Y. K. Semertzidis, V. Castillo, L. Kowalski, D. E. Kraus, R. Larsen, D. M. Lazarus, B. Magurno, D. Nikas, C. Ozben, T. Srinivasan-Rao, and T. Tsang, Nucl. Instrum. Methods Phys. Res., Sect. A 452/453, 396 (2000). [11] T. Tsang, V. Castillo, R. Larsen, D. M. Lazarus, D. Nikas, C. Ozben, Y. K. Semertzidis, T. Srinivasan-Rao, and L. Kowalski, J. Appl. Phys. 89, 4921 (2001). [12] A. Yariv, Quantum Electronics (Wiley, New York, 1989), 3rd ed., p. 315. [13] Proceedings of the Ninth Workshop on Advanced Accelerator Concepts, edited by Patrick L. Colestock and Sandra Kelley, AIP Conf. Proc. No. 569 (AIP, New York, 2001). [14] Ququan Wang, Shufeng Wang, Wentao Huang, Qihuang Gong, Baifeng Yang, and Jing Shi, J. Phys. D 35, 430 (2002). [15] T. Tsang and V. Radeka, Rev. Sci. Instrum. 66, 3844 (1995).
042801-7