Numerical comparison between conventional dispersion compensating fibers and photonic crystal fibers as lumped Raman amplifiers C. E. S. Castellani,1 S. P. N. Cani,2 M. E. V. Segatto,1 M. J. Pontes,1 and M. A. Romero3,* 1
Electrical Engineering Department, Federal University of Espírito Santo, Vitoria, ES, Brazil 2 Federal Institute of Espírito Santo, IFES, Vitoria, ES, Brazil 3 Electrical Engineering Department, University of Sao Paulo, Sao Carlos, SP, Brazil *
[email protected]
Abstract: In this paper we discuss the use of photonic crystal fibers (PCFs) as discrete devices for simultaneous wideband dispersion compensation and Raman amplification. The performance of the PCFs in terms of gain, ripple, optical signal-to-noise ratio (OSNR) and required fiber length for complete dispersion compensation is compared with conventional dispersion compensating fibers (DCFs). The main goal is to determine the minimum PCF loss beyond which its performance surpasses a state-of-the-art DCF and justifies practical use in telecommunication systems. ©2009 Optical Society of America OCIS codes: (060.2320) Fiber optics amplifiers and oscillators; (060.2330) Fiber optics communications
References and links 1. 2.
3. 4. 5. 6. 7. 8. 9.
10. 11. 12.
13.
C. Lin, H. Kogelnik, and L. G. Cohen, “Optical-pulse equalization of low-dispersion transmission in single-mode fibers in the 1.3 - 1.7-µ m spectral region,” Opt. Lett. 5(11), 476–478 (1980). J. M. Dugan, A. J. Price, M. Ramadan, D. L. Wolf, E. F. Murphy, A. J. Antos, D. K. Smith, and D. W. Hall, “Alloptical, fiber-based 1550 nm dispersion compensation in a 10 Gb/s, 150 km transmission experiment over 1310 nm optimized fiber,” in Proceedings of the Optical Fiber Communications Conference (OFC), (San Jose, CA, 1992), Paper PD14. P. B. Hansen, G. Jacobovitz-Veselka, L. Gruner-Nielsen, and A. J. Stentz, “Raman amplification for loss compensation in dispersion compensating fiber modules,” Electron. Lett. 34(11), 1136–1137 (1998). J. D. Ania-Castañon, and S. K. Turitsyn, “Noise and gain optimisation in bi-directionally pumped dispersion compensating amplifier modules,” Opt. Commun. 224(1-3), 107–111 (2003). A. Ferrando, E. Silvestre, P. Andres, J. Miret, and M. Andres, “Designing the properties of dispersion-flattened photonic crystal fibers,” Opt. Express 9(13), 687–697 (2001). K. Saitoh, M. Koshiba, T. Hasegawa, and E. Sasaoka, “Chromatic dispersion control in photonic crystal fibers: application to ultra-flattened dispersion,” Opt. Express 11(8), 843–852 (2003). L.- P. Shen, W.-P. Huang, and S.-S. Jian, “Design of photonic crystal fibers for dispersion related applications,” J. Lightwave Technol. 21(7), 1644–1651 (2003). T. Matsui, J. Zhou, K. Nakajima, and I. Sankawa, “Dispersion flattened photonic crystal fiber with large effective area and low confinement loss,” J. Lightwave Technol. 23(12), 4178–4183 (2005). L. Yao, S. Lou, H. Fang, T. Guo, H. Li, and S. Jian, “High Negative Dispersion and Low Confinement Loss Photonic Crystal Fiber,” in Asia Optical Fiber Communication & Optoelectronic Exposition (OEA), (Shangai, 2007). Z. Zhang, Y. Shi, B. Bian, and J. Lu, “Large Negative Dispersion in Dual-Core Photonic Crystal Fibers Based on Optional Mode Coupling,” IEEE Photon. Technol. Lett. 20(16), 1402–1404 (2008). T. A. Birks, J. C. Knight, and P. St. J. Russell, “Endlessly single-mode photonic crystal fiber,” Opt. Lett. 22(13), 961–963 (1997). B. J. Mangan, F. Couny, L. Farr, A. Langford, P. J. Roberts, D. P. Williams, M. Banham, M. W. Mason, D. F. Murphy, E. A. M. Brown, H. Sabert, T. A. Birks, J. C. Knight, and P. S. J. Russell, “Slope-matched dispersioncompensating photonic crystal fiber,” in Conference on Lasers and Electro-Optics/International Quantum Electronics Conference and Photonic Applications Systems Technologies, Technical Digest (CD) (Optical Society of America, 2004), paper CPDD3. Z. Yusoff, J. H. Lee, W. Belardi, T. M. Monro, P. C. Teh, and D. J. Richardson, “Raman effects in a highly nonlinear holey fiber: amplification and modulation,” Opt. Lett. 27(6), 424–426 (2002).
#115596 - $15.00 USD Received 12 Aug 2009; revised 15 Nov 2009; accepted 15 Nov 2009; published 3 Dec 2009
(C) 2009 OSA
7 December 2009 / Vol. 17, No. 25 / OPTICS EXPRESS 23169
14. S. P. N. Cani, C. A. De Francisco, D. H. Spadoti, V. E. Nascimento, B.-H. V. Borges, L. C. Calmon, and M. A. Romero, “Requirements for efficient Raman amplification and dispersion compensation using microstructured optical fibers,” Fiber Integr. Opt. 26(5), 255–270 (2007). 15. K. Digweed-Lyytikainen, C. A. De Francisco, D. Spadoti, A. A. Juriollo, J. B. Rosolem, J. B. M. Ayres Neto, B. V. Borges, J. Canning, and M. A. Romero, “Photonic crystal optical fibers for dispersion compensation and Raman amplification: design and experiment,” Microw. Opt. Technol. Lett. 49(4), 872–874 (2007). 16. J. Zhou, K. Tajima, K. Nakajima, K. Kurokawa, C. Fukai, T. Matsui, and I. Sankawa, “Progress on low loss photonic crystal fibers,” Opt. Fiber Technol. 11(2), 101–110 (2005). 17. K. Tajima, J. Zhou, K. Nakajima, and K. Sato, “Ultralow loss and long length photonic crystal fiber,” J. Lightwave Technol. 22(1), 7–10 (2004). 18. P. J. Roberts, B. J. Mangan, H. Sabert, F. Couny, T. A. Birks, J. C. Knight, and P. S. J. Russell, “Control of dispersion in photonic crystal fibers,” J. Opt. Fiber Commun Rep. 2(5), 435–461 (2005). 19. S. K. Varshney, K. Saitoh, M. Koshiba, and P. J. Roberts, “Analysis of a realistic and idealized dispersioncompensating photonic crystal fiber Raman amplifier,” Opt. Fiber Technol. 13(2), 174–179 (2007). 20. S. P. Cani, M. Freitas, R. T. Almeida, and L. C. Calmon, “Raman amplifier performance of dispersion compensating fibers,” in Proceedings of SBMO/IEEE MTT-S International Microwave and Optoeletronics Conference (IMOC 2003), (Iguazu Falls, Brazil, 2003), pp. 553–558. 21. G. P. Agrawal, Nonlinear Fiber Optics (Academic Press, USA, 3rd edition, 2001), Chap.8. 22. D. Dahan, and G. Eisenstein, “Numerical comparison between distributed and discrete amplification in a pointto-point 40 Gbit/s 40-WDM-based transmission system with three different modulation formats,” J. Lightwave Technol. 20(3), 379–388 (2002). 23. H. Kidorf, K. Rottwitt, M. Nissov, M. Ma, and E. Rabarijaona, “Pump interactions in a 100-nm bandwidth Raman amplifier,” IEEE Photon. Technol. Lett. 11(5), 530–532 (1999). 24. M. Achtenhagen, T. G. Chang, B. Nyman, and A. Hardy, “Analysis of a multiple-pump Raman amplifier,” Appl. Phys. Lett. 78(10), 1322–1324 (2001). 25. S. P. Cani, L. C. Calmon, M. J. Pontes, M. R. N. Ribeiro, M. E. V. Segatto, and A. V. T. Cartaxo, “An analytical approximated solution for the gain of broadband Raman amplifiers with multiple counter-pumps,” J. Lightwave Technol. 27(7), 944–951 (2009). 26. Y. Aoki, “Properties of fiber Raman amplifiers and their applicability to digital optical communication systems,” J. Lightwave Technol. 6(7), 1225–1239 (1988). 27. C. E. S. Castellani, S. P. N. Cani, M. E. Segatto, M. J. Pontes, and M. A. Romero, “Design methodology for multi-pumped discrete Raman amplifiers: case-study employing photonic crystal fibers,” Opt. Express 17(16), 14121–14131 (2009). 28. S. K. Varshney, T. Fujisawa, K. Saitoh, and M. Koshiba, “Novel design of inherently gain-flattened discrete highly nonlinear photonic crystal fiber Raman amplifier and dispersion compensation using a single pump in Cband,” Opt. Express 13(23), 9516–9526 (2005). 29. S. G. Leon-Saval, T. A. Birks, N. Y. Joly, A. K. George, W. J. Wadsworth, G. Kakarantzas, and P. S. J. Russell, “Splice-free interfacing of photonic crystal fibers,” Opt. Lett. 30(13), 1629–1631 (2005). 30. A. Huttunen, and P. Törmä, “Optimization of dual-core and microstructure fiber geometries for dispersion compensation and large mode area,” Opt. Express 13(2), 627–635 (2005). 31. S. Yang, Y. J. Zhang, X. Z. Peng, Y. Lu, S. H. Xie, J. Li, W. Chen, Z. Jiang, J. Peng, and H. Li, “Theoretical study and experimental fabrication of high negative dispersion photonic crystal fiber with large area mode field,” Opt. Express 14(7), 3015–3023 (2006).
1. Introduction In the last few years the quick growth of the Internet and other bandwidth demanding applications have motivated a drastic increase in the bit-rates transmitted over long-haul fiber optic systems. This increase has enhanced the need to compensate the dispersion introduced by the transmission fiber, as usually done by adding sections of dispersion compensating fibers (DCFs) along the fiber optic link. Those DCFs were proposed in the 80’s [1] and have found widespread use since the 90’s [2]. The DCFs have also enabled the development of lumped devices which not only provide dispersion compensation but can also act as a Raman amplification medium [3,4]. A careful combination of pump lasers, regarding its emission wavelengths and output optical powers, together with specific fiber characteristics, allows transparent operation of wideband WDM systems over hundreds of kilometers with almost complete dispersion and loss compensation. Although conventional DCFs have been widely used, the development of photonic crystal fibers (PCFs) has brought new design possibilities. Among its unique features, one can mention highly tunable dispersion characteristics [5] including flexible chromatic dispersion over a wide wavelength range [6–8] or high negative dispersion [9,10] as well as ultra
#115596 - $15.00 USD Received 12 Aug 2009; revised 15 Nov 2009; accepted 15 Nov 2009; published 3 Dec 2009
(C) 2009 OSA
7 December 2009 / Vol. 17, No. 25 / OPTICS EXPRESS 23170
wideband single mode operation [11] and slope matched characteristics [12]. Significant onoff gain values for Raman amplification in short PCF fiber lengths [13] have also been experimentally demonstrated. The use of PCFs enables high negative dispersion values in very small effective areas, which are essential parameters when focusing on lumped devices for Raman amplification and dispersion compensation. In practice, the major problem faced by for PCF-based Raman amplifiers is the high value of optical loss, which diminishes the maximum achievable gain [14,15]. Those fabrication related losses are mainly caused by high water (OH) content and scattering losses [16]. Although the fabrication process of PCFs has significantly improved in the last few years [16,17] optical losses are still a very serious problem regarding small-effective area PCF and preclude the use of those fibers in real-life optical communications devices. In this paper, we revisited the loss problem in PCFs. Specifically, by considering a stateof-the art dual-core PCF we seek to determine the minimum PCF loss beyond which its performance surpasses a conventional DCF. The goal is to offer guidelines concerning how much lower should be the background losses before those PCFs can find practical use as lumped Raman amplification and dispersion compensation devices. In order to carry out this investigation, our simulation method utilizes an analytical formulation as a first step to determine the optimum combination of pump lasers and wavelengths to achieve a given set of amplifier characteristics. Next, we employ a full signal analysis model to numerically solve the coupled propagation equations and compute the expected Raman amplifier performance in a fiber-optic telecommunications link. The paper outline is given as follows: the PCF characteristics are described in Section 2. In Section 3 the numerical models used in the simulations are presented, and in Section 4 the results are discussed. Finally, Section 5 concludes the paper. 2. Dispersion compensating PCF geometry The PCF considered in our simulations presents a highly negative dispersion coefficient and it was chosen for comparison with a conventional DCF because it was already demonstrated as a very good candidate to efficiently compensate the fiber dispersion in long-haul fiber systems. The fiber specifications are based on the PCF described in detail in [12,18], which, to the best of our knowledge, presents the most negative dispersion coefficient ever experimentally demonstrated. Also, its slope-matched dispersion characteristics are designed to fully compensate the dispersion introduced by commercial standard single mode fibers (SMF) operating in the C band. Both fibers, PCF or conventional DCF, can be used for simultaneous Raman amplification and dispersion compensation. However, in this particular case, the PCF presents a much higher negative dispersion value, i.e., −1216 ps/(nm.km) at 1550 nm, meanwhile for a typical commercially available DCF offers a much lower dispersion coefficient, around − 98 ps(nm.km). Essentially, this means that, although the PCF losses are much higher, the PCF length necessary for full dispersion compensation is much shorter. A clear trade-off is then established. As technology matures, those microstructured fibers will eventually be fabricated at the required lengths with reduced losses, surpassing the conventional DCF performance. Currently, although PCF total losses as low as 0.28 dB/km at 1550 nm have already been reported [16], the losses of PCFs are usually much higher than in conventional silica fibers. Fabrication related losses are usually caused by undesired roughness on the inner surface of the PCF air-holes as well as impurity absorption loss, arising mostly from residual OH contamination. These factors, which we call “excess background loss”, are expected to become progressively less important as fabrication technology evolves. Still, for fibers presenting a small effective area, as the one investigated in this paper, the scattering loss arising from the inner surface roughness of the PCF air holes can be very significant. Therefore, in this paper we assume a start baseline loss of 5 dB/km, which is progressively lowered during the numerical investigation in order to find out which would be the #115596 - $15.00 USD Received 12 Aug 2009; revised 15 Nov 2009; accepted 15 Nov 2009; published 3 Dec 2009
(C) 2009 OSA
7 December 2009 / Vol. 17, No. 25 / OPTICS EXPRESS 23171
hypothetical loss value in which the PCF performance equals a conventional DCF. Table 1 summarizes the parameters used in our analysis. The PCF characteristics, such as the effective area, were taken from [19], where they were originally obtained by using a full-vectorial finite element modal solver. Table 1. System parameters.
Aeff (λ = 1550 nm) (µm2) D (λ = 1550 nm) (ps/(nm.km) Raman peak gain efficiency (W−1km−1) Noise bandwidth ∆ν (nm) L (km) Attenuation (λ = 1550 nm) (dB/km)
SMF
PCF
DCF
76.30
1.81
22.07
17
−1216
−98
0.43
21.00
3.20
0.1 70.00
0.1 1.00 Variable under investigation, baseline of 5 dB/km
0.1 12.15
0.19
0.50
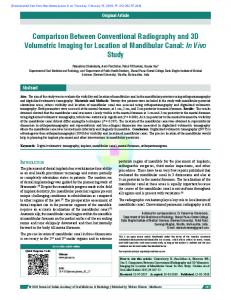
3. Simulation Models Simulations of optical signal propagation in Raman amplifiers can be carried out basically by three different approaches. The problem can be treated numerically, either by solving the extended nonlinear Schrödinger equations (ENLSE) [20–22] or a suitable steady-state approximation [22–24]. As an alternative, an analytical solution [25] can be applied to the steady-state analysis, with the associated penalty of some inevitable simplifications. The ENLSE method allows the propagation of modulated signals, while steady-state formalism permits only the calculation of the optical power evolution along the fiber length. As a bonus, its computational cost is much smaller. Regarding the steady-state analysis in the Raman amplifier modeling, both numerical and analytical approaches can be applied. The power evolution calculation performed by numerical methods enables the inclusion of effects such as pump depletion, wavelength dependence of the pump loss, amplified spontaneous emission (ASE), double Rayleigh scattering (DRS) and the accurate determination of the OSNR. Those effects are only partially computed or even neglected in the analytical approaches. On the other hand, analytical techniques allow accurate evaluation of gain and gain ripple within reduced computing time, a crucial feature to allow the design of Raman amplifiers employing multi-pump for several distinct signal wavelengths and optical power levels. In our paper, the steady-state analysis was indeed used, because it is enough to provide reliable values of gain, the main figure of merit for our investigation. Then, in the steady-state framework, a hybrid mix of numerical and analytical techniques was employed, as summarized by the diagram shown in Fig. 1. Specifically, our calculations are performed in two steps. First, a quick and simplified analytical solution [25] is used in order to explore a huge variety of different pump configurations. The analytical approach considers pump-to-pump and signal-to-pump interactions and also takes into account wavelength dependent effects such as effective area spectral dependence and individual signal loss coefficients, but neglects the pump depletion by the signal, the wavelength dependence of the pump loss, and also disregards noise effects, because the gain calculation is not significantly influenced by such approximations [20,25]. More details on the analytical solution and its constrains can be found in our previous work [25]. Next, a more precise numerical solution [20] is used to investigate only the most promising pump configurations, which means pump sets with high gains and ripple values lower than 1 dB. Since the power evolution calculation performed by this numerical model #115596 - $15.00 USD Received 12 Aug 2009; revised 15 Nov 2009; accepted 15 Nov 2009; published 3 Dec 2009
(C) 2009 OSA
7 December 2009 / Vol. 17, No. 25 / OPTICS EXPRESS 23172
takes into account the effects not included in the analytical solution [25], it becomes possible to assure a reliable assessment of the amplifier gain response for the pre-selected pump schemes.
Raman amplifier modeling
SteadyState Numerical model
Analytical model
Power evolution, CW
Power evolution, CW
Pump depletion, ASE, DRS, pump loss wavelength dependance.
No pump depletion, without ASE and RBS
Gain and ripple
Gain and ripple
OSNR
Fig. 1. Tree diagram showing the relationship among Raman amplifier models used.
4. Results
DEMUX
MUX
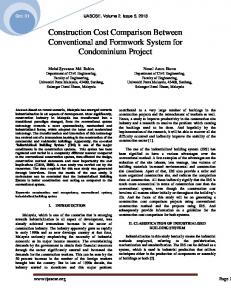
Our analysis of the Raman amplifier performance is based on the optical system configuration shown in Fig. 2. A two-pump counter-propagated lumped Raman amplifier is placed at the very end of the entire span, which was designed to amplify 20 WDM channels, equally spaced at the C band (1530.33 nm – 1560.61 nm), each one with −10 dBm of optical power launched at the SMF input. The counter-pumped configuration was used to assure that the signal transmission is less affected by the fiber nonlinearities.
Fig. 2. The discrete multi-pumped Raman amplifier setup.
#115596 - $15.00 USD Received 12 Aug 2009; revised 15 Nov 2009; accepted 15 Nov 2009; published 3 Dec 2009
(C) 2009 OSA
7 December 2009 / Vol. 17, No. 25 / OPTICS EXPRESS 23173
A 70 km SMF link was taken as the transmission fiber. In order to ensure almost full compensation of the accumulated chromatic dispersion, we have considered a conventional DCF, 12.15 km long. Next, in the simulations, the DCF was replaced by 1 km of the previously described PCF. Regarding the Raman amplifier, it was assumed a depolarized pump scheme, with the polarization factor equal to 2 [26]. In order to guarantee a fair comparison between the two kinds of fiber, i.e. PCF and DCF, it is necessary to define pump configurations in which the amplifiers are optimized in terms of gain and ripple, by a proper selection of pump powers and wavelengths in each case. This optimization task was undertaken by an exhaustive search performed through the procedure outlined below [27]. First, within a selected range of pump powers and wavelengths, the analytical model, described in Section 3, is computed thousand times, randomly changing the power and the wavelength of each pump configuration. The most promising cases, considering high gain and low ripple, are then chosen for a more accurate analysis, which is done by the numerical model [20] described in Section 3. More details regarding this optimization method can be found in [27]. Note also that some of the previous investigations have focused on single-pump schemes [28]. 4.1 Analytical model results Our initial design goal was to find the pump configuration with higher gain, while keeping the gain ripple below 1 dB. The gain is measured by comparing the output power at the very end of the span with the signal power at the input of the dispersion compensating fiber (DCF or PCF). Meanwhile, the gain ripple is defined as the spectral gain variation within the Raman amplifier bandwidth. The maximum power of each pump laser was limited at 450 mW to enable using commercial devices. In the initial simulations, the laser wavelength was allowed to vary from 1400 nm up to 1500 nm. Each time in which the search procedure was carried out, the analytical model was inspected 150,000 times, allowing the analysis of 150,000 distinct pump configurations. The use of the analytical formulation allows this extensive search to happen in just a few minutes. The overall procedure was carried out a few times for each fiber. Specifically, in the PCF case, the simulation was performed using several distinct values of optical attenuation to allow a comparison with the DCF performance.
#115596 - $15.00 USD Received 12 Aug 2009; revised 15 Nov 2009; accepted 15 Nov 2009; published 3 Dec 2009
(C) 2009 OSA
7 December 2009 / Vol. 17, No. 25 / OPTICS EXPRESS 23174
(a)
(b)
(c)
Fig. 3. Solution space for a PCF loss of (a) 3 dB/km, (b) 4 dB/km and (c) 5 dB/km attenuation.
#115596 - $15.00 USD Received 12 Aug 2009; revised 15 Nov 2009; accepted 15 Nov 2009; published 3 Dec 2009
(C) 2009 OSA
7 December 2009 / Vol. 17, No. 25 / OPTICS EXPRESS 23175
The PCF optical loss was varied in the range of 3-5 dB/km. In this framework, Fig. 3 illustrates three different results for the solution space (gain and ripple), displaying the 150,000 points obtained (each one for a given pump configuration). Each set of results was calculated, respectively, for different values of the PCF optical loss as (a) 3 dB/km, (b) 4 dB/km and (c) 5 dB/km. From a design point of view, there is a clear trade-off between gain and ripple. One can easily notice that the amplifiers presenting very low ripple can achieve, even in the best cases, only moderate values of gain. In contrast, amplifiers with the higher values of mean gain suffer from high ripple. According to this scenario, results of Table 2 were obtained by setting the ripple just below maximum admissible target value of 1 dB, either for the PCF or DCF. In this situation, a typical DCF gain would be 16.2 dB. Table 2: Best configurations obtained with the analytical model. Fiber DCF PCF – 5 dB/km PCF – 4.5 dB/km PCF – 4 dB/km PCF – 3.75 dB/km PCF – 3.5 dB/km PCF – 3 dB/km
Pump wavelengths (nm) 1413.2 1446.7 1421.5 1451.6 1421.2 1451.6 1421.3 1451.6 1421.3 1451.6 1421.3 1451.5 1421.5 1451.4
Pump power (mw) 319.3 382.7 450.0 450.0 449.7 449.9 449.7 450.0 450.0 449.9 449.8 449.9 415.7 448.7
Mean gain (dB) 16.2 12.4 13.9 15.4 16.2 17.0 18.0
Regarding the PCF, the result obtained for the DCF can be equaled if the total optical loss can be kept around 3.75 dB/km, which is not an extremely low value. It is also interesting to note that the selected pump set (in a two-pump scheme) is not significantly altered by the change of the optical attenuation parameter. The gain as a function of the signal wavelength, considering the cases presented in Table 2 are shown in Fig. 4. 20 α = 3.75 dB/km α = 3.0 dB/km
18
Gain (dB)
α = 3.5 dB/km
DCF
16
α = 4.0 dB/km
14 α = 4.5 dB/km
12 α = 5.0 dB/km
10 1530
1535
1540
1545
1550
1555
1560
1565
Wavelength (nm) Fig. 4. Gain versus the signal wavelength for all the cases shown on formulation.
Table 1: analytical
#115596 - $15.00 USD Received 12 Aug 2009; revised 15 Nov 2009; accepted 15 Nov 2009; published 3 Dec 2009
(C) 2009 OSA
7 December 2009 / Vol. 17, No. 25 / OPTICS EXPRESS 23176
Analysis of Fig. 4 reveals that the spectral shape of the PCF curves is not significantly affected by changing the attenuation parameter, although the gain amplitude is modified, as expected. Those initial results indicate a smooth gain response, which is a very important feature regarding use its in practical systems. However, results arisen from the analytical model may not be completely accurate, given the simplifications concerning the analytical formulation. For this reason, in the next section, we apply the full numerical method to the configuration already pre-selected in Table 2. 4.2 Numerical simulation results In order to account for the amplified spontaneous emission (ASE) and Rayleigh backscattering (RBS) as a function of the signal input in the Raman amplifier performance, the numerical model was used. The gain as a function of the signal wavelength, for all cases from Table 2, is again shown in Fig. 5, now depicting the results from the numerical model. Comparing Figs. 5 and 6, the spectral characteristics of the DCF has remained almost the same, while the numerical results from the PCF are about 1 dB lower than that those obtained using the analytical model. Still, the difference is small and indicates that both models are in good agreement, as summarized in Table 3. In this case, the PCF attenuation which produces similar performance of the DCF is around 3.5 dB/km, quite close to the value of 3.75 dB/km previously obtained. 20 α = 3.75 dB/km
18
α = 3.5 dB/km
Gain (dB)
α = 3.0 dB/km
16
DCF
14
α = 4.0 dB/km α = 4.5 dB/km
12
α = 5.0 dB/km
10 1530
1535
1540
1545
1550
1555
1560
1565
Wavelength (nm) Fig. 5. Gain versus the signal wavelength for all the cases studied: numerical model. Table 3 – Comparative table: numerical vs. analytical models. Fiber DCF PCF - 5 dB/km PCF – 4.5 dB/km PCF – 4 dB/km PCF – 3.75 dB/km PCF – 3.5 dB/km PCF – 3 dB/km
Ripple (dB) Analytical 0.99 0.99 0.99 0.99 0.99 0.99 0.99
Mean gain (dB) Analytical 16.2 12.4 13.9 15.4 16.2 17.0 18.0
Ripple (dB) Numerical 1.08 0.89 0.90 0.93 0.97 0.98 0.99
Mean gain (dB) Numerical 15.9 11.6 12.9 14.4 15.1 15.8 16.8
#115596 - $15.00 USD Received 12 Aug 2009; revised 15 Nov 2009; accepted 15 Nov 2009; published 3 Dec 2009
(C) 2009 OSA
7 December 2009 / Vol. 17, No. 25 / OPTICS EXPRESS 23177
Next, numerical simulations were performed by varying the signal launched at the SMF input, from -35 dBm to ?? + 10 dBm, and the mean gain and the OSNR was computed, as illustrated in Fig. 6(a) and 6(b). α = 3.75 dB/km
18
α = 3.5 dB/km
mean gain (dB)
α = 3.0 dB/km
DCF 15 α = 4.0 dB/km α = 4.5 dB/km
12
α = 5.0 dB/km
-35
-30
-25
-20
-15
-10
-5
0
5
10
0
5
10
Input power per channel (dB) 50 α= α= α= α= α= α=
3.0 dB/km 3.5 dB/km 3.75 dB/km 4.0 dB/km 4.5 dB/km 5.0 dB/km DCF
mean OSNR (dB)
40
30
20
10
0 -35
-30
-25
-20
-15
-10
-5
Input power per channel (dB)
Fig. 6. Mean gain (a) and OSNR (b) as a function of the launched signal power at the fiber input.
Figure 6(a) shows the typical Raman amplifier response regarding the launched signal power, per channel. For a signal power lower than –25 dBm the gain is high but the massive presence of noise degrades the OSNR making this region not useful in practical cases, as it can be seen from the OSNR values in Fig. 6(b). Next, there is a nearly flat range, in which the gain does not significantly change when altering the signal input power. Beyond this flat region, high input powers, around zero dBm per channel, saturate the amplifier and are also undesirable because they favor non-linear effects. From Fig. 6(b), it can be noticed that the OSNR displays only a small variation in the investigated range of PCF attenuation levels. As a general rule, the values of OSNR for the PCFs are 5 dB higher than those arising from the DCF. Moreover, Fig. 6 indicates that the
#115596 - $15.00 USD Received 12 Aug 2009; revised 15 Nov 2009; accepted 15 Nov 2009; published 3 Dec 2009
(C) 2009 OSA
7 December 2009 / Vol. 17, No. 25 / OPTICS EXPRESS 23178
?+ 10 dBm signal input power is an adequate operating point. For this value, the OSNR in all cases is above 25 dB, and the amplifier is operating in its linear region. Next, in order to extend the analysis, we attempt to determine how the PCF Raman amplifier responds to limited variations of the Raman gain. In this simulations a 20% variation on the Raman peak gain efficiency, originally taken as 21 W−1km−1 and now ranging from 16.8 up to 25.2 W−1km−1, was assumed The PCF attenuation was kept at 5 dB/km with the same effective area and dispersion given on Table 1. Numerical simulations were performed by varying the signal launched at the SMF input, from – 35 dBm to + 10 dBm, considering the Raman peak gain efficiency equal to 16.8, 21.0 and 25.2 W−1km−1. The mean gain and the OSNR were computed. Figure 7 shows the Raman amplifier response regarding the launched signal power, per channel. As expected, a larger Raman gain efficiency induces faster amplifier saturation. Still, there is always a comfortable range of input powers to allow linear operation.
Fig. 7. Mean gain as a function of the input signal power for three distinct values of Raman gain efficiency.
This 20% variation on Raman gain efficiency may occur because the fabrication process will always introduce imperfections. As a result, the cross-section PCF dimensions will deviate from the nominal values. Also, the fiber cross-section itself will slowly change as a function of the drawing position. However, our previous simulations suggest that the Raman gain performance will be very robust regarding unintentional variations of the geometrical parameters [14]. Significant fluctuations of hole diameter and pitch, away from the optimum value, can still yield satisfactory values of gain. In contrast, the geometry control requirements for complete dispersion compensation are more stringent. Further work is necessary to determine which would be the required fabrication process tolerances in order to assure the deployment of those PCFs in a practical telecom system. Finally, another important issue of additional loss should be splicing losses, which are expected to be fairly high for the investigated PCF, on account of the small mode-field diameter and effective area. Typical splice losses can be as high as a few dB. However, by using a splice-free technique, reference [29] reports 0.8 dB loss at 633 nm for the transition between a SMF and a 2.8 µm diameter-core, highly non-linear PCF. Also, dual-core PCF designs allow, in principle wideband dispersion compensation in large effective area fibers. #115596 - $15.00 USD Received 12 Aug 2009; revised 15 Nov 2009; accepted 15 Nov 2009; published 3 Dec 2009
(C) 2009 OSA
7 December 2009 / Vol. 17, No. 25 / OPTICS EXPRESS 23179
Thus, although Raman gain will suffer, a large portion of reported work on those dual-core PCFs seek to increase the mode field diameter, in order to reduce non-linear effects and/or mitigate the splice losses to conventional single-mode fibers [30,31]. 5. Conclusions In this paper we have analyzed the practical use of a PCF as a lumped device for wideband dispersion compensation and Raman amplification in WDM long-haul systems. The results of gain, ripple and OSNR were compared with a conventional DCF. At first, optimized twopump configurations were found via an analytical model through a comprehensive search into the complete solution space. Next, a more accurate numerical model was used to investigate in detail the performance of those selected configurations. It is possible to find pump configurations, for both PCF and DCF, which allow the design of amplifiers with low ripple, high-moderate gains and satisfactory values of OSNR. We have also found that, if the total loss of that PCF could be reduced to around 3.5 dB/km, its performance regarding the gain would be as good as it is with a DCF. In this case, the PCF performance advantage is clear, because the PCF length needed in order to compensate the dispersion introduced by 70 km of a SMF is just 1 km, instead of the 12.15 km needed with the DCF.
#115596 - $15.00 USD Received 12 Aug 2009; revised 15 Nov 2009; accepted 15 Nov 2009; published 3 Dec 2009
(C) 2009 OSA
7 December 2009 / Vol. 17, No. 25 / OPTICS EXPRESS 23180