Journal of Experimental Marine Biology and Ecology 450 (2014) 98–108
Contents lists available at ScienceDirect
Journal of Experimental Marine Biology and Ecology journal homepage: www.elsevier.com/locate/jembe
Special issue: Charismatic marine mega-fauna
Numerical dispersal simulations and genetics help explain the origin of hawksbill sea turtles in Ascension Island Nathan F. Putman a,⁎,1, F. Alberto Abreu-Grobois b,⁎,1, Annette C. Broderick c, Claudio Ciofi d, Angela Formia d,e, Brendan J. Godley c, Stedson Stroud f, Tara Pelembe g, Philippe Verley h, Natasha Williams f a
Department of Fisheries & Wildlife, Oregon State University, Corvallis, USA Unidad Académica Mazatlán, Instituto de Ciencias del Mar y Limnología, Universidad Nacional Autónoma de México, Mazatlán, Sinaloa, Mexico Centre for Ecology and Conservationer, College of Life and Environmental Sciences, University of Exeter, UK d Department of Biology, University of Florence, Sesto Fiorentino, FI, Italy e Global Conservation Program, Wildlife Conservation Society, New York, NY, USA f Conservation Office Ascension Island Government, Georgetown, Ascension Island, UK g Environmental Management, St Helena Government, Saint Helena, UK h UMR EME (Exploited Marine Ecosystems), IRD (Institut de Recherche pour le Développement), Centre de Recherche Halieutique Méditerranéenne et Tropicale, Sète, France b c
a r t i c l e
i n f o
Keywords: Dispersal mtDNA Ocean circulation model Sea turtle
a b s t r a c t Long-distance dispersal and ontogenetic shifts in habitat use are characteristic of numerous marine species and have important ecological, evolutionary, and management implications. These processes, however, are often challenging to study due to the vast areas involved. We used genetic markers and simulations of physical transport within an ocean circulation model to gain understanding into the origin of juvenile hawksbill sea turtles (Eretmochelys imbricata) found at Ascension Island, a foraging ground that is thousands of kilometers from known nesting beaches. Regional origin of genetic markers suggests that turtles are from Western Atlantic (86%) and Eastern Atlantic (14%) rookeries. In contrast, numerical simulations of transport by ocean currents suggest that passive dispersal from the western sources would be negligible and instead would primarily be from the East, involving rookeries along Western Africa (i.e., Principe Island) and, potentially, from as far as the Indian Ocean (e.g., Mayotte and the Seychelles). Given that genetic analysis identified the presence of a haplotype endemic to Brazilian hawksbill rookeries at Ascension, we examined the possible role of swimming behavior by juvenile hawksbills from NE Brazil on their current-borne transport to Ascension Island by performing numerical experiments in which swimming behavior was simulated for virtual particles (simulated turtles). We found that oriented swimming substantially influenced the distribution of particles, greatly altering the proportion of particles dispersing into the North Atlantic and South Atlantic. Assigning location-dependent orientation behavior to particles allowed them to reach Ascension Island, remain in favorable temperatures, encounter productive foraging areas, and return to the vicinity of their natal site. The age at first arrival to Ascension (4.5–5.5years) of these particles corresponded well to estimates of hawksbill age based on their size. Our findings suggest that ocean currents and swimming behavior play an important role in the oceanic ecology of sea turtles and other marine animals. © 2013 Elsevier B.V. All rights reserved.
1. Introduction Many marine vertebrate species disperse widely over vast expanses of ocean as juveniles, whereas adults (especially females) often have remarkable fidelity to specific areas for reproduction (Block et al., 2011; Lohmann et al., 2008; Putman et al., 2013a). This philopatric behavior leads to isolation among breeding populations that, over time, result in consistent genetic differences which can be used as ⁎ Corresponding authors. E-mail addresses:
[email protected] (N.F. Putman),
[email protected] (F.A. Abreu-Grobois). 1 Both authors contributed equally to this work. 0022-0981/$ – see front matter © 2013 Elsevier B.V. All rights reserved. http://dx.doi.org/10.1016/j.jembe.2013.10.026
“genetic markers” to identify groups of individuals back to their population of origin (Bowen and Karl, 2007; DiBattista et al., 2008; Stiebens et al., 2013). Such techniques are important for understanding patterns of connectivity and dispersal among populations of marine species, as well as inferring which source populations might be influenced by conditions across certain oceanic regions (e.g., determining which populations are impacted by a fishery). Classic examples of the use of genetic markers to elucidate large-scale patterns of dispersal and philopatry come from work on sea turtles (Bolten et al., 1998; Bowen et al., 1989, 1995). Though certainly some variation exists among individuals, populations and species (e.g., Hawkes et al., 2006; Mansfield et al., 2009) it is known that sea turtles disperse across entire ocean basins as juveniles and recruit to
N.F. Putman et al. / Journal of Experimental Marine Biology and Ecology 450 (2014) 98–108
mixed-stock foraging grounds (Bowen and Karl, 2007). They eventually return to the vicinity of their natal beach for reproduction, and intermittently migrate between foraging and reproductive grounds as adults (Bowen et al., 2007). A challenge that has emerged for understanding connectivity and movement of sea turtles is that although inferences from genetic assays provide useful information at a regional or ocean-basin scale, their discriminatory capacities have rarely been comprehensive enough to fully answer questions regarding the identity of all turtles at specific foraging grounds (e.g., Engstrom et al., 2002). This is in part due to incomplete sampling of source populations and to widelyshared genetic markers across numerous nesting beaches, which make unambiguously assigning individual turtles caught in mixed-stock foraging grounds to a source population impossible (Godley et al., 2010). These problems are being met by increasing sampling coverage and developing genetic markers based on longer sequences which provide greater resolving capacities to discriminate among rookeries (e.g., Monzón-Argüello et al., 2010, 2011; Shamblin et al., 2012a,b). However, an intrinsic limitation of these genetic techniques is that they provide no information on the corridors of movement between life-stages. These oceanic links between life-stage are crucial to identify and safeguard to ensure that the populations that use them will persist (Werner et al., 2007). Advances in numerical models of ocean circulation show considerable promise for shedding light on this seemingly intractable problem (Werner et al., 2007). Paired with particle-tracking software, it is possible to simulate the movement of thousands of individual organisms within realistic ocean velocity fields to generate step-bystep predictions about the spatiotemporal distribution of a population (e.g., Putman and Naro-Maciel, 2013; Putman et al., 2013b). The movement of a marine animal is due to the combination of the velocity of ocean currents encountered and the swimming velocity of the individual (Chapman et al., 2011; Gaspar et al., 2006). Ideally, therefore, information on swimming behavior would be incorporated into dispersal predictions. Unfortunately, behavioral information for difficult to study life-stages (such as juvenile sea turtles) is rarely available (Luschi, 2013; Mansfield and Putman, 2013). For weakly swimming organisms and those with limited diving capacity, dispersal can be, as a first approximation, simulated based solely on ocean currents. Although these predictions will not depict exactly how an animal travels at sea, they can provide a useful “null model” for examining the role of ocean currents on the ecology of marine species (e.g., Blumenthal et al., 2009; Hays et al., 2010; Monzón-Argüello et al., 2012; Putman et al., 2010), assuming that the resolution of ocean velocity fields are representative of what an animal encounters (Putman and He, 2013). In addition, these models provide realistic environmental conditions in which simulations to examine how swimming behavior might influence predictions of distribution can be performed (Gaspar et al., 2012; Putman et al., 2012a,b; Scott et al., 2012a). Pairing genetic and dispersal simulation techniques could provide substantial insight into specific questions regarding population connectivity of marine organisms that, traditionally, have been difficult to assess (Werner et al., 2007). Here, we use this paired approach to identify possible source populations of juvenile hawksbill sea turtles (Eretmochelys imbricata) found at Ascension Island (7.96°S, 14.37°W) in the South Atlantic. The presence of juvenile hawksbill at Ascension Island is enigmatic since their nearest nesting sites are along the northeastern coastal states of Bahia to Rio Grande do Norte in Brazil or coastal islands off West Africa, both more than 2000 km away (Monzón-Argüello et al., 2011) (Fig. 1A). Moreover, sightings of hawksbill sea turtles in the open sea are rare, and the dispersal and oceanic ecology of juveniles of this species is poorly understood, even when compared to other sea turtle species (Chung et al., 2009; Monzón-Argüello et al., 2011). Our estimates of physical transport and population connectivity help fill a substantial gap in the information available for this life-stage in hawksbills throughout the Atlantic and Western Indian Oceans.
99
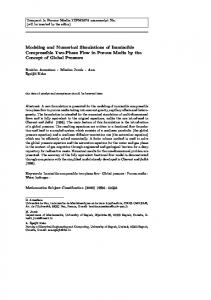
Fig. 1. (A) Generalized depiction of major current systems of the Atlantic Ocean. (B) Description of location-dependent swimming behavior that was modeled, zone numberings are described in further detail in the Methods section. Zones in red indicate regions in which orientation behavior was varied among simulations, each arrow indicating the mean heading for a zone. Zones in black indicate regions in which orientation behavior was constant across simulations, arrows indicating the mean heading. All possible combinations of orientation behavior that are shown were simulated (Table 3). DL = Doce Leguas, Cuba; Mon = Mona Island, PR; USVI = US Virgin Islands; JB = Jumby Bay, Antigua; Bar = Barbados; BV = Boa Vista, Cape Verde; Asc = Ascension Is.; Bah = Bahia, Brazil; Pri = Principe Is.; SH = St. Helena; May = Mayotte Is.
2. Methods 2.1. Sample and data collection Tissue was sampled from 26 hawksbill juveniles opportunistically caught by divers at Ascension Island between 2003 and 2007. Samples were taken from the trailing edge of the foreflippers using scalpel and forceps and stored in ethanol. Curved carapace lengths (CCL) were recorded at capture and averaged 47 cm (range: 35–60 cm). These measures were converted to straight carapace lengths (SCL) following the equation in Teas (1993) so that they could be compared to age estimates by Snover et al. (2013). 2.2. Laboratory procedures A 740 base pair segment from the 5′ end of the mtDNA control region was amplified with polymerase chain reaction (PCR) using the primers LCM-15382 and H950g (Abreu-Grobois et al., 2006) with 1.5 mM MgCl2, 1× PCR buffer, 200 μM each dNTP, 0.5 μM each primer, 0.5 U Taq, 1 μL template DNA and H2O to a total volume of 10 μL, and
100
N.F. Putman et al. / Journal of Experimental Marine Biology and Ecology 450 (2014) 98–108
amplified under the following conditions: 3min at 94°C, 35cycles of 45s at 94 °C, 30 s at 55 °C and 1.5 min at 72 °C, followed by 10 min at 72 °C, using a GeneAmp PCR System 9700 (Perkin Elmer). PCR was then purified using 1 μL of ExoSap enzyme (USB Corp.) to 2.5 μL of product, and sequenced using ABI Big Dye Terminator chemistry V3.1 (Applied Biosystems) on a Applied Biosystems 3100 genetic analyzer. Twentytwo samples amplified successfully for use in the genetic analyses described in the following section. Standard haplotype nomenclatures were assigned by comparing aligned sequences using BioEdit Sequence Alignment Editor v.7.0.9 against a reference catalog of Atlantic basin hawksbill haplotypes (see LeRoux et al., 2012). 2.3. Genetic data analyses To allow comparisons with a broad set of relevant hawksbill genetic surveys, our control region sequences were truncated whenever necessary to the earlier 384 bp reading frame used by Bass et al. (1996) although the 740 bp lengths and standard EiA-XX nomenclature was used whenever possible. Arlequin v 3.5.1.2 (Excoffier and Lischer, 2010) was used with available 384 bp sequences from previous studies of Eastern and Western Atlantic hawksbill habitats (LeRoux et al., 2012; Monzón-Argüello et al., 2010, 2011) to compare haplotype (h) and nucleotide (π) diversities with those from Ascension Island. The same program was used to estimate pairwise Fst (conventional frequencybased) and Φst (applying the Tamura–Nei 1993 nucleotide substitution model). Significance of the Fst and Φst comparisons was adjusted using a false discovery rate (FDR) correction with a table-wide α of 0.05 (Benjamini et al., 2006, as implemented by Pike, 2011). To illustrate genetic relationships among haplotypes we used the software MEGA v 5 (Tamura et al., 2011) to construct an UPGMA cladogram of Ascension haplotypes together with genetically and regionally representative hawksbill haplotypes from published results of Western Atlantic hawksbills. For this we selected 740 bp haplotypes representing and clustering around major clades 1–3 described by LeRoux et al. (2012), 480 bp haplotypes described by Okayama et al. (1999) from IndoPacific foraging and nesting areas and two N740 bp haplotypes found in Mozambique Channel hawksbills (isolates 104 and 113 GenBank JF926550 and JF926555.1, respectively; Santos, C., Anastacio, R., Lopes, C., Ferrao, J., Souto, L. and Pereira, M. Phylogeography of hawksbill turtle (E. imbricata) in the North of Mozambique Channel, unpub.). Bayesian mixed stock analyses (MSA) were computed with available 384 bp haplotype data from western and eastern sources and foraging sites using the many-to-many approach (Bolker et al., 2007) with no prior and with rookery sizes (annual number of nests) as a prior. Source rookery abundances were obtained from LeRoux et al. (2012) (and sources therein) and Monzón-Argüello et al. (2011) for Western Atlantic and Principe Island rookeries, respectively. Values lower than 1.2 in the Gelman–Rubin diagnostic test Gelman and Rubin, 1992 confirmed chain convergence in the MSA posterior distributions. 2.4. Simulating dispersal in an ocean circulation model To assess transport possibilities for hawksbill sea turtles reaching Ascension Island from rookeries in the Atlantic and Western Indian Oceans, we tracked the dispersal of virtual particles within output from the Global Hybrid Coordinate Ocean Model (Global HYCOM). Global HYCOM output has a spatial resolution of 0.08° (~6–9 km grid spacing) and a daily snapshot of current velocity at the ocean surface. Global HYCOM is forced using wind stress, wind speed, heat flux, and precipitation; it assimilates satellite altimetry data, sea surface temperature, and in situ measurements from a global array of XBTs (expendable bathythermographs), Argo floats, and moored buoys to produce realistic “hindcast” model output (http://hycom.org). Thus, Global HYCOM hindcasts resolve mesoscale processes such as meandering currents, fronts, filaments, oceanic eddies, and weather events impacting the ocean surface (Chassignet et al., 2007), which
are important in realistically characterizing oceanic dispersal in marine organisms (Putman and He, 2013). Numerical experiments were performed with ICHTHYOP (v.2) particle-tracking software (Lett et al., 2008). The HYCOM–ICHTHYOP system faithfully depicts the movement of surface-drifting buoys (Fossette et al., 2012; Putman and He, 2013) and is well-established for studying sea turtle dispersal (Lohmann et al., 2012; Putman and He, 2013; Putman and NaroMaciel, 2013; Putman et al., 2010, 2012a,b, 2013b). Available HYCOM output spans November 3, 2003–present, which does not allow us to identify how each individual turtles caught at Ascension Island arrived there. Rather, the simulations of ocean transport described below are intended to depict what might be typical for hawksbill sea turtles (e.g., Monzón-Argüello et al., 2012). To determine how turtles might reach Ascension Island we attempted to bracket the range of transport possibilities by tracking passively drifting virtual particles from major hawksbill rookeries and by backtracking particles released around Ascension Island to determine the ocean currents that lead to this particular location (Putman and Naro-Maciel, 2013). In simulations of dispersal from major hawksbill rookeries in the Atlantic and Western Indian Oceans 900 particles were released during a 90 day period of peak hatchling emergence for each rookery and tracked forwards through time for 7 years for the 2004, 2005, and 2006 cohorts (i.e., 2700 total particles). Rookeries included Doce Leguas, Cuba (20.68°N, 78.71°W), Mona, Puerto Rico (18.07°N, 67.94°W), the U.S. Virgin Islands (17.79°N, 64.62°W), Barbados (13.09°N, 59.62°W), Northeastern Brazil (5.67°S, 36.68°W), Principe Island (1.61°N, 7.35°E), and unknown Indian Ocean rookeries exemplified by Seychelles (3.67°S, 56.87°W). For backtracking simulations, a ~400 × 400 km rectangle centered on Ascension Island (7.96°S, 14.37°W) served as a release zone for virtual particles. Though this area is somewhat arbitrary, it was chosen because sea turtles have been shown to locate Ascension Island from such distances (Luschi et al., 2001). Starting on January 1, 2012 and continuing through January 1, 2009, 100 particles were released each 5days across this area (i.e., 21,900 total particles). Particles were tracked backwards through time for 6 years from the initial release date. For advection of particles, ICHTHYOP implemented a Runge–Kutta fourthorder time-stepping method whereby particle position was calculated each half-hour through the HYCOM velocity fields (Lett et al., 2008). To simulate sub-grid scale turbulent processes, horizontal dispersion was also included in the advection process (Lett et al., 2008; Peliz et al., 2007). Throughout the simulation we recorded daily values of sea surface temperature (SST) encountered by particles. Thus, we determined the origin of particles that arrive in the vicinity of Ascension Island within 6 years and identified possible oceanic pathways that turtles could use to reach this location. The duration of these simulations and the modeling of different cohorts attempted to strike a balance among: (1) available output from a high-resolution ocean circulation model, (2) allowing enough time for particles to disperse from rookeries to Ascension Island, and (3) depicting annual variability in oceanic conditions (e.g., Hays et al., 2010; Putman et al., 2010, 2013b). 2.5. Incorporating swimming behavior Given the results of genetic analyses, as well as oceanic currents that would influence the transport of hawksbill sea turtles (Figs. 1–4), we explored whether oriented swimming by young hawksbill sea turtles from NE Brazil could account for observed and predicted patterns. As with most populations of sea turtles, there is no information regarding oceanic navigation in hawksbill hatchlings and juveniles from Brazil. Numerous studies on loggerheads from the eastern coast of Florida, U.S.A. have shown that hatchlings inherit detailed orientation instructions with respect to spatial variation in the Earth's magnetic field (Fuxjager et al., 2011; Lohmann et al., 2001, 2012; Putman et al., 2011). Specifically, pairings of magnetic intensity and inclination angle
N.F. Putman et al. / Journal of Experimental Marine Biology and Ecology 450 (2014) 98–108
101
Fig. 2. UPGMA cladogram of representative hawksbill haplotypes reported from Western and Eastern Atlantic as well as from Indo-Pacific nesting beaches and foraging grounds (FGs) with bootstrap values. Haplotypes found at the Ascension Island foraging site are indicated in bold. Sequence data and clade conformation for Western Atlantic nesting populations (740 bp) were obtained from LeRoux et al. (2012) and sources therein; Eastern Atlantic haplotypes (740 bp) from Monzón-Argüello et al. (2010, 2011); for Okayama haplotypes (480 bp) from Okayama et al. (1999); N740 bp haplotypes found in Mozambique Channel hawksbills (Moz 104 and 113) from GenBank JF926550 and JF926555.1, respectively.
that exist along the North Atlantic Gyre elicit directional swimming responses in newly hatched turtles under laboratory conditions (Lohmann et al., 2012). Simulations of this behavior indicates that these location-dependent orientation instructions function to promote long-distance transport to the productive foraging grounds of the Eastern Atlantic (Putman et al., 2012a). Whether other species of turtles have a similar navigational system is unknown, but it is conceivable that sea turtles nesting in the western South Atlantic would also benefit from reaching the productive waters in the Eastern Atlantic (in this case the West African Coast) (Lett et al., 2006; Richardson et al., 2001).
Sea turtle swimming has been simulated in a number of ways; in some cases particles essentially “hopped” in certain directions at the end of each day (Gaspar et al., 2012; Scott et al., 2012a,b), in other cases additional velocity was added to the particle as it moved through the velocity field (Hamann et al., 2011; Putman et al., 2012a,b, 2013b). Using modifications to ICHTHYOP v. 2 (Putman et al., 2012a,b), we are able to seamlessly couple swimming behavior to the underlying velocity field. Swim speeds that have been simulated for sea turtles have varied widely (depending on species and the hypotheses being tested) ranging from 0.15 to 0.2 m/s for turtles in their first week of life (Putman et al.,
102
N.F. Putman et al. / Journal of Experimental Marine Biology and Ecology 450 (2014) 98–108
Fig. 3. Mixed stock analysis. Foraging-ground-centric results from many-to-many calculations using 384 bp truncated haplotype frequencies and data sources indicated in Supplemental Table 1. Mean values and their 95% confidence intervals were estimated for contributions from Atlantic rookeries to the Ascension Island foraging grounds. Dark bars represent results with no prior, light bars for runs with a prior based on source abundance (number of nests per year). Sources: Ant = Antigua, BarL = Barbados leeward, BarW = Barbados windward, BraNH = Brazil non hybrids, CR = Costa Rica, Cub = Cuba, Gdl = Guadeloupe, MexHbx = Holbox, Mexico, Nic = Nicaragua, PR = Puerto Rico, USVI = US Virgin Islands, Prin = Principe Island. Gelman–Rubin diagnostic tests were all b1.2 confirming chain convergence in the posterior distributions.
and capable of longer bouts of sustained swimming. In any case, even at the upper programmed swim duration (9 h per day) turtles would travel less than 10 km per day in still water. Thus, we suspect that our estimates are somewhat conservative with respect to the physiological capacity of young hawksbills (Chung et al., 2009). Having turtles cease oriented swimming upon reaching a certain age for some of the orientation zones was to depict the ontogenetic shift in behavior, which presumably occurs, to allow turtles to return to the vicinity of their nesting beach and not disperse from it. Six simulations were performed in which different locationdependent orientation behaviors of turtles were programmed (Fig. 1B). In zone 1 turtles either adopted a mean heading of northeast (45°), east (90°), or southeast (135°). In zone 2 turtles always swam east (90°) and in zone 3 turtles always swam east-northeast (70°). In zone 4 turtles either swam east (90°) or southeast (135°) (Fig. 1B). In this way we were able to explore how variation in orientation behavior might influence the distribution of Brazilian hawksbills. For each scenario of programmed swimming behavior we recorded the temperature that particles encountered, the percentage and ages of particles that reached Ascension Island, and the percentage and ages of particles that reached the productive waters of the continental shelf and inner continental slope of West Africa (between 27.8°N and 37.8°S, water depth b1000 m).
2012b), 0.2 m/s for turtles aging 0–5 years (Putman et al., 2012a), 0.25 m/s for turtles aging 0–2 days (Putman et al., 2013b), 0.314 m/s for turtles aging 0–2 years (Scott et al., 2012a,b), 0.333–0.417 m/s for turtles aging 0–3 days (Hamann et al, 2011), and 0.33–1.07 m/s for turtles aging 1–6 years (Gaspar et al., 2012). Here we take an intermediate approach and simulate swimming as varying between 0.25 and 0.35 m/s for 0–7 year old turtles. We simulated several fixed-direction orientation strategies (similar to Werner et al. (1993) and Scott et al. (2012a,b)) to determine whether simple behavior could help hawksbills from NE Brazil reach Ascension Island within 7 years. Particles were programmed to swim at a mean heading to the northeast (45°), east (90°), or southeast (135°) for the duration of the 7 year simulation for 3 h per day. To account for likely variation in orientation precision and swim speed, each half hour that a particle was active it randomly changed its heading within 30° of the programmed mean and randomly selected a swim speed between 0.25 m/s and 0.35 m/s (as was done for behaviors described below). Additionally, we simulated scenarios in which orientation by particles varied by location, similar to what is seen in Florida, U.S.A. loggerheads (Lohmann et al., 2012; Putman et al., 2012a). In this case, four “orientation zones” were defined in which turtles were programmed to swim in certain directions and for different durations; outside of these areas turtles drifted passively (Fig. 1B). Zone 1 spans the nearshore area off NE Brazil from 15°S to the Equator and from 50°W to 32°W. Zone 2 lies to the south and spans 45°S to 15°S and 70°W to the Prime Meridian. Zone 3 is to the east and spans 45°S to 10°S and from the Prime Meridian to 20°E. Zone 4 spans most of the North Atlantic, from the Equator to 45°N and from 95°W to 20°W. Turtles were programmed to swim offshore for the first 48 h of the simulation, in accordance with the offshore swimming behavior observed in hatchling sea turtles (Chung et al., 2009). After this initial period, in zone 1, turtles swam for 3 h per day for the first 500 d of the simulation, after which any particles remaining in this zone drifted passively. In zone 2, turtles swam for 6h per day for the first 1500d of the simulation, after which any particles entering this zone drifted passively. In zone 3, turtles swam for 6h per day for the duration of the simulation. In zone 4, turtles swam 9 h per day for the duration of the simulation. These periods of swim duration are arbitrary but meant to reflect that turtles would be of incremental ages as they progressed through the zones
Fig. 4. Predicted transport routes to Ascension Island based on backtracking particles released at Ascension Island and tracked for 6 years. (A) Density of particles within each grid cell over the duration of the simulations (logarithmically scaled). (B) Mean number of years particles would drift from each grid cell before reaching Ascension Island.
N.F. Putman et al. / Journal of Experimental Marine Biology and Ecology 450 (2014) 98–108 Table 1 Sample sizes (N), number of haplotypes (NH), haplotype (h) and nucleotide (π) diversities of Ascension Island and other Eastern Atlantic foraging aggregations. Site
N
NH
h
S.E.
π
S.E.
Ref
CVFG PrinFG AsFG
28 80 22
6 3 4
0.529 0.143 0.333
0.105 0.052 0.124
0.0168 0.0045 0.0148
0.0091 0.0029 0.0083
Velez-Zuazo et al., 2008 Monzón-Argüello et al., 2011 This study
Abbreviations: CVFG = Cabo Verde foraging aggregation, PrinFG = Principe foraging aggregation, AsFG = Ascension Island foraging aggregation.
3. Results 3.1. Genetic characterization We found a total of four 740 bp mtDNA control region haplotype sequences reflecting the probable presence of both Western (14 EiA01, 1 EiA62; 83% of total) and Eastern Atlantic (2 EiA48, 1 EiA49; 17%) hawksbill lineages which are highly divergent (Fig. 2). Haplotype EiA01 is the most abundant haplotype in the Wider Caribbean and found as the primary haplotype in many of the rookeries there (Antigua, Barbados, Brazil, and Cuba; LeRoux et al., 2012). EiA62 has only been reported from rookeries in Bahia, Brazil (EiBR16 in LaraRuiz et al., 2006). Of the observed Eastern Atlantic haplotypes, EiA49 has been reported from a juvenile hawksbill foraging ground off Cape Verde (Monzón-Argüello et al, 2010) but never been found at any nesting site. Haplotype EiA48 (GenBank acc no. KF709641.1) differs from haplotype EiA49 by a single transition at position 223 and has not been reported at any hawksbill rookery. However, its sequence is identical to that of one reported from hawksbills in the Mozambique Channel (GenBank JF926555.1). Interestingly, within the 384bp reading frame, EiA48 is indistinguishable from haplotype “EATL” which has been reported in hawksbills sampled in a São Tomé market (Bowen et al., 2007), in the majority of foraging hawksbills off Cape Verde Islands (Monzón-Argüello et al, 2010), and in all of the Principe Island nesting females (Monzón-Argüello et al, 2011). Further, in its overlapping span the EATL sequence is identical to haplotype 24 found by Okayama et al. (1999) in hawksbills foraging off the Seychelles in the Indian Ocean. The haplotype diversity (h) of Ascension Island juveniles (0.333) falls between values reported for foraging sites in Cape Verde and Principe Island (Table 1) and tends to be in the lower range when compared to foraging aggregations in the Western Atlantic (reviewed in Monzón-Argüello et al., 2010). In contrast, the nucleotide diversity (π) was one of the highest (0.0168) reported for hawksbill aggregations and, similarly to what was found at Cape Verde, reflects the presence of highly divergent clades in high proportions. Phylogenetic analyses indicate that both of the Western Atlantic haplotypes found in Ascension fall within the clade 1 cluster (Fig. 2) described by LeRoux et al. (2012). On the other hand, the two Eastern
103
Atlantic haplotypes cluster in a very distant branch (d N 0.025) with all of the reported haplotypes from that region (Monzón-Argüello et al., 2010, 2011) as do haplotypes 23 and 24 from a Seychelles foraging site (Okayama et al., 1999) and one of the Mozambique Channel hawksbill haplotypes (Moz 113; Santos et al. unpub. data). Significant genetic differences were found between the Ascension Island hawksbills and all foraging and nesting aggregations in the Eastern Atlantic (Table 2) using both indices (Fst and Φst). However, with conventional frequency-based Fst, no significant differences (Fst = 0.02, p = n.s.) were obtained when comparing against Cuba and Brazil, which reflects a similarity in the presence of haplotype EiA01 at high proportions. Nonetheless, levels of differentiation were higher (N 0.50) when compared against Eastern Atlantic sites (nesting or foraging) than against many of the Western Atlantic rookeries, indicative of an association due to sharing part of the haplotypes in greater proportions than has been found in Eastern Atlantic mixed populations. 3.2. Estimation of regional rookery contributions The many-to-many foraging ground-centric MSA (Fig. 3) based on available haplotype composition data (Supplemental Table 1) reflects the previous results to a large extent. The results from runs using no prior suggested primary contributions from Brazil (18%), Barbadosleeward (17%), and Cuba (15%). All other source contributions were negligible and included 0 within their confidence intervals. Using a prior based on rookery abundance increased the estimate for Brazil (26%), Antigua (14%), and Principe (6%). Prior based contribution from Barbados-windward was also increased (16%) but, together with all remaining sources included 0 inside the confidence intervals. No noteworthy variation was found for size classes, as turtles with haplotypes characteristic of Western rookeries ranged from 33 to 54 SCL and those with Eastern Atlantic haplotypes ranged from 44 to 57 SCL. 3.3. Simulations of passive dispersal Simulations of forward passive drift from northwestern (Caribbean) (Supplemental Fig. 1) and southwestern Atlantic (Brazil) (Fig. 5) nesting beaches failed to identify a direct route via surface currents to Ascension Island within the three 7 year periods modeled. Extending simulations to 8 years (for a subset of the years) produced similar results. No particles from the Caribbean crossed south of the Equator (Supplemental Fig. 1). Particles tracked from Principe Island, in the Eastern Atlantic, were mostly retained in the vicinity of the release site (Supplemental Fig. 2) but a small percentage of the particles would be transported into the vicinity of Ascension Island (1.5%). Dispersal from the Seychelles in the Indian Ocean indicated that while some particles might be transported into the South Atlantic (b 1%;
Table 2 Mitochondrial DNA control region genetic distance (Fst and Φst) values comparing the Ascension Island hawksbill aggregation to Western (W) Atlantic rookeries and Eastern (E) Atlantic rookeries and foraging grounds. All negative values were converted to 0 and significantly different comparisons after adjusting for false discovery rate (FDR, table wide α of 0.05; Benjamini et al., 2006, as implemented by Pike, 2011) are shown in bold. Because some of the information was only available with the 384 bp sequence reading frame, all data were truncated to the same sizes for these analyses. Haplotype profiles for populations outside this study were taken from references indicated in Supplemental Table 1. N Fst
PrinN CVFG PrinFG AsFG Φst PrinN CVFG PrinFG AsFG
Ant (W)
BarL (W)
BarW (W)
Cub (W)
Gdl (W) PR (W) USVI (W) Nic (W)
CR (W)
MxHbx (W)
BraNH (W)
0.68 0.46 0.68 0.18 0.90 0.80 0.90 0.24
0.91 0.79 0.91 0.17 0.95 0.88 0.95 0.19
0.84 0.64 0.84 0.73 0.94 0.83 0.94 0.64
0.82 0.65 0.82 0.02 0.93 0.85 0.93 0.13
0.89 0.78 0.89 0.85 0.95 0.90 0.95 0.79
0.65 0.43 0.65 0.50 0.89 0.79 0.89 0.45
0.85 0.62 0.85 0.74 0.94 0.83 0.94 0.66
0.79 0.61 0.79 0.02 0.95 0.89 0.95 0.20
0.62 0.44 0.62 0.49 0.93 0.87 0.93 0.71
0.74 0.56 0.74 0.59 0.93 0.86 0.93 0.67
0.64 0.46 0.64 0.52 0.91 0.83 0.91 0.56
PrinN (E) CVFG (E)
PrinFG (E)
0.14 0.00 0.78
0.14 0.50
0.78
0.07 0.00 0.86
0.07 0.65
0.86
Abbreviations: Ant = Antigua, BarL = Barbados leeward, BarW = Barbados windward, Cub = Cuba, Gdl = Guadeloupe, PR = Puerto Rico, USVI = US Virgin Islands, Nic = Nicaragua, CR = Costa Rica, MxHbx = Holbox, Mexico, BraNH = Brazil non hybrids, PrinN = Principe rookery, CVFG = Cabo Verde foraging aggregation, PrinFG = Principe foraging aggregation, AsFG = Ascension Island foraging aggregation (this study).
104
N.F. Putman et al. / Journal of Experimental Marine Biology and Ecology 450 (2014) 98–108
following this route was 12.9 °C and 93% of these particles remained above 10 °C throughout the simulation (lower temperatures might be lethal for sea turtles (Davenport, 1997)). Backtracking simulations revealed that surface ocean currents could potentially provide dispersal corridors to Ascension Island from the North Atlantic (north of the Equator), Southeastern Atlantic (south of the Equator, north of 30°S, and west of 20°E), Southwestern Atlantic (south of 30°S and west of 20°E), and Indian Ocean (east of 20°E) basins (Fig. 4). Within the 6 year drift time modeled in the backtracking simulation, the majority of particles (95.5%) arrived at Ascension Island from the Southeastern Atlantic (i.e., West African coast). The remainder of particles arrived from locations in the North Atlantic (1.6%), the Indian Ocean (0.3%), and the Southwestern Atlantic (2.6%). Based on SST of particle trajectories, these dispersal routes are viable for use by juvenile hawksbills to reach Ascension Island. Of the particles arriving from the Southeastern Atlantic, 98.6% remained above 10 °C, 99.1% from the North Atlantic remained above 10 °C, 90.4% from the Indian Ocean, and 10% from the Southwestern Atlantic. Hence, hawksbill habitats across the Western African coast and into the Mozambique Chanel have direct connections to Ascension Island within 6 years via surface currents. Furthermore, hawksbill turtles from nesting beaches in the Northwest Atlantic (the Caribbean Sea) and Southwest Atlantic (Brazil) might be able to reach oceanic regions that favor transport to Ascension, but, if relying on passive drift alone, the routes via the North Atlantic and Southwestern Atlantic are quite unlikely by comparison to turtles coming from Africa. 3.4. Simulations of swimming behavior
Fig. 5. Predicted transport routes from northeastern Brazil (5.67°S, 36.68°W), based on passive drift of particles over 7 years. (A) Density of particles within each grid cell over the duration of the simulation. (B) Mean particle age within each grid cell over the duration of the simulation.
Supplemental Fig. 3), none would reach Ascension Island via passive drift. Temperatures experienced by particles entering the South Atlantic from the Indian Ocean suggest that turtles would not be precluded from taking this route. The mean minimum temperature of particles
In an attempt to reconcile the genetic evidence for a greater proportion of haplotypes in juvenile hawksbills found at Ascension Island being of Western Atlantic origin, and in particular a haplotype that appears to be endemic to the Brazilian population (EiA62, LaraRuiz et al., 2006), we performed a series of experiments to identify how swimming behavior might influence the transport of turtles from NE Brazil to Ascension Island. Passive drift (only a swimming frenzy for the first 48 h) resulted in no particles reaching Ascension Island and only between 3.7 and 6.2% reaching the West African Shelf. Fixeddirection swimming behavior resulted in no particles reaching Ascension Island and few particles reaching the West African Shelf (averaging b18%, in all cases) (Table 3, Fig. 6). Location-dependent swimming behavior resulted in particles reaching Ascension Island in each case, though the exact number varied by year, the initial orientation direction adopted by turtles, and whether turtles swam east or southeast upon entering the North Atlantic (Table 3, Fig. 7, Supplemental Figs. 4–9). Likewise, many more particles reached the
Table 3 Range of results from 7 year particle-tracking simulations for NE Brazil under various behavioral scenarios (for details see Methods and Fig. 1B) for the 3 cohorts simulated (2004–2011, 2005–2012, and 2006–2013). Orientation behavior Percent reaching Ascension Ascension mean age at arrival (yr) Percent reaching Africa Africa mean age at arrival (y) Mean minimum temperature (°C) Passive 45—fixed 90—fixed 135—fixed 45—zone 1 90—zone 4 45—zone 1 135—zone 4 90—zone 1 90—zone 4 90—zone 1 135—zone 4 135—zone 1 90—zone 4 135—zone 1 135—zone 4 NA = not applicable.
0 0 0 0 6.7–11.7
NA NA NA NA 4.6–5.1
3.7–6.2 6.7–8.7 14.4–15.8 15.0–20.1 47.0–57.6
4.2–4.6 3.8–4.1 2.8–4.0 2.4–3.6 2.7–4.0
17.3–20.9 18.4–18.8 19.3–21.1 19.3–22.2 19.8–21.7
5.9–13.2
4.6–5.3
40.7–46.0
1.9–2.3
21.8–23.6
11.6–16.1
4.5–5.4
40.0–42.3
3.1–3.9
19.3–21.5
11.4–15.1
4.5–5.4
26.3–30.9
2.4–2.9
21.2–22.9
9.1–15.7
4.5–5.5
14.7–26.1
3.3–3.9
21.6–23.1
8.3–10.3
4.6–5.3
14.7–23.9
2.2–3.9
22.1–23.9
N.F. Putman et al. / Journal of Experimental Marine Biology and Ecology 450 (2014) 98–108
105
Fig. 6. Predicted transport routes from northeastern Brazil (5.67°S, 36.68°W), in which particles were programmed to swim at 3 h per day to the (A, B) northeast, 45°; (C, D) east, 90°; and (E, F) southeast, 135° and drift passively thereafter. Maps on the left hand column display the density of particles throughout the duration of the simulation (logarithmically scaled), maps on the right indicate mean particle age within each grid cell over the duration of the simulation.
West Africa Shelf compared to simulations of passive drift and fixeddirection swimming. The magnitude of this also varied depending on the orientation instructions and by year (Table 3). 4. Discussion Our results suggest that a high-degree of connectivity among hawksbill habitats across the South Atlantic may be possible. Genetic markers found exclusively in Western Atlantic rookeries are common in Ascension Island. Ocean currents in the vicinity of potential source rookeries and Ascension Island suggest that direct linkages via ocean currents are most likely from the Eastern rookeries, including the interesting possibility that the Indian Ocean serves as a source of at least
a small portion of hawksbill juveniles in the Atlantic basin, with transport of particles predicted from locations as distant as the Seychelles. A possible corroboration for this hypothesis stemming from our numerical experiments is the finding that a portion of loggerhead hatchlings entering the Agulhas current are swept from the Indian Ocean into the Atlantic (Baldwin et al., 2003). In any case, explanations of the substantial contribution of Western Atlantic rookeries to this hawksbill foraging ground appear to require consideration of rookery sizes, in combination with ocean currents and swimming behavior by turtles. Our findings imply that even simple swimming behaviors might have a striking impact on the spatiotemporal distribution of young turtles. In scenarios of passive drift the percentage of particles traveling north of the Equator are in the range of 42 to 71%. Swimming southeast
106
N.F. Putman et al. / Journal of Experimental Marine Biology and Ecology 450 (2014) 98–108
Fig. 7. Example of influence of location-dependent oriented swimming on particle distribution for simulations from northeast Brazil (5.67°S, 36.68°W). In this particular case, particles swam 90° (east) in the zone off the coast of northeastern Brazil (zone 1, in Fig. 1B) and 135° (southeast) in the zone spanning most of the North Atlantic (zone 4, in Fig. 1B). (A) Density of particles within each grid cell over the duration of the simulation. (B) Mean particle age within each grid cell over the duration of the simulation. Other examples are found in Supplemental Figs. 4–9.
at 3.24 km/d resulted in only 2–29% of particles traveling to the North Atlantic, whereas swimming northeast resulted in 60–74% of particles following this route (Fig. 6). Such dramatic variability in transport possibilities based on swimming behavior has not been previously identified in sea turtles, but suggests that under at least some oceanographic conditions, even the “general” distribution of turtles might not be well-predicted by ocean currents alone. Our results highlight the great need for information on swimming and orientation behavior for specific populations of sea turtles. Likewise, locationdependent orientation strategies appear to be a common feature among diverse taxa including sea turtles (Lohmann et al., 2001, 2012; Merrill and Salmon, 2010; Putman et al., 2011), lobsters (Boles and Lohmann, 2003), newts (Phillips et al., 2002) and birds (Beck and Wiltschko, 1988). Thus, our results imply that taking account of directed horizontal movements is likely to be necessary for modeling animal distributions in marine and terrestrial systems. As little information is known about the mechanisms of this behavior in most species such research should be prioritized. Though we show that orientation decisions of turtles can have profound influences on oceanic transport and basin-scale connectivity (Figs. 6, 5), at present, it is impossible to know whether any of the
scenarios we tested approach what occurs in reality. However, because of the genetic data available from Ascension Island habitats and with information on SST encountered by particles, we can at least determine which orientation behavior might be plausible. With genetic and age information for turtles at additional sites along the proposed routes (and from additional rookeries along the African coast) it is conceivable that a set of testable hypotheses regarding turtle swimming behavior could be constructed (e.g., Staaterman et al., 2012; Werner et al., 1993). Simulations of particles “swimming” from NE Brazil indicate that turtles could reach Ascension via a northward or a southward route. Across all simulations in which particles arrived at Ascension (i.e., “location-dependent” oriented swimming) the percentage of particles reaching Ascension via the southern route ranged from 5.3 to 14.0% whereas the percentage of particles arriving from the north ranged from 0.7 to 2.8%. The mean transport times were similar for both routes, each averaging ~4.9 years. This mean value might increase if additional years were modeled, as particles would have more time to reach the island. Minimum transport time across these simulations for the southern route ranged between 1.8 and 4.6 years, depending on year. For the northern route the minimum transport time ranged between 3.1 and 3.7years. These values are less sensitive to the duration of the simulation. However, it should be noted that it is possible that particles programmed only to drift or with “fixed-direction” might begin to reach Ascension Island after more than 8 years (Figs. 4, 5, 6). The mean SCL for Ascension turtles with haplotypes characteristic of Western Atlantic rookeries was approximately 43 cm. Based on findings from Snover et al. (2013), and assuming similar growth dynamics, this corresponds to estimated ages ranging between ~4 and ~8 years (~5 years on the estimated growth curves). The smallest turtle (33 cm SCL) is estimated to be between ~2.5 and ~4.5 years old (~3.25 year on the estimated growth curve). The largest turtle (54 cm SCL) is estimated to be between just under 6 and just under 9 years old (~7.5 years on the growth curves). The age estimates based on turtle size correspond well to the ages predicted from our dispersal simulations. Though genetic markers and the rookery sizes point to the strong likelihood of Brazilian hawksbills reaching Ascension Island why do they arrive there? One possibility is that the relatively small number of hawksbill turtles that occur at Ascension are merely the result of rare oceanographic conditions, rather than part of a general migratory pathway (e.g., Monzón-Argüello et al., 2012). Certainly a limitation of our modeling approach is that high-resolution ocean velocity fields are only available for the past 10 years. If we could have simulated transport for longer durations and for different periods of years it is possible that we could observe passive dispersal from Western Atlantic hawksbill rookeries to Ascension. Longer-term simulations will be possible in the future and should be explored as additional oceanographic data become available. An alternative possibility is that hawksbills reach Ascension due to an indirect result of swimming behavior that serves some other purpose. Several lines of evidence support this latter possibility. First, the simulations in which some particles arrived at Ascension had warmer temperatures, on average, than particles in simulations in which no turtles arrived at Ascension (for simulations with particles reaching Ascension: mean minimum temperature 22.3°C, mean percent of particles remaining above 10°C 99%; for simulations with no particles reaching Ascension: mean minimum temperature 19.3°C, mean percent of particles remaining above 10 °C 91%). This suggests that behavior that increases the likelihood of turtles reaching Ascension Island have benefits for growth and survival, and might be favored by natural selection. Second, simulations in which some particles reached Ascension Island had more particles reach the western coast of Africa and would arrive, on average, approximately 1 year earlier (Table 3). The western coast of Africa is an area of consistent high-productivity (Lett et al., 2006; Richardson et al., 2001) and, therefore, behavior that increases turtles' chances of reaching this area might be favored due to increased foraging opportunities (and those opportunities occurring
N.F. Putman et al. / Journal of Experimental Marine Biology and Ecology 450 (2014) 98–108
sooner). Finally, by reaching Ascension Island, Brazilian turtles are poised to return to their natal coast of South America. Ocean currents alone transport particles far from their site of release and promote retention within the centers of the North Atlantic and South Atlantic gyres (Fig. 5. Supplemental Figs. 1–3). In contrast, the “locationdependent” swimming behavior we simulated resulted in particles being transported westward from Ascension Island back towards the release site (i.e., the natal site of sea turtles) (Fig. 7, Supplemental Figs. 4–9). Our results support the hypothesis that location-dependent orientation instructions may be an important component of the oceanic ecology of juvenile sea turtles: increasing growth, increasing survival, and facilitating transoceanic migration (Putman et al., 2012a; Scott et al., 2012a) and, in this case, indirectly promotes hawksbills arriving to Ascension Island. Interestingly, a similar navigation strategy may exist for the migrations of juvenile salmon in the northeast Pacific. Recent numerical modeling experiments indicate that the distribution of juvenile Chinook salmon (Oncorhynchus tshawytscha) is best accounted for by assuming that they follow a geographically-fixed migratory route and respond little to oceanic variations in ocean currents, productivity, and temperature (Burke et al., 2013). Thus, behavior that helps juvenile migrants follow a predictable path may be common in marine species. The complementary approach of combining observed data (genetic, size) with predictions from modeling are useful for generating and testing hypotheses regarding dispersal and connectivity in the marine environment. The findings presented here provide support for earlier studies showing transatlantic movement by hawksbill turtles (Bellini et al., 2000; Marcovaldi and Filippini, 1991) and help bracket a range of possibilities regarding connectivity and transport during the oceanic-stage of these turtles. In particular, the dispersal models and genetic data propose a number of hypotheses for the oceanic ecology of South Atlantic juvenile hawksbills that are testable with further sampling (e.g., Bellini et al., 2000; Monzón-Argüello et al., 2012; Snover et al., 2013), the application of new tracking technologies (e.g., Mansfield et al., 2012), compound-specific stable isotope analyses to distinguish among individuals using alternative dispersal routes (Lopez-Castro et al., 2013; Seminoff et al., 2012) and the use of existing behavioral assays (e.g., Lohmann et al., 2012). Acknowledgements This project was funded by the Darwin Initiative, and the Overseas Territories Environment Programme with support from Ascension Island Government. We thank those who assisted with sample collection on Ascension Island, in particular the Royal Air Force Divers and Tom Stringell for assistance with analyzing samples. The North Carolina State University Initiative for Biological Complexity provided travel support to NFP. Oregon State University and the Physical Oceanography Laboratory at Instituto de Ciencias del Mar y Limnología (UNAM) provided computational support for some of the dispersal simulations. [SS] Appendix A. Supplementary data Supplementary data to this article can be found online at http://dx. doi.org/10.1016/j.jembe.2013.10.026. References Abreu-Grobois, F.A., Horrocks, J., Formia, A., LeRoux, R., Velez-Zuazo, X., Dutton, P., Soares, L., Meylan, P., Browne, D. 2006. New mtDNA dloop primers which work for a variety of marine turtle species may increase the resolution capacity of mixed stock analyses. In: Frick M, Panagopoulou A, Rees AF, Williams K, compilers. Book of Abstracts. Twenty Sixth Annual Symposium on Sea Turtle Biology and Conservation, 2006 April 2–8. Crete, Greece: International Sea Turtle Society. p. 179. Available from bhttp://www. iucnmtsg.org/genetics/meth/primers/abreu_grobois_etal_new_dloop_primers.pdfN
107
Bass, A.L., Good, D.A., Bjorndal, K.A., Richardson, J.I., Hillis, Z.M., Horrocks, J.A., Bowen, B.W., 1996. Testing models of female reproductive migratory behaviour and population structure in the Caribbean hawksbill turtle, Eretmochelys imbricata, with mtDNA sequences. Mol. Ecol. 5, 321–328. Bellini, C., Sanches, T.M., Formia, A., 2000. Hawksbill turtle tagged in Brazil captured in Gabon, Africa. Mar. Turt. Newsl. 87, 11–12. Beck, W., Wiltschko, W., 1988. Magnetic factors control the migratory direction of pied flycatchers (Ficedula hypoleuca Pallas). Acta Congr. int. Ornithol. 19, 1955–1962. Benjamini, Y., Krieger, A.M., Yekutieli, D., 2006. Adaptive linear step-up procedures that control the false discovery rate. Biometrika 93 (3), 491–507. Block, B.A., et al., 2011. Tracking apex marine predator movements in a dynamic ocean. Nature 475, 86–90. Blumenthal, J.M., Abreu-Grobois, F.A., Austin, T.J., Broderick, A.C., Bruford, M.W., Coyne, M.S., Ebanks-Petrie, G., Formia, A., Meylan, P.A., Meylan, A.B., Godley, B.J., 2009. Turtle groups or turtle soup: dispersal patterns of hawksbill turtles in the Caribbean. Mol. Ecol. 18, 4841–4853. Boles, L.C., Lohmann, K.J., 2003. True navigation and magnetic maps in spiny lobsters. Nature 421, 60–63. Bolker, B.M., Okuyama, T., Bjorndal, K.A., Bolten, A.B., 2007. Incorporating multiple mixed stocks in mixed stock analysis: “many-to-many” analyses. Mol. Ecol. 16, 685–695. Baldwin, R., Hughes, G.R., Prince, I.T., 2003. Loggerhead turtles in the Indian Ocean. In: Bolten, A.B., Witherington, B.E. (Eds.), Loggerhead Sea Turtles. Vol. 2003, pp. 218–232 (Smithsonian Books). Bolten, A.B., Bjorndal, K.A., Martins, H.R., Dellinger, T., Biscoito, M.J., Encalada, S.E., Bowen, B.W., 1998. Transatlantic developmental migrations of loggerhead sea turtles demonstrated by mtDNA sequence analysis. Ecol. Appl. 8, 1–7. Bowen, B.W., Karl, S.A., 2007. Population genetics and phylogeography of sea turtles. Mol. Ecol. Invited Rev. 16, 4886–4907. Bowen, B.W., Meylan, A.B., Avise, J.C., 1989. An odyssey of the green sea turtle, Chelonia mydas: Ascension Island revisited. Proc. Natl. Acad. Sci. U. S. A. 86, 573–576. Bowen, B.W., Abreu-Grobois, F.A., Balazs, G.H., Kamezaki, N., Limpus, C.J., Ferl, R.J., 1995. Trans-Pacific migrations of the loggerhead sea turtle demonstrated with mitochondrial DNA markers. Proc. Natl. Acad. Sci. U. S. A. 92, 3731–3734. Bowen, B.W., Grant, W.S., Hillis-Starr, Z., Shaver, D.J., Bjorndal, A., Bolten, A.B., Bass, A.L., 2007. Mixed-stock analysis reveals the migrations of juvenile hawksbill turtles (Eretmochelys imbricata) in the Caribbean Sea. Mol. Ecol. 16, 49–60. Burke, B.J., Liermann, M.C., Teel, D.J., Anderson, J.J., 2013. Environmental and geospatial factors drive juvenile Chinook salmon distribution during early ocean migration. Can. J. Fish. Aquat. Sci. 70, 1167–1177. Chapman, J.W., et al., 2011. Animal orientation strategies for movement in flows. Curr. Biol. 21, R861–R870. Chassignet, E.P., Hurlburt, H.E., Smedstad, O.M., Halliwell, G.R., Hogan, P.J., Wallcraft, A.J., Baraille, R., Bleck, R., 2007. The HYCOM (Hybrid Coordinate Ocean Model) data assimilative system. J. Mar. Syst. 65, 60–83. Chung, F.G., Pilcher, N.J., Salmon, M., Wyneken, J., 2009. Offshore migratory activity of hawksbill turtle (Eretmochelys imbricate) hatchling, II. Swimming gaits, swimming speed, and morphological comparisons. Chelonian Conserv. Biol. 8, 35–42. Davenport, J., 1997. Temperature and the life-history strategies of sea turtles. J. Therm. Biol. 22, 479–488. DiBattista, J.D., Feldheim, K.A., Garant, D., Gruber, S.H., Hendry, A.P., 2008. Evolutionary potential of a large marine vertebrate: quantitative genetic parameters in a wild population. Evolution 63, 1051–1067. Engstrom, T.N., Meylan, P.A., Meylan, A.B., 2002. Origin of juvenile loggerhead turtles (Caretta caretta) in developmental habitat in Caribbean Panamá. Anim. Conserv. 5, 125–133. Excoffier, L., Lischer, H.E., 2010. Arlequin suite ver 3.5: a new series of programs to perform population genetics analyses under Linux and Windows. Mol. Ecol. Resour. 10 (3), 564–567. Fossette, S., Putman, N.F., Lohmann, K.J., Marsh, R., Hays, G.C., 2012. A biologist's guide to assessing ocean currents: a review. Mar. Ecol. Prog. Ser. 457, 285–301. Fuxjager, M.J., Eastwood, B.S., Lohmann, K.J., 2011. Orientation of hatchling loggerhead sea turtles to regional magnetic fields along a transoceanic migratory pathway. J. Exp. Biol. 214, 2504–2508. Gaspar, P., Georges, J.-Y., Fossette, S., Lenoble, A., Ferraroli, S., Le Maho, Y., 2006. Marine animal behaviour: neglecting ocean currents can lead us up the wrong track. Proc. R. Soc. B 273, 2697–2702. Gaspar, P., Benson, S.R., Dutton, P.H., Reveilere, A., Jacob, G., Meetoo, C., Dehecq, A., Fossette, S., 2012. Oceanic dispersal of juvenile leatherback sea turtles: going beyond passive drift modeling. Mar. Ecol. Prog. Ser. 457, 265–284. Gelman, A., Rubin, D.B., 1992. Inference from iterative simulation using multiple sequences (with discussion). Stat. Sci. 7, 457–511. Godley, B.J., Barbosa, C., Bruford, M., Broderick, A.C., Catry, P., Coyne, M.S., Formia, A., Hays, G.C., Witt, M.J., 2010. Unravelling migratory connectivity in marine turtles using multiple methods. J. Appl. Ecol. 47, 769–778. Hamann, M., Grech, A., Wolanski, E., Lambrechts, J., 2011. Modelling the fate of marine turtle hatchlings. Ecol. Model. 222, 1515–1521. Hawkes, L.A., Broderick, A.C., Coyne, M.S., Godfrey, M.H., Lopez-Jurado, L.-F., Lopez-Suarez, P., Merino, S.E., Varo-Cruz, N., Godley, B.J., 2006. Phenotypically linked dichotomy in sea turtle foraging requires multiple conservation approaches. 16, 990–995. Hays, G.C., Fossette, S., Katselidis, K.A., Mariania, P., Schofield, G., 2010. Ontogenetic development of migration: Lagrangian drift trajectories suggest a new paradigm for sea turtles. J. R. Soc. Interface. 7, 1319–1327. Lara-Ruiz, P., Lopez, G.G., Santos, F.R., Soares, L.S., 2006. Extensive hybridization in hawksbill turtles (Eretmochelys imbricata) nesting in Brazil revealed by mtDNA analyses. Conserv. Genet. 7 (5), 773–781.
108
N.F. Putman et al. / Journal of Experimental Marine Biology and Ecology 450 (2014) 98–108
Leroux, R.A., Dutton, P.H., Abreu-Grobois, F.A., Lagueux, C.J., Campbell, C.L., Delcroix, E., Chevalier, J., Horrocks, J.A., Hillis-Starr, Z., Troeng, S., Harrison, E., Stapleton, S., 2012. Re-examination of population structure and phylogeography of hawksbill turtles in the wider Caribbean using longer mtDNA sequences. J. Hered. 103 (6), 806–820. Lett, C., Roy, C., Levasseur, A., van der Lingen, C.D., Mullon, C., 2006. Simulation and quantification of enrichment and retention processes in the southern Benguela upwelling ecosystem. Fish. Oceanogr. 15 (5), 363–372. Lett, C., Verley, P., Mullon, P., Parada, C., Brochier, T., Penven, P., Blank, B., 2008. A Lagrangian tool for modelling ichthyoplankton dynamics. Environ. Model. Softw. 23, 1210–1214. Lohmann, K.J., Cain, S.D., Dodge, S.A., Lohmann, C.M.F., 2001. Regional magnetic fields as navigational markers for sea turtles. Science 294, 364–366. Lohmann, K.J., Putman, N.F., Lohmann, C.M.F., 2008. Geomagnetic imprinting: a unifying hypothesis of natal homing in salmon and sea turtles. Proc. Natl. Acad. Sci. 105, 19096–19101. Lohmann, K.J., Putman, N.F., Lohmann, C.M.F., 2012. The magnetic map of hatchling loggerhead sea turtles. Curr. Opin. Neurobiol. 22, 336–342. Lopez-Castro, M.C., Bjorndal, K.A., Kamenov, G.D., Zenil-Ferguson, R., Bolten, A.B., 2013. Sea turtle population structure and connections between oceanic and neritic foraging area in the Atlantic revealed through trace elements. Mar. Ecol. Prog. Ser. 490, 233–246. Luschi, P., 2013. Long-distance animal migrations in the oceanic environment: orientation and navigation correlates. ISRN Zool. 2013 (631839), 23. Luschi, P., Åkesson, S., Broderick, A.C., Glen, F., Godley, B.J., Papi, F., Hays, G.C., 2001. Testing the navigational abilities of oceanic migrants: displacement experiments on green sea turtles (Chelonia mydas). Behav. Ecol. Sociobiol. 50, 528–534. Mansfield, K.M., Putman, N.F., 2013. Oceanic habits and habitats — Caretta caretta. In: Wyneken, J., Lohmann, K.J., Musick, J.A. (Eds.), Biology of Sea Turtles. vol. 3. CRC Press, Taylor & Francis, Boca Raton, pp. 189–205. Mansfield, K.L., Saba, V.S., Keinath, J., Musick, J.A., 2009. Satellite telemetry reveals a dichotomy in migration strategies among juvenile loggerhead sea turtles in the northwest Atlantic. Mar. Biol. 156, 2555–2570. Mansfield, K.L., Wyneken, J., Rittschoff, D., Walsh, M., Lim, C.W., Richards, P.M., 2012. Satellite tag attachment methods for tracking neonate loggerhead (Caretta caretta) sea turtles. Mar. Ecol. Prog. Ser. 457, 181–192. Marcovaldi, M.Â., Filippini, A., 1991. Trans-Atlantic movement by a juvenile hawksbill turtle. Mar. Turt. Newsl. 52, 3. Merrill, M.W., Salmon, M., 2010. Magnetic orientation by hatchling loggerhead sea turtles (Caretta caretta) from the Gulf of Mexico. Mar. Biol. 158, 101–112. Monzón-Argüello, C., Rico, C., Marco, A., Lopez, P., Lopez-Jurado, L.F., 2010. Genetic characterization of eastern Atlantic hawksbill turtles at a foraging group indicates major undiscovered nesting populations in the region. J. Exp. Mar. Biol. Ecol. 387, 9–14. Monzón-Argüello, C., Loureiro, N.S., Delgado, C., Marco, A., Lopes, J.M., Gomes, M.G., Abreu-Grobois, F.A., 2011. Príncipe island hawksbills: genetic isolation of an eastern Atlantic stock. J. Exp. Mar. Biol. Ecol. 407, 345–354. Monzón-Argüello, C., Dell'Amico, F., Moriniere, P., Marco, Lopez-Jurado, L.F., Hays, G.C., Scott, R., Marsh, R., Lee, P.L.M., 2012. Lost at sea: genetic, oceanographic and meteorological evidence for storm-forced dispersal. J. R. Soc. Interface. 9, 1725–1732. Okayama, T., Díaz-Fernández, R., Baba, Y., Halim, M., Abe, O., Azeno, N., Koike, H., 1999. Genetic diversity of the hawksbill turtle in the Indo-Pacific and Caribbean regions. Chelonian Conserv. Biol. 3, 362–367. Peliz, A., Marchesiello, P., Dubert, J., Marta-Almeida, M., Roy, C., Queiroga, H., 2007. A study of crab larvae dispersal on the Western Iberian Shelf: physical processes. J. Mar. Syst. 68, 215–236. Phillips, J.B., Freake, M.J., Fischer, J.H., Borland, C.S., 2002. Behavioral titration of a magnetic map coordinate. J. Comp. Physiol. A 188, 157–160. Pike, N., 2011. Using false discovery rates for multiple comparisons in ecology and evolution. Methods Ecol. Evol. 2 (3), 278–282. Putman, N.F., He, R., 2013. Tracking the long-distance dispersal of marine organisms: sensitivity to ocean model resolution. J. R. Soc. Interface. 10, 20120979. Putman, N.F., Naro-Maciel, E., 2013. Finding the “lost years” in green turtles: insights from ocean circulation models and genetic analysis. Proc. R. Soc. B 280, 20131468.
Putman, N.F., Shay, T.J., Lohmann, K.J., 2010. Is the geographic distribution of nesting in the Kemp's ridley sea turtle shaped by the migratory needs of offspring? Integr. Comp. Biol. 50, 305–314. Putman, N.F., Endres, C.S., Lohmann, C.M.F., Lohmann, K.J., 2011. Longitude perception and bicoordinate magnetic maps in sea turtles. Curr. Biol. 21, 463–466. Putman, N.F., Scott, R., Verley, P., Marsh, R., Hays, G.C., 2012a. Natal site and offshore swimming influence fitness and long-distance ocean transport in young sea turtles. Mar. Biol. 159, 117–2126. Putman, N.F., Verley, P., Shay, T.J., Lohmann, K.J., 2012b. Simulating transoceanic migrations of young loggerhead sea turtles: merging magnetic navigation behavior with an ocean circulation model. J. Exp. Biol. 215, 1863–1870. Putman, N.F., Lohmann, K.J., Putman, E.M., Klimley, A.P., Quinn, T.P., Noakes, D.L.G., 2013a. Evidence for geomagnetic imprinting as a homing mechanism in Pacific salmon. Curr. Biol. 23, 312–316. Putman, N.F., Mansfield, K.M., He, R., Shaver, D.J., Verley, P., 2013b. Predicting the distribution of oceanic-stage Kemp's ridley sea turtles. Biol. Lett. 9, 20130345. Richardson, A.J., Verheye, H.M., Herbert, V., Rogers, C., Arendse, L.M., 2001. Egg production, somatic growth and productivity of copepods in the Benguela current system and Angola-Benguela Front S. Afr. J. Sci. 97, 251–257. Santos, C., Anastacio, R., Lopes, C., Ferrao, J., Souto, L. and Pereira, M. Phylogeography of hawksbill turtle (Eretmochelys imbricata) in the North of Mozambique Channel (GenBank, unpub.). Scott, R., Marsh, R., Hays, G.C., 2012a. A little movement orientated to the geomagnetic field makes a big difference in strong flows. Mar. Biol. 159, 481–488. Scott, R., Marsh, R., Hays, G.C., 2012b. Life in the really slow lane: loggerhead sea turtles mature late relative to other reptiles. Funct. Ecol. 26, 227–235. Seminoff, J.A., Benson, S.R., Arthur, K.E., Eguchi, T., Dutton, P.H., Tapilatu, R.F., Popp, B.N., 2012. Stable isotope tracking of endangered sea turtles: validation with satellite telemetry and d15N analysis of amino acids. PLoS ONE 7 (5), e37403. http:// dx.doi.org/10.1371/journal.pone.0037403. Shamblin, B.M., Bjorndal, K.A., Bolten, A.B., Hillis-Starr, Z.M., Lundgren, I., Naro-Maciel, E., Nairn, C.J., 2012a. Mitogenomic sequences better resolve stock structure of southern Greater Caribbean green turtle rookeries. Mol. Ecol. 21 (10), 2330–2340. Shamblin, B.M., Bolten, A.B., Bjorndal, K.A., Dutton, P.H., Nielsen, J.T., Abreu-Grobois, F.A., Reich, K.J., Witherington, B.E., Bagley, D.A., Ehrhart, L.M., Tucker, A.D., Addison, D.S., Arenas, A., Johnson, C., Carthy, R.R., Lamont, M.M., Dodd, M.G., Gaines, M.S., LaCasella, E., Nairn, C.J., 2012b. Expanded mitochondrial control region sequences increase resolution of stock structure among North Atlantic loggerhead turtle rookeries. Mar. Ecol. Prog. Ser. 469, 145–160. Snover, M.L., Balazs, G.H., Murakawa, S.K.K., Hargrove, S.K., Rice, M.R., Seitz, W.A., 2013. Age and growth rates of Hawaiian hawksbill turtles (Eretmochelys imbricata) using skeletochronology. Mar. Biol. 160, 37–46. Staaterman, E., Paris, C.B., Helgers, J., 2012. Orientation behavior in fish larvae: a missing piece to Hjort's critical period hypothesis. J. Theor. Biol. 304, 188–196. Stiebens, V.A., Merino, S.E., Roder, C., Chain, F.J.J., Lee, P.L.M., Eizaguirre, C., 2013. Living on the edge: how philopatry maintains adaptive potential. Proceedings of the Royal Society - B 280, 20130305. Tamura, K., Peterson, D., Peterson, N., Stecher, G., Nei, M., Kumar, S., 2011. MEGA5: molecular evolutionary genetics analysis using maximum likelihood, evolutionary distance, and maximum parsimony methods. Mol. Biol. Evol. 28, 2731–2739. Teas, W., 1993. Species composition and size class distribution of marine turtle strandings on the Gulf of Mexico and southeast United States coasts, 1985–1991. NOAA Technical Memorandum NMFS-SEFSC-315 (43 pp.). Velez-Zuazo, X., Ramos, W.D., van Dam, R.P., Diez, C.E., Abreu-Grobois, A., McMillan, W.O., 2008. Dispersal, recruitment and migratory behaviour in a hawksbill sea turtle aggregation. Mol. Ecol. 17, 839–853. Werner, F.E., Page, F.H., Lynch, D.R., Loder, J.W., Lough, R.G., Perry, R.I., Greenberg, D.A., Sinclair, M.M., 1993. Influences of mean advection and simple behavior on the distribution of cod and haddock early life stages on Georges Bank. 2, 43–64. Werner, F.E., Cowen, R.K., Paris, C.B., 2007. Coupled biological and physical models: present capabilities and necessary developments for future studies of population connectivity. Oceanography 20, 54–69.