Numerical method for compensating the retinal shadows of optical coherence tomography images Tapio Fabritiusa,c , Shuichi Makita a , Youngjoo Hong b , Risto Myllyl¨a c , Toyohiko Yatagai and Yoshiaki Yasunoa
d
a Computational
Optics Group, University of Tsukuba, Tsukuba, Japan; of Mechanical Engineering, KAIST, Republic of Korea; c Optoelectronics and Measurement Techniques Laboratory, University of Oulu, Finland; d Institute of Applied Physics, University of Tsukuba, Tsukuba, Japan b Department
ABSTRACT A numerical method to compensate retinal shadows in choroid is presented. The averaged A-scans beneath retinal vessels and A-scans surrounded by them are calculated. The effect of absorption is estimated by subtracting those A-scans. By adding that offset value to A-scans beneath the retinal vessels, the shadows in the choroid are compensated. In vivo imaging of human eye was performed by 840 nm band standard resolution spectral domain optical coherence tomography and choroidal vasculature projection images were calculated. The removal of retinal shadows improves the readability of choroidal images. Keywords: Ophthalmology, biomedical imaging, image processing
1. INTRODUCTION Ocular vasculature examination is an important way to diagnose opthalmic diseases like glaucoma,1 age-related macular degeneration (ARMD)2 or diabetic retinopathy.3 At this moment, the fluorescein angiography (FA) and indocyanine green angiography (ICGA) are frequently used for that purpose. Even though the satisfying vascular images can be obtained by using those methods, there are some arguments why alternative noninvasive method for FA and ICGA imaging is needed. In these two methods, the dye injection into a vein is used to improve contrast between vessels and surrounding tissue. That dye injection is uncomfortable for patient and that dyeing agent may cause some side effects.4, 5 In addition, those methods are limited for two-dimensional imaging which make occasionally difficult to resolve abnormalities of vessel structure especially in choroid. One alternative method for noninvasive ocular vasculature imaging is optical coherence angiography (OCA).6 That OCA is based on optical coherence tomography (OCT) measurements which provide high resolution sectional imaging of biological tissues.7 Development of OCT technology has made possible to obtain high resolution images with high speed.8, 9 By measuring the phase changes between adjacent A-scans the blood flow dynamics of vessels can be obtained.10–12 The three-dimensional (3D) images of the ocular vascular structure is obtained by observing Doppler signal caused by blood flow within vessels. In that as called Doppler OCA (D-OCA) the retinal vessels are determined by measuring the bidirectional flow of blood in them. The choroidal vessels were determined by observing the power of Doppler shift.6 Unfortunately, that D-OCA requires dense scanning between A-scans which is expensive for measurement time.It is difficult for some patients to endure a long measurement time and keep their eye on fixed position during measurement. Due to the weak Doppler signal from choroid, the choroidal vasculature is not that accurate when D-OCA is applied for ocular vascular imaging. To overcome those problems of D-OCA, as called scattering OCA (S-OCA) method is developed.13 That S-OCA uses light absorption and the scattering properties of blood to segment retinal and choroidal vessels and allows ocular vascular imaging with decreased measurement time. As S-OCA is used the segmentation of vessels is based on intensity characteristics of OCT signal. However, due to the high absorption of retinal vessels and fringe washout, the obtained OCT signal beneath them is significantly decreased causing artifacts in OCT images Further author information: (Send correspondence to T.F.) T.F.: E-mail:
[email protected].fi Coherence Domain Optical Methods and Optical Coherence Tomography in Biomedicine XII, edited by Joseph A. Izatt, James G. Fujimoto, Valery V. Tuchin, Proc. of SPIE Vol. 6847, 68472A, (2008) 1605-7422/08/$18 · doi: 10.1117/12.765395 Proc. of SPIE Vol. 6847 68472A-1 2008 SPIE Digital Library -- Subscriber Archive Copy
and also in vascular images of choroid. Those artifacts decreases the quality and informativity of choroidal vessel images. In this paper we present simple numerical method to compensate the artifacts caused by absorption of retinal vessels. The primary aim of that method is to improve readability of choroidal vessel images and also get some real information about the choroid beneath retinal vessels.
2. METHOD 2.1 Measurement System A standard SD-OCT system as shown in Fig. 1. is used to obtain three-dimensional retinal and choroidal OCT images.6 A superluminescent diode (SLD) with 840 nm center wavelength and a FWHM spectral bandwidth 50 nm was used as a light source. The optical power of beam on cornea was 700 mW which is less than the ANSI exposure limit. Optical isolator was used to prevent re-incident light from entering source. Polarization controllers were used after SLD and before reference and sample arm. A transparent diffractive grating of 1200 lines/mm was used to separate the wavelengths of coherent light in the spectrometer. The scanning rate of the CCD (Basler, L103k- 2k) camera was 18.7 kHz and the exposure time of each A-line was 53.3 µs. The measured sensitivity of this system was 99.3 dB at a 100 µm depth and 92.9 dB at a 2 mm depth. The measured axial resolution was 8.8 µm in air which corresponds to 6.4 µm in tissue where refractive index is assumed to be 1.38. PC PC
SLD λ = 840 nm ∆λ = 50 nm
Isolator M
80/20
PC
Sample
Figure 1. The schematic of used OCT system, SLD super luminescent diode, PC polarization controller, G gratings, M mirror.
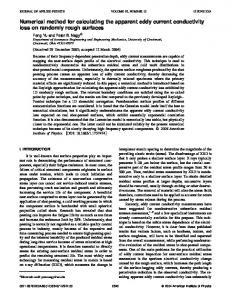
2.2 Data Processing The whole data processing is briefly described here with detailed description of retinal shadow compensation. First the retina and choroid is separated by identifying RPE layer from measured 3D OCT data. The segmented choroid is then flattened to RPE and the OCT signal decay in a single depth becomes nearly constant. That enables to use intensity thresholding-based binarization (ITB) to segment choroidal vessels. Detailed description of that process can be found from article published by Hong et al .13 A new retinal shadow compensation method is used before choroidal vessel segmentation. The idea of that method was coming from observation that there is a real signal beneath the retinal vessel. Only the intensity of that signal is decreased by the absoption of retinal vessels. By compensating that absorption numerically, the artifact of retinal shadows can be reduced from choroidal vasculature images. To identify the position and width of retinal shadows, the projection image of retinal vessels is calculated from RPE complex area by adding those en-face slices together and binarizing that image by using automatic ITB. That retinal vessel mask is used to identify all those A-scans that are beneath the retinal vessels. One representative B-scan is selected and the
Proc. of SPIE Vol. 6847 68472A-2
A-scans with and without the effect of extinction is separated by using the retinal vessel mask as shown in Fig.2. The averaged A-scans beneath retinal vessels and A-scans surrounded by them are calculated and the effect of extinction is estimated by subtracting those averaged A-scans. By adding the obtained offset value to all A-scans beneath the retinal vessels, the retinal shadows in the choroid are removed. The procedure to compensate retinal shadows is illustrated in Fig 2. C a lcu la tio n th e e ffe ct o f a b so rp tio n
Id e n tifica tio n o f R P E
S
B in a riza tio n
O ffse t
A d d in g o ffse t to A -sca n s b e n e a th th e re tin a l ve sse ls
Fla tte n in g to R P E
P ro je ctio n o f re tin a P ro je ctio n o f ch o ro id
R e tin a l sh a d o ws
Figure 2. The procedure of retinal shadow compensation.
After retinal shadow compensation, the segmentation of choroidal vessels is performed. Vessel segmentation algorithm operates on each en-face slice of the OCT volume at constant depths from RPE. The automatic ITB is performed for each slice belonging choroid and the 3D mask of segmented choroidal vessels is obtained. By multiplying that mask with intensity inverted OCT volume data, the high contrast 3D volume of choroidal vessels is acquired. En face projection images of choroidal vessels are made by adding all slice from choroid together.
3. RESULTS AND DISCUSSION In vivo three dimensional measurement of healthy human eye has been performed. Optic nerve head (ONH) area of retina is imaged with 1024 A-scans per frame and 138 frames. The acquired data covers about 5 mm x 5 mm area. The obtained projection images of retinal and choroidal vasculatures are shown in Fig. 3. The en-face projection image of retinal vessels are calculated from RPE and the resulting image is shown in Fig. 3 (A). The choroidal en-face projection image without retinal shadow compensation is shown in Fig. 3. (B) and corresponding image with shadow compensation in Fig. 3. (C). If the shadow compensation method is used the visibility of choroidal vessels is better than without compensation. Some choroidal vessel structures beneath the retinal vessels can be seen in image (C). The macular imaging of same patient with similar settings was also performed. The resulting en face projection images of retinal vasculature is shown in Fig. 4 (A) and the corresponding projection images of choroidal vessels with and without retinal shadow compensation are shown in Fig. 4 (B) and (C) respectively. The retinal compensation improves well in that case also and improves image quality as in ONH area. Although the shadow compensation algorithm seems to work very well also some small compensation errors occurs. One reason for those errors is coming from the segmentation errors of retinal vessels. This means that shadow compensation is performed for some A-scans that are not actually affected by retinal shadows. An other explanation for compensation errors is the fact that the offset vector which is used for compensation is calculated from one single B-scan but it is used globally for compensation. However, the attenuation beneath the retinal vessels is not uniform and thus the some small compensation errors can be seen in Figures 3 and 4. As we mentioned earlier, the absorption of retinal vessels decreases the obtained intensity of OCT signal beneath them. When the ITB method is used to segment choroidal vessels, the pixels beneath the retinal vessels distort the calculated threshold value decreasing the efficiency of used choroidal vessel segmentation method. The Retinal
Proc. of SPIE Vol. 6847 68472A-3
(A)
(B)
(C)
Figure 3. S-OCA images from optic nerve head (ONH); (A) projection image of retinal vessels, (B) choroidal vessel without retinal shadow compensation, (C) choroidal vessels with compensation
(A)
(B)
(C)
Figure 4. S-OCA images from macula; (A) projection image of retinal vessels, (B) choroidal vessel without retinal shadow compensation, (C) choroidal vessels with compensation
shadow compensation removes that problem and thus the compensation improves also the visibility of choroidal vessels. One advantage of SOCA is that the depth position of vessels can be determined from the measured data. To illustrate that feature of SOCA the en-face slice images of ONH area from different depths are shown in Fig. 5. The first image of both sequences is from RPE and the following images are sliced every 49 µm relative to RPE. To evaluate the effect of retinal shadow compensation on image quality, the en face images with (A) and without (B) compensation are shown. The first en-face images in the Fig. 5 is from flattened RPE. By comparing the first images of rows A and B the effect of retinal shadow compensation can be seen clearly. There is not detectable vessels in the RPE. If the compensation is not used, the retinal shadows cause artifacts that are segmented to be vessel erroneously as seen in the first slice of row (B). The en-face slice images from the 49 µm belove the RPE suggest that some information about the choriocapillary layer structure which contains many small blood vessels and pigment cells can be obtained.14 However, due to the resolution limitations of OCT, the detailed investigation of the blood vessels of choriocapillary layer is very challenging task. By taking the en-face slice images from 98 µm and 137 µm belove the RPE, the inverse intensity of OCT signal around the optic disc area is reduced. This indicates that the thickness of choroidal vessels are smaller as they are closer the optic disc. In addition, the determination of the depth position of vessels also possible from that data. In many cases, the en-face projection images are sufficient for medical doctors to make diagnose because they are familiar with FA and ICGA which provide only two dimensional images. However, 3D visualization
Proc. of SPIE Vol. 6847 68472A-4
(Α)
(Β)
0 µm
49 µm
98 µm
147 µm
196 µm
Figure 5. En face slice images of ONH area. Images on the row (A) are obtained as retinal shadow compensation is used and the images on the row (B) without compensation. The first image of both sequences is from RPE and the following images are sliced every 49 µm relative to RPE.
of choroidal vessels makes easier to understand intuitively the anatomical details of choroidal vessels. Fig. 6 shows a 3D reconstruction of choroidal vessels from ONH. The volume (A) is obtained without retinal shadow compenstion and (B) is with shadow compensation.
it (A)
(B)
Figure 6. 3D volume rendering images of choroidal vessels from ONH. (A) Without shadow compensation and (B) with shadow compensation.
When the 3D segmentation of choroidal vasculatures is performed, the binarization threshold is calculated to identify the pixels that belongs to choroidal vessels. If the retinal shadow compensation is not performed, the calculated intensity threshold is distorted and thus some choroidal vessels with poor contrast are segmented out. Thus the 3D volume rendering (A) in Fig. 6. seems to have less vessels than image (B). The presented method was primary developed for SOCA to remove retinal shadows from en face projection images. However, if we compare the flattened cross sectional images before and after the shadow compensation in Fig. 2, the improvement of image quality is obvious if compensation is performed. This suggests that the method can be used also for restoring the cross sectional images obtained by OCT.
Proc. of SPIE Vol. 6847 68472A-5
The retinal shadow compensation method is rather simple and it is not that expensive for calculation time. The compensation for measured volume takes about 10 s as normal personal computer (CPU 2.4 GHz, 2.93 GB RAM) is used for calculation. Although the shadow compensation process itself is very simple, it requires rather exact RPE identification to work properly. Especially in the ONH area the segmentation errors beneath the optic disc yields to incorrect retinal shadow compensation and choroidal vessel segmentation. In Fig. 3. for example, the vessel structures beneath the optic disc are not real choroidal vessels but those artifacts are coming from the shadows of retinal vessels. In fact, there is not choroid under the optic disc at all. Thus the segmentation of optic disc area is needed. In this paper, the shadow compensation is performed for OCT images that are obtained by using conventional 840 nm probing band. However, some longer wavelength OCT systems for opthalmic imaging has reported.15, 16 One very interesting alternative for retinal opthalmic imaging is the 1-µm OCT because the water absorption has a local minimum at 1.06 µm region. That allows deeper imaging depth than 840 nm OCT providing the information even from sclera.15 Other important feature of that wavelength band is that zero dispersion of water exist around that region. Because the optical properties of vessels and blood are wavelength dependent the appearance of retinal shadows will be different if 1-µm OCT is utilized for imaging. However, the retinal shadows are still existing. Thus the presented method will be applicable as the longer probing wavelengths are used.
4. CONCLUSION Numerical method for compensating the effect of absorption of retinal vessels in choroid is presented. By using this simple method, readability of choroidal vessel images can be improved significantly. Retinal shadow compensation increases also the efficiency of choroidal vessel segmentation process and increases visibility and contrast of choroidal vessels.
REFERENCES 1. J. Flammer, S. Orgul, V. P. Costa, N. Orzalesi, G. K. Krieglstein, L. M. Serra, J.-P. Renard, and E. Stefansson, “The impact of ocular blood flow in glaucoma,” Prog. Retin. Eye Res. 21 359–393 (2002). 2. E. Fridman, “A hemodynamic model of the pathogenesis of age-related macular degeneration,” Am. J. Ophthalmol 124 677–682 (1997). 3. V. Patel, S. Rassam, R. Newsom, J. Wiek and E Kohner, “Retinal blood flow in diabetic retinopathy,” BMJ 305, 678-683 (1992). 4. L. A. Yannuzzi, K. T. Rohrer, L. J. Tindel, R. S. Sobel, M. A. Costanza, W. Shields, and E. Zang, “Fluorescein angiography complication survey,” Ophthalmology 93, 611-617 (1986). 5. M. Hope-Ross, L. A. Yannuzzi, E. S. Gragoudas, D. R. Guyer, J. S. Slakter, J. A. Sorenson, S. Krupsky, D. A. Orlock, and C. A. Puliafito, “Adverse reactions due to indocyanine green,” Ophthalmology 101, 529-533 (1994). 6. S. Makita, Y. J. Hong, M. Yamanari, T. Yatagai, and Y. Yasuno, “Optical coherence angiography,” Opt. Express 17 7821–7840 (2006). 7. D. Huang, E. A. Swanson, W. G. S. C. P. Lin, J. S. Schuman, W. Chang, T. F. M. R. Hee, K. Gregory, C. A. Puliafito, and J. G. Fujimoto, “Optical coherence tomography,” Science 254, 1178-1181 (1991) 8. G. Husler and M. W. Lindner, “Coherence rader and spectral radar New tools for dermatological diagnosis,” J. Biomed. Opt. 3, 21–31 (1998). 9. A. F. Fercher, C. K. Hitzenberger, G. Kamp, and S. Y. El-Zaiat, “Measurement of intraocular distances by backscattering spectral interferometry,” Opt. Commun. 117, 43-48 (1995). 10. S. Yazdanfar, A. M. Rollins, and J. A. Izatt, “In vivo imaging of human retinal flow dynamics by color Doppler optical coherence tomography,” Arch. Ophthalmol. 121, 235-239 (2003). 11. R. A. Leitgeb, L. Schmetterer, W. Drexler, A. F. Fercher, R. J. Zawadzki, and T. Bajraszewski, “Real-time assessment of retinal blood flow with ultrafast acquisition by color Doppler Fourier domain optical coherence tomography,” Opt. Exp. 11, 3116-3121 (2003).
Proc. of SPIE Vol. 6847 68472A-6
12. B. R. White, M. C. Pierce, N. Nassif, B. Cense, B. H. Park, G. J. Tearney, B. E. Bouma, T. C. Chen, and J. F. de Boer, “In vivo dynamic human retinal blood flow imaging using ultrahigh-speed spectral domain optical coherence tomography,” Opt. Exp. 11, 3490-3497 (2003). 13. Y. Hong, S. Makita, M. Yamanari, M. Miura, S. Kim, T. Yatagai, and Y. Yasuno “Three-dimensional visualization of choroidal vessels by using standard and ultra-high resolution scattering optical coherence angiography,” Opt. Express 15 7538–7550 (2007). 14. E. C. Lee, J. F. de Boer, M. Mujat, H. Lim, and S. H. Yun “In vivo optical frequency domain imaging of human retina and choroid,” Opt. Express 14 4403–4411 (2006). 15. Y. Yasuno, V. D. Madjarova, S. Makita, M. Akiba, A. Morosawa, C. Chong, T. Sakai, K. -P. Chan, M. Itoh, and T. Yatagai “Three-dimensional and high-speed swept-source optical coherence tomography for in vivo investigation of human anterior eye segments,” Opt. Express 13 10652–10664 (2005). 16. A. Unterhuber, B. Povazay, B. Hermann, H. Sattmann, A. Chavez-Pirson, and W. Drexler “In vivo retinal optical coherence tomography at 1040 nm-enhanced penetration into the choroid,” Opt. Express 13 3252–3258 (2005).
Proc. of SPIE Vol. 6847 68472A-7