533 Revista Brasileira de Engenharia Agrícola e Ambiental, v.7, n.3, p.533-538, 2003 Campina Grande, PB, DEAg/UFCG - http://www.agriambi.com.br
Numerical simulation of fecal coliform reduction at a constructed wetland Mariângela Amendola1, Anderson L. de Souza2 & Denis M. Roston3 College of Agricultural Engineering, The State University of Campinas. CP 6011, CEP: 13083-970, Campinas, SP. Fone: (19) 3788-1065, Telefax: (19) 3788-1010. E-mail:
[email protected] (Foto) 2 College of Agricultural Engineering, The State University of Campinas. E-mail:
[email protected] 3 College of Agricultural Engineering, The State University of Campinas. E-mail:
[email protected] 1
Protocolo 190 - 11/12/2002
-
Aprovado em 22/10/2003
Abstract: The aim of this research was to use experimental planning to collect data and also to establish a methodology to compare them with theoretical data, where both are associated to the dynamics of reduction in pollutants in a natural treatment system for wastewater. The experimental data were collected and evaluated from two of these systems, built according to Valentim & Amendola (1999) and Collaço (2001), at the Center of Mechanization and Agricultural Automation of the Agricultural Institute of Campinas, located in Jundiaí, SP, Brazil. These systems were rectangular in shape; one with crushed stone and another with chopped tires used as support bed to hold the plants, both with macrophyte species Typha sp. The theoretical data were obtained from a mathematical model, adapted to describe the physical process of subsurface flow. The numerical simulations using the implicit finite difference numerical method were carried out using MATLAB 6.1 software. The results of the comparative analysis between theoretical and experimental data are presented for the two types of support beds. Some coefficients and parameters were adjusted to characterize the constructed systems. The results obtained were analyzed and some conclusions about the physical process as well as those about the adequacy of the mathematical model were made. Key words: numerical simulation, pollutant-reduction, constructed wetland
Simulação numérica da redução de coliformes fecais em terras úmidas construídas Resumo: Objetivou-se, através desta pesquisa, usar um planejamento experimental para a coleta de dados e uma metodologia para compará-los com dados teóricos, ambos associados à dinâmica de redução de poluentes em sistemas naturais de tratamento de esgotos. Os dados experimentais foram coletados e avaliados para dois tipos de sistemas construídos de acordo com Valentim & Amendola (1999) e Collaço (2001), no Centro de Mecanização e Automação Agrícola do Instituto Agronômico de Campinas, localizado em Jundiaí, SP, Brasil. Esses sistemas têm forma retangular, um com brita e outro com pneus picados, como leito suporte para fixar as plantas, ambos cultivados com a macrófita Typha sp. Os dados teóricos foram obtidos a partir do modelo matemático, adaptado para descrever o processo físico de escoamento subsuperficial. A simulação numérica em que se empregou o método numérico de diferenças finitas, foi realizada com o pacote de computação científica MATLAB 6.1. Os resultados da análise comparativa entre os dados teóricos e experimentais são apresentados para os dois tipos de leito suporte. Alguns coeficientes e parâmetros foram ajustados para caracterizar os sistemas construídos. Os resultados obtidos foram analisados e algumas conclusões sobre o processo físico e sobre a adequação do modelo matemático foram enumeradas. Palavras-chave: simulação numérica, redução de poluentes, leitos cultivados
INTRODUCTION Considering all natural resources essential to life, water is one of the most degraded by human mistreatment. According to Agenda 21 (1996) the objective of which is to define sustainable development strategies in Brazil, it is estimated that 80% of all diseases and over a third of the deaths
in developing countries are caused by the ingestion of contaminated water and, on an average, up to a tenth of the worker’s productive time is wasted due to the water conditions. These estimates show the importance of research, suggesting technological alternatives to assure the sustainable use of water. One technology that can be developed in this direction is the search for sewage treatment. Brazil in relation to this aspect
534
M. Amendola et al.
greatly lacks solutions, mainly in small communities. Natural treatment systems (Metcalf & Eddy, 1991) appear to be a feasible alternative to help revert the Brazilian sewage treatment situation by congregating desirable characteristics such as low cost, construction, maintenance and operation simplicity, and efficiency. Among several natural sewage treatment systems, the one that appears attractive is the constructed wetland, which can be built taking into account different types of components such as the support bed and the kind of vegetation (Valentim, 1999). Therefore, the performance of constructed wetlands in sewage treatment depends on multiple factors such as inflow composition characteristics; the potential for each component to retain pollutants; and environmental factors such as light and temperature among others. Apart from that, macrophytes play a fundamental role in the system. Because of its important environmental impact, several researchers have been dedicating efforts towards this subject, mainly in the United States, Europe, Australia and South Africa, where the use of constructed wetlands is largely adopted (Wood & McAtamney, 1996). In order to have this system adequately implanted in Brazil, more studies related to chemical, physical and biological processes involved in the system are needed. This can be done either through experimental studies - that have undergone large scale trials in several research units all over the world and also at the College of Agricultural Engineering at the State University of Campinas, FEAGRI/UNICAMP - or by theoretical studies, using mathematical modeling and numerical simulation. In this theoretical case, it is necessary to follow an established statistical design for the collection of experimental data which, as observed by Neto et al. (1995) has not been a common practice. This last alternative establishes the aim of this research: to use experimental planning to collect data and also a methodology to compare them with theoretical data, where both are associated to the dynamics of reduction in pollutants in a natural treatment system for wastewater.
MATERIAL AND METHODS This trial was carried out at the Center of Mechanization and Agricultural Automation (CMAA) of the Agricultural Institute of Campinas (IAC), located in Jundiaí, SP, Brazil. This Center has a Conventional Sewage Treatment Station (ETE), designed to treat the sewage volume generated locally at the CMAA. Part of the effluent of this ETE was used as previous treatment for the affluent of the constructed wetland, so as to avoid a large volume of solids entering the system. To implement this system, two constructed wetlands were built, each one measuring 5 m in length, 2 m in width and 0.9 m in height, above the level of the soil, in concrete blocks of 0.2 x 0.4 m, over a reinforced concrete base. Both were covered internally with water resistant masonry. One of them, called LC1, was completely filled with #3 crushed stone (55 to 90 mm R. Bras. Eng. Agríc. Ambiental, Campina Grande, v.7, n.3, p.533-538, 2003
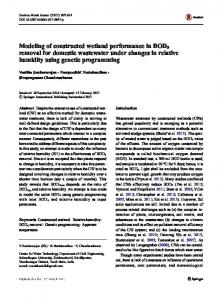
in diameter), and the other, called LC2, was filled with chopped tires up to approximately 0.80 m in height and the rest with #3 crushed stone. Tractor tires, as well as car tires were used, all of them chopped using a Satren brand machine, adjusted to a screen of 0.1524 m mesh. In both cases Typha sp was planted, and it was selected for being abundant and well adapted to the region, as observed by Valentim & Amendola (1999). Figure 1 shows the constructed wetland system.
Figure 1. The constructed wetland system This constructed wetland system is based on a subsurface flow to avoid contamination of people and animals, besides hampering the infestation of mosquitoes for instance, Aedes aegypti. The volume of sewage that flows through the constructed wetland Q [L d-1] had to be calculated. To be able to do so, it was necessary to establish a hydraulic detention, and, if assumed to be two days old, this would be understood as the corresponding volume for the two systems. The empty volume needed to be calculated. In this trial, the corresponding values of Q were 1.969 and 2.602 L d-1, for LC1 and LC2, respectively. In order to investigate the hypothesis that the efficiency in removing the pollutants, for a certain detention time assumed as 2 days at LC1, was equal to the one at LC2, a randomized data collection was adopted as suggested by Vieira & Hoffmann (1989). The ideal situation was that the study should be carried out for a longer period; however, because of funding problems, the trial was operated for only ten weeks. Every Monday, around 5:00PM, samples of the inflow and outflow were collected in 250 mL glass bottles and analyzed by the Waste Management Laboratory at FEAGRI/UNICAMP. The fecal coliform (FC) concentration determination was carried out according to the chromogenic substrate coliform test, approved by the Standard Methods Committee in 1994 (Franson, 1996). Water temperature was also recorded at the same time. Climatic conditions such as barometric pressure, dry bulb temperature and relative humidity were also recorded at a meteorological station near the CMAA. Some researchers have used mathematical modeling to study this kind of system, but in general they do this in a
Numerical simulation of fecal coliform reduction at a constructed wetland
535
C in = C(i∆x, n∆t )
(4)
different way from that described in Moreno et al. (1996), in terms of the diffusion-advection equation. The mathematical model used here is the same as that in Moreno et al. (1996), which was adapted in Valentim & Amendola (1999) and Amendola & Ladeira (2000), based on the following equation:
∂C ∂C ∂C ∂ + = Dx −u ∂x ∂x ∂t ∂x
∑r
z
z =1
t ≥ 0 and x in (0,CL)
(1)
- polluting concentration, NMP 100 mL-1 - time, day - longitudinal direction, m - average speed in the x direction, m d-1 - term describing each one of the physical, chemical or biochemical processes responsible for modifying the polluting concentration, NMP 100 mL-1 d-1 np - total number of processes; CL - length of the constructed wetland, m Dx - longitudinal dispersion coefficient, m2 day-1
In Eq. (1), the first term on the right side represents the polluting diffusion process while the second term represents the polluting advection process due to u = Q m-2, and the third term is all the phenomena responsible for the polluting concentration variation along time and space. The longitudinal dispersion coefficient Dx can be described as: Dx = 3.134 K N u d 6/5
(2)
Thus, Eq. (1) can be rewritten as: np
∑r
z
t ≥ 0 and x in (0,Cl)
Dx∆t u∆t n+1 + 1 + 2 2 + Ci + ∆x ∆x Dx∆t n+1 n n + − Ci+1 = Ci − k cf ∆tCi 2 ∆x where: i Nx n Nt
(5)
- 1, ...Nx - number of spatial determinations - 0, ...Nt - number of time determinations
The initial condition was taken as: C(i,0 ) = 5x10⁵ for i = 1,... Nx
(6)
and the boundary conditions were taken as: C(1,n) = 5x10⁵ , for n = 0,... Nt
(7)
C(2CL,n) = 0, for n = 0, ...Nt
(8)
This strategy of analyzing 2CL was considered in order to avoid the mathematical boundary condition effect and the number 5x10⁵ was taken based on experimental data. Having established the association of the initial and boundary conditions, Eqs. (5), (6), (7) and (8) become a tridiagonal linear system that must be solved for Cin, everywhere in (0, CL) and for every time. The numerical solution was reached using software developed so as to be used with MATLAB 6.1
- dispersion constant - Manning coefficient - average speed in x direction, m d-1 - depth of the constructed wetland, m
∂ 2C ∂C ∂C = Dx 2 − u + ∂t ∂x ∂x
Dx∆t u∆t n+1 − 2 + Ci−1 + ∆x ∆x
np
where: C t x u rz
where: K N u d
and using the implicit method of finite differences, Eq. (3) can be rearranged for C as:
(3)
z =1
As observed by Amendola & Ladeira (2000), when using this specific mathematical model of Moreno et al. (1996), something must be done in order to identify the effective contributions of the support bed, the species of macrophyte, the shape and/or other characteristics of the constructed wetlands. For the case studied, where C is the fecal coliform concentration, z = 1 and r1 = - kcf C, where kcf = 4.0[L d-1] and N=0.025 based on Moreno et al. (1996). Thus, the only factor that can be investigated in order to characterize the system built is the value of K for LC1 and LC2. After the statement of ∆x and ∆t, the following convention is adopted:
RESULTS AND DISCUSSION In Figures 2 (A, B and C) below, the experimental data of fecal coliform concentration, collected weekly are shown, as described before, where AFC (NMP 100 mL-1) is for the inflow and BCF (NMP 100 mL-1) and PCF (NMP 100 mL-1) are the outflow at the end of LC1 and LC2, respectively. These results appear to be continuous, in order to help the interpretation of the system. Table 1 shows the average value, standard deviation and variation coefficient of the FC inflow and of the LC1 and LC2 outflow. As can be observed in the Figure 2 and also in Table 1, the FC inflow and outflow are not controlled and so they do R. Bras. Eng. Agríc. Ambiental, Campina Grande, v.7, n.3, p.533-538, 2003
536
M. Amendola et al.
A.
not show any standard behavior that could be simulated in a proper mathematical way. Fortunately, the magnitudes of FC show some idea towards the investigation carried out here, since all of them are 105, 103 and 104 for the inflow and for the outflow in LC1 and LC2, respectively. This assures that LC1 is more efficient than LC2. Based on these results, the mathematical model for the numerical simulation of the FC reduction process as a way of finding the proper value of K, one for each LC1 and LC2, as decided before was used. The process started using K = 500 as appears in Moreno et al. (1996) and a type of theoretical test
6
AFC 105 (NMP 100 mL-1)
5
4
3
2
1
A. 4 .5 K b =2 0 0
0
1
1 .5
2
2 .5
3
3 .5
4
4 .5
5
5 .5
FC 105 (NMP 100 mL-1)
B. 0 .08
0 .07
BFC 105 (NMP 100 mL-1)
4
6
0 .06
0 .05
0 .04
3 .5
3
2 .5
2
1 .5
1
0 .5
0 .03 0
0 .02
1
2
3
4
5
6
7
8
9
10
6
7
8
9
10
6
7
8
9
10
B. 4 .5 K b =1 0 0
0 .01
0
1
1 .5
2
2 .5
3
3 .5
4
4 .5
5
5 .5
6
C. 0 .35
PFC 105 (NMP 100 mL-1)
0 .3
0 .25
0 .2
FC 105 (NMP 100 mL-1)
4
3 .5
3
2 .5
2
1 .5
1
0 .5
0 .15 0
1
2
3
4
5
C.
0 .1
4 K b =5 0
0 .05
1
1 .5
2
2 .5
3
3 .5
4
4 .5
5
5 .5
6
Time (week)
Figure 2. Polluting concentration at the inflow (A) outflow of the LC1 (B) and LC2 (C) system as a function of the time (week) Table 1. Average value, standard deviation and variation coefficient of the fecal coliforms (FC) concentration in the inflow and the LC1 and LC2 outflow FC Concentration Mean value Standard deviation Variation coefficient
Inflow 155368.33 220845.50 142.10
FC 105 (NMP 100 mL-1)
0
3 .5
3
2 .5
2
1 .5
1
0 .5
Outflow LC1 6245.0 10605.6 169.8
R. Bras. Eng. Agríc. Ambiental, Campina Grande, v.7, n.3, p.533-538, 2003
LC2 3115.0 2572.2 82.6
0
1
2
3
4
5
x (m)
Figure 3. LC1 polluting concentration [NMP 100 mL-1] numerically simulated with Kb = 200 (A), 100 (B) and 50 (C)
Germinação e formação de porta-enxerto de aceroleira sob níveis de salinidade da água
was carried out until the same magnitude of the final experimental data of LC1 and LC2, which appears in Figure 2B and C respectively, was reached at the end of 2 days and at the actual length of the constructed wetland CL (5 m). Figure 3 (A, B and C) show some of the results for LC1 and Figure 4 (A, B and C) for LC2, both for values of K from 200 to 50, since larger and lesser values than these were not satisfactory. As can be seen, the best value of Kp for LC1 is around 100, while for LC2 it is around 50. Some investigation, using more accurate values, can be carried out based on residual analysis. A. 4 .5
537
CONCLUSIONS 1. It was possible to observe some advances in the mathematical interpretation of the sewage treatment system, specially regarding the discussion about the efficiency of the support bed used. The complete understanding of this subject requires deeper studies in several research areas, for instance, Experimental Statistics Methodology and Applied Mathematics, besides the area of Waste Treatment. 2. In this study, the investigation on the effect of the support bed could not be done in a proper way, but to reach a more precise value, this must be done based on residual analysis.
K p =2 0 0
ACKNOWLEDGEMENTS
FC 105 (NMP 100 mL-1)
4
3 .5
The authors would like to acknowledge Doctor Irenilza de Alencar Nããs, for the encouragement; and also FAEP for the financial support for the presentation of results in Italian Congress of Computation Mechanics.
3
2 .5
2
1 .5
LITERATURE CITED 1
0 .5
0
1
2
3
4
5
6
7
8
9
10
6
7
8
9
10
6
7
8
9
10
B. 4 .5 K p =1 0 0
FC 105 (NMP 100 mL-1)
4
3 .5
3
2 .5
2
1 .5
1
0 .5
0
1
2
3
4
5
C. 4 .5 K p =5 0
FC 105 (NMP 100 mL-1)
4
3 .5
3
2 .5
2
1 .5
1
0 .5
0
1
2
3
4
5
x (m)
Figure 4. LC2 polluting concentration [NMP 100 mL-1] numerically simulated with Kp = 200 (A), 100 (B) and 50 (C)
Agenda 21. Protection of the quality and supply of hydric resources: application of integrated criteria in the development, handling and use of hydric resources. Rio de Janeiro, 1996. Available at: http://www.agenda21.org.br/full/ hidricos-full.htm >. Access in 2002, 3. Amendola, M.; Ladeira, S.S. Numerical simulation of the total coliform reduction process in constructed wetlands cultivated with macrophytes. In: National Congress on Applied and Computational Mathematics, 23, 2000, Santos. Resumos. p.89. Amendola, M.; Souza, A.L. Mathematical modelling and numerical simulation of the pollutants reduction at constructed wetland. In: Italian Congress of Computational Mechanics, 14, and Ibero Latin American Congress on Computational Methods for Engineering, 23-CILAMCE 2002, Giulianova-Italy, 24 a 26 de June, 2002 Collaço A.B. Evaluation of the use of chopped tires as support medium in constructed wetlands for the treatment of sewage. FEAGRI- College of Agricultural Engineering. Campinas: UNICAMP, 2001. Master’s Dissertation Franson, M.A.H. Standard methods for the examination of water and wastewater. 19.ed. Washington D.C., 1996. Metcalf & Eddy. Wastewater engineering: treatment, disposal and reuse. 3.ed. McGraw-Hill Inc, 1991. 1334p. Moreno-Grau S. A mathematical model for wastewater stabilization ponds with macrophytes and microphytes. In: Ecological modelling, v.91, p.77-103, 1996. Neto B.B.; Scarminio, I.S.; Bruns, R.E. Planning and optimizing experiments. 2. ed. Campinas: UNICAMP. 1995. 299p. Valentim, M.A.A. The use of constructed wetlands in the treatment of effluent from a modified septic tank. Campinas: FEAGRI-UNICAMP. 1999.119p. Master’s Dissertation R. Bras. Eng. Agríc. Ambiental, Campina Grande, v.7, n.3, p.533-538, 2003
538
M. Amendola et al.
Valentim, M.A.A.; Amendola, M. Numerical simulation of the dynamics of E. coli reduction in constructed wetlands: A case study. In: Iberian-Latin American Congress on Computational Methods in Engineering, 20, 1999. São Paulo. Proceedings (CDROM).
R. Bras. Eng. Agríc. Ambiental, Campina Grande, v.7, n.3, p.533-538, 2003
Vieira S.; Hoffmann R. Estatística experimental. 1. ed. São Paulo. Atlas. 1989. 179p. Wood R.B.; McAtamney, C.F. Constructed wetlands for wastewater treatment: the use of laterite in the bed medium in phosphorus and heavy metal removal. Hidrobiologia, Belgium, v.340, p.323-331, 1996.