stabilization ponds treatment in Northern Greece. Gratziou M.K., Chalatsi M. E.. Laboratory of Hydraulics, Department of Civil Engineering, School of ...
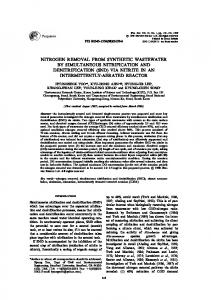
Nutrient removal from domestic wastewater by stabilization ponds treatment in Northern Greece Gratziou M.K., Chalatsi M. E. Laboratory of Hydraulics, Department of Civil Engineering, School of Engineering, Democritus University of Thrace, 67100, Xanthi. Abstract The paper presents the effectiveness of tree waste stabilization pond (WSP) systems, operating in Northern Greece, on nutrient removal. The systems treat only domestic wastewater and consist of one facultative pond, one or two maturation ponds and a rock filter before the final discharge for algae filtration. Significant differences have been noticed among the three systems concerning their concentrations, as well as their efficiencies. During the estimation of mass efficiency, it has been observed that in most cases, mass efficiencies were almost identical to the concentration efficiencies. Yet, this was not the case during summer months, when there was a drop in mass efficiencies. The three systems were recorder to operate smoothly during the study. Moreover, the correlations between influent – effluent mass were satisfactory. The correlations between nutrient removal, pH, temperature, BOD5, HRT, ponds’ surface and area, were investigated. Keywords: Wastewater, stabilization pond, nutrient removal, nutrient mass efficiency 1.
INTRODUCTION
Waste stabilization ponds (WSPs) are an inexpensive method to achieve good pathogen and organic pollutant removal [1]. However, for nutrient removal, such as nitrogen and phosphorous, they have not been very effective. In fact, most operating ponds and wetlands remove little phosphorus and there is no established method for designing ponds for phosphorus removal [2]. Phosphorus removal from municipal wastewater via stabilization ponds is often poor, ranged among 15-50% [3], [4], [5], [6], [7]. Therefore, a need occurs for appropriate low-cost technology in order to upgrade small wastewater treatment systems in nutrient removing one. Strang and Wareham [8] suggest the interpolation of a limestone rock-filter before the final maturation pond to remove phosphorous (P) up to 77.8%, while Camargo Valero et al [9] propose the addition of a horizontal flow blast furnace slag filter (BFS) to remove P up to 75 - 99.8%. Nevertheless, integrating duckweed in wastewater stabilization ponds along with improving flow patterns could possibily optimize nitrogen removal [10]. Several researches have been conducted in the international literature, suggesting that nitrogen and phosphorus removal mechanisms and pathways differ spatially and temporally on a global level. It is also commonly known that seasonality plays a significant role in nitrogen cycling within WSPs - affecting ammoniac nitrogen removal in particular [11]. The principal and most widely accepted basis for ammonia removal within WSPs has been attributed to the volatilization of ammonia [11], [12], microbial uptake and assimilation [13] and the subsequent sedimentation and deposition into the sludge layer [10], [11], [14]. The nitrification and denitrification mechanisms
have been also observed to significantly contribute to the removal of nitrogen within WSPs [10], [11]. Since there are no mechanisms to completely remove phosphorrus from a pond or wetland system, any phosphorus removed from the water column has to be stored somewhere [8]. Thus, the mechanisms for phosphorus removing, from the water column, include chemical precipitation, adsorption to the substratum and biomass (i.e. algae) assimilation. These removal mechanisms may be dependent upon the form of phosphorus (i.e. ortho-P, poly-P or organic P) [10]. Many researchers, in various case studies, provide information about nutrient removal by WSPs in different climatic conditions [10],[15], [16], [17], [18], [19]. In Greece, the use of WSP systems and the research on them is limited; information found in the international literature does not always conform to Greek data, as there are different climatic conditions and living standards, affecting the quality and quantity of produced wastewater. The research reported herein was held in northern Greece. Three full–scale WSP systems, consisting of facultative and maturation ponds in series, treating municipal wastewater were monitored for approximately three years. The systems are located in a lowland area in the mainland of northern Greece. Nitrogen and phosphorus removal were estimated. Moreover, the correlations between influent – effluent mass were determined and equations were performed, correlating the pollutants’ effluent concentrations Ce with the influent concentrations Ci. In addition, the correlations between nutrient removal and other parameters, such as pH, temperature, BOD5, HRT, ponds’ surface and area, were investigated. 2. MATERIALS AND METHODS All three systems are established in a lowland area in the mainland of northern Greece in a Mediterranean climate. They treat exclusively domestic wastewater and consist of one facultative pond, one (N. Skopos) or two (Vamvakofito, Charopo) maturation ponds and a limestone rock filter before the final discharge for algae filtration. The bottom and the walls of the ponds are insulated with compacted clay, in order to avoid losses and leaks in the subsoil. Wastewater discharge takes place through an open channel of 0.75 m2 vertical section, from the upper 0.40 m of the last pond, with the assistance of gravity. Every system has different characteristics (Table 1). Operation of Vamvakofito WSP system began in 1989, of N. Skopos in 1980 and of Charopo in 1994. The systems have been monitored for approximately three years. The average annual temperature is 15.2 °C the mean peak temperature is 26.3 °C and the mean lower one is 3.9 °C in January. The absolute maximum temperature and the lowest rainfalls have observed In July [20]. Table 1. WSP systems: dimensions, HRT and loading rates (Current situation) WSP system Inflow (m3/d) HRT (d) Depth (m) Area (m2) Volume (m3) m3 /e.p. m2 /e.p.
Vamvakofito (V) 121 68.7
Ν. Skopos (N. S.) 152 18.6
Charopo (Ch) 137 72.4
F : 1.00-2.40 M: 0.75-1.50
F : 0.75-2.40 M: 0.70-1.50
F : 0.80-2.40
6016 8311 8.9 6.5
2112 2827 2.4 1.8
M: 0.70-1.50 7415 9921 9.4 7.0
To determinate the TN, N-NH4+, N-NO− 3 , TP, BOD5 and DO concentrations for each system, instantaneous samples were taken from the inflow of the 1st pond and the outflow of the last pond, during the years 2006, 2007 and 2012, at least twice a month [21]. The samples were collected approximately during the same morning period, when meteorological data were recorded. The inflow and outflow rates were measured with handheld electromagnetic flow meter, with the assumption that wastewater supply was constant during the day. In parallel, pH values were also measured by potentiometric method. Daily meteorological data were obtained from the National Meteorological Service (NMS). The water temperature was recorded in situ, during the days of sampling. The outflow data were corrected with the mass balance method in order to eliminate errors from atmospheric precipitation and evapotranspiration, since many researchers believe that the mass balance is the most authoritative method to approach mechanisms and parameters that determine the performance of natural systems and the subsequent changes occurring in them [22], [23], [24]. The water balance estimation, described by equation 1, uses the principles of conservation of mass in a closed system: 𝑄𝑜𝑢𝑡 = 𝑄𝑖𝑛 + 𝐼 − HPET (Eq. 1) Where Qout is the wastewater outflow quantity [m3/d], Qin is the wastewater inflow quantity [m3/d], I is the water quantity which enters the system via precipitation [m3/d] and PET is the water quantity lost from the system via evapotranspiration [m3/d]. The height of precipitation Hrain was obtained by the Hellenic Meteo Service, Bureau of Serres and the height of evapotranspiration HPET was calculated by customizing the Thornthwaite method [21], [24], due to the small number of the data required for its implementation, compared to the model of Perman-Monteith, which is considered more reliable [25]. From the measured concentrations of nutrients, in the input (Cin) and in the output (Cout) of the three systems, the removal efficiency of nutrient concentrations is calculated. Having estimated, with the Thornthwaite method, the height of evapotranspiration HPET and knowing the amount of Hrain precipitation, the change of ponds’ water level ΔH [cm] can be calculated. Multiplying ΔH with the surface of each system, the changes in volume ΔV [m3] are estimated. Dividing ΔV with the number of days of each month, the term ΔV/d [m3/d] is resulting, i.e. the daily change of the ponds’ volume for each month. The term ΔV/d is subtracted from the initial daily flow Q and thus results a new term Q΄. Q΄ = Q – (ΔV/d) (Eq. 2) Multiplying the new daily flow Q’ [m3/d] with the mean of the concentrations [mg/L] 𝐶𝑜𝑢𝑡 𝑖 + 𝐶𝑜𝑢𝑡 𝑖+1
and with the number of days elapsed between sampling (Δt), the final output mass Massout [kg] is estimated - with appropriate conversion of units. 2
Massout = Q΄ x Δt x
𝐶𝑜𝑢𝑡 𝑖 + 𝐶𝑜𝑢𝑡 𝑖+1 2
x 10-3
In the same way, the input mass Massin [kg] is estimated too.
(Eq. 3)
Massin = Q x Δt x
𝐶𝑖𝑛 + 𝐶𝑖𝑛 𝑖 𝑖+1 2
x 10-3
(Eq. 4)
The difference Massin - Massout determines the variation of mass throughout the study period. Having estimated the input and output mass of nutrients, the mass efficiency is calculated based on the equation: Mass efficiency (%) = [Μassin-Massout] x 100/Massin (Eq. 5) The parameters of the data statistical analysis were calculated for both the concentration and the mass of TN, N-NH4+ and N-NO− 3 , TP, with the use of Microsoft Office EXCEL 2007. The performed equations have been evaluated by the coefficient of determination R2. 3. RESULTS AND DISCUSION The TN, N-NH4+ and N-NO− 3 concentrations differ in the three WSP systems; differences were also recorded for the same system due to the different characteristics of the systems’ inflow (i.e. real wastewater). However, no significant deviations in their concentrations were recorded. Tables 2, 3 and 4 present statistical data for TN, N-NH4+ and N-NO3− inflow and outflow concentrations. Based on the inflow concentration measurements, the systems are classified as low load. The output concentration measurements are satisfactory compared to values of similar WSP systems operating in South Europe [26]. Table 2. The TN inflow and outflow concentrations in the three WSP systems [mg/L] Max Min Mean STDEV AVEDEV WSPs In Out In Out In Out In Out In Out V* 38.3 4.7 12.6 1.1 24.7 2.95 6.2 1.0 1.2 0.3 N.S 24.3 14.3 20.6 13.9 22.5 14.1 2.6 0.2 1.9 0.2 Ch. 23.5 10.4 22.9 10.2 23.2 10.3 0.4 0.15 0.3 0.1 *V = Vamvakofito, N.S = N.Skopos, Ch = Charopo
Table 3. The N-NH4+ inflow and outflow concentrations in the three [mg/L] Max Min Mean STDEV WSPs In Out In Out In Out In Out V 30.0 3.3 9.7 0.6 19.5 2.0 5.0 0.8 N.S 19.2 10.8 16.2 10.6 17.7 10.7 2.1 0.1 Ch. 18.2 8.10 17.9 7.9 18.1 8.0 0.2 0.2 Table 4. The N-NO− 3 [mg/L] Max WSPs In Out V 1.0 0.9 N.S 0.7 0.6 Ch. 0.3 0.3
WSP systems AVEDEV In Out 0.9 0.2 1.5 0.1 0.2 0.1
inflow and outflow concentrations in the three WSP systems Min In 0.1 0.2 0.2
Out 0.1 0.2 0.2
Median In Out 0.4 0.3 0.4 0.4 0.3 0.2
STDEV In Out 0.2 0.2 0.2 0.2 0.1 0.1
AVEDEV In Out 0.04 0.04 0.23 0.21 0.06 0.05
The standard deviations of the output concentrations are particularly small, indicating that the systems’ operation is stable. TN and N-NH4+ removal efficiencies are
considered satisfactory (Table 5), when compared to similar systems operating in similar climatic conditions, but this is not the case for N-NO− 3 removal [26], [27], [28]. The highest TN and N-NH4+ removal efficiencies were recorded in Vamvakofyto in August 2007 and were 93.21% and 95.82% respectively. The performance of TN, N-NH4+ and N-NO3− removal was nearly constant over the years and during the seasons, with only minor variations recorded. The Vamvakofyto WSP system presented by far the best performance for TN and N-NH4+ removal, followed by the Charopo WSP system. The lowest TN and N-NH4+ removal efficiency values (33.08% and 33.48% respectively), were recorded during winter period in the N. Skopos WSP system, when the recorded temperature was at its lowest. Monthly air temperatures ranged from -4 oC to 37 oC and water temperatures from 5 oC to 30 oC. There were no significant deviations in mass removal efficiencies compared to the concentration ones. In some cases they were almost identical (Figure 1). During the summer period, there was a decrease in mass removal efficiency in relation to the concentration efficiency (Figure 1 and Figure 2), due to the strong evapotranspiration, as a result of increased sunlight and high temperatures. This phenomenon was more evident in the case of TN removal in the Charopo WSP system. The latter can be attributed to its greater overall surface, compared to the other two systems, which is related to increased evapotranspiration and increased TN, N-NH4+ and N-NO− 3 mass in the effluent. In the Vamvakofyto and Charopo systems in particular, negative NNO3− removal efficiencies were recorded, due to the larger ponds’ surface (Figure 2). The pH values, although lower than 8, in more cases (Table 5), indicate positive association with TN and N-NH4+ removal (Table 6), with strong correlation R2 (0.946 and 0.947 respectively). It is observed that the pH output was slightly increased. This usually occurs due to algal activity, as reported in the literature [29, 30]. The pH values in the three systems never fell outside the proposed ranges (6-9) for the proper functioning of the lagoons [30, 31]. Table 5. Max, min, mean pH values in three WSP systems WSPs system Vamvakofito Ν. Skopos Charopo
n 49 34 34
Max in 8.09 8.17 7.92
out 8.22 7.95 8.08
Min in out 6.86 7.09 6.67 6.78 6.90 7.04
Mean in out 7.47 7.63 7.03 7.08 7.29 7.39
STDEV in out 0.32 0.30 0.40 0.32 0.24 0.24
The maximum, mean and minimum inlet and outlet concentrations of TP in three WSP systems are presented in Table 6. The standard deviations of the output is very low (0.48-1.38 mg/L), indicating their stable operation. The average values of output concentrations are much lower than those of similar systems in Europe [26]. However, the removal efficiency of N.Skopos (23.55%) and Charopo (22.32%) systems is much lower than the efficiency recorded in other similar systems [26].
0
Charopo:
(a) TN 0
(a) TN 40
60 30
50 20
30
Mass
-10
Concentration
-20
18/8/2007
40 18/8/2007
18/7/2007
2
18/6/2007
4
18/7/2007
Concentration 6
18/5/2007
Mass 18/8/2007
18/7/2007
18/6/2007
18/5/2007
18/4/2007
18/3/2007
18/2/2007
18/1/2007
Consentration
18/6/2007
15 -15
18/4/2007
20
Mass
18/5/2007
25 -10
18/4/2007
35
18/3/2007
18
18/2/2007
40
18/3/2007
20
18/1/2007
45
18/2/2007
(a) TN
18/1/2007
Mass Concentration 18/12/2006
40
18/11/2006
50
18/12/2…
15
18/12/2006
60
18/10/2006
80
18/11/2…
70
Efficiency (%)
20
18/10/2…
30 14
12
10
Efficiency (%)
18/8/2007
18/7/2007
90
18/11/2006
70
10
Efficiency (%)
18/8/2007
18/7/2007
18/6/2007
Efficiency (%)
25
18/10/2006
18/8/2007
10 18/6/2007
10
18/7/2007
20 18/5/2007
18/4/2007
18/3/2007
18/2/2007
18/1/2007
18/12/2…
18/11/2…
18/10/2…
20
18/6/2007
5
18/5/2007
10
18/5/2007
18/4/2007
18/3/2007
18/2/2007
18/1/2007
18/12/2…
18/11/2…
Vamvakofito:
18/4/2007
N.Skopos:
18/3/2007
18/2/2007
18/1/2007
18/12/2…
18/11/2…
0 18/10/2…
Efficiency (%) 0
18/10/2…
Efficiency (%)
100
10
5
0
30 -5
-20
(b) N-NO− 3
16
8
Mass
Concentration
(b) N-NO− 3
0
Mass
-30
Concentration
(b) N-NO− 3
Figure 1. WSP systems’ mass and concentration efficiency removal during 2006-07
100 90
20
89.17 89.16 88.46 87.07 85.94 89.12 88.06 86.64
15
Efficiency (%)
70
Efficiency (%)
80
Mass 16.65
16.16 14.04
13.95 12.44 11.87
Consentrati on
10.82
10
60
Mass
50 40
5
Concentratio n
30
0 20
Winter Spring Summer Autumn
10
-5
0
-7.04
Winter Spring Summer Autumn
Vamvakofito:
(b) N-NO− 3
(a) TN
40
Mass
18
37.03
35.55 34.82 34.25 34.01
16.09
Concentrat ion
16 31.92
29.94 29.29
Efficiency (%)
30
14
Efficiency (%)
35
-10
13.73
13.11
12.48 12.64
12.7112.71
12
25
Mass
20
Concentratio n
15
8 6
10
4
5
2
0
0
Winter Spring Summer Autumn
Winter Spring Summer Autumn
N.Skopos:
(b) N-NO− 3
(a) TN 25
60 54.33
56.11
55.87
51.58 50.07
23.00
54.78 54.45
20 17.27 41.99
Efficiency (%)
50
9.34
10
19.11 Concentra 18.03 tion
17.97
14.79 14.87
15
40
Mass
30
Concentrati 10 on
20
5
10
0
0
-5
Efficiency (%)
Mass
-1.20
Winter Spring Summer Autumn
Charopo:
(a) TN
Winter Spring Summer Autumn
(b) N-NO− 3
Figure 2. Seasonal variation of mass and concentration efficiency (%) on TN (a) and N-NO− 3 (b) removal.
Table 6. The TP inflow and outflow concentrations in the three WSP systems [mg/L] Max Min Mean STDEV AVEDEV WSPs In Out In Out In Out In Out In Out V 14.60 8.10 2.80 1.30 6.50 3.51 2.42 1.38 1.70 1.03 N.S 5.10 3.70 2.10 1.67 3.55 2.67 0.78 0.48 0.62 0.39 Ch. 6.20 4.90 2.10 1.60 4.51 3.49 1.32 1.00 1.07 0.82 The effectiveness of TP removal depends on the amount leaving the water column and entering the lake sediments. This occurs due to the precipitation of the organic P, the setting of the mass of algae and the precipitation of the mineralization as compared to the amount that is returned to the water column through the mineralization and redissolution. This effect becomes more intense at pH levels above 9.5. The pH of ponds ranged from 6.7 to 8.2 with an average value of about 7 to 7.5 (Table 7), therefore redissolution of P is higher. This fact could explain the low P removal efficiency of the three systems [31]. The low performance can also be attributed to the fact that the sludge of the ponds’ sediment hadn’t been removed during their years of operation. Part of the inorganic and of mineralized P, located in the sediment, redissolved and was present in the effluent. The effect of temperature on the performance is evident. As it is shown in Figure 3 all the three systems were more efficient in summer, when the temperatures were higher. The highest efficiency value (71 %) was recorded in Vamvakofyto system in August 2007. 60 53.1 50 40
44.76 35.49 Vamvakofito
30 20
52.65
21.99 19.32
21.43 19.42
23.62 21.08
23.25 18.7
N.Skopos Charopo
10 0 Winter
Spring
Summer
Autumn
Figure 3. Seasonal variation concentration efficiency (%) on TP removal. The TP mass removal efficiencies, overall, had no significant deviations from the concentration ones; in some cases they were almost identical. Only during the summer a reduction of TP mass removal efficiency, compared with the concentration one, was recorded, due to the intense evapotranspiration resulting from greater sunshine and higher temperatures. This phenomenon was more evident in the case of TP removal in Charopo WSPs system (Fig. 4), for the reasons previously mentioned.
30 25
23.57
24.32 22.07
20
23.35 23.21
21.39 17.89
15
Mass Concentrtion
10 5 0.39 0 Winter
Spring
Summer
Autumn
Figure 4. Seasonal variation of mass and concentration efficiency (%) on TP removal in Charopo WSPs system. It was noted, that the TP removal followed the BOD5 removal (Figure 5-6). In the systems of N Skopos and Charopo it was reaffirmed that the TP’s removal efficiency was about half the BOD5 removal [5]. 70
64.95
60 50
44.83
49.66 43.47
40 BOD5 removal (%)
30
21.55
22.32
20
TP removal (%)
10 0 Vamvakofito
Ν.Skopos
Charopo
Figure 5. TP and BOD5 removal efficiency % Equations were derived correlating the pollutants’ effluent concentrations Cout with the influent concentrations Cin. The effluent concentrations have been adjusted using the mass balance method, in order to remove atmospheric precipitation and evapotranspiration, as previously mentioned. The correlations between influent – effluent mass were satisfactory. The equations expressing the relationship of TN, N-NH4+ and NNO3− , TP effluent concentrations with the influent concentrations for each system are presented in Table 7. It should be noted that these simple models work in annual or seasonal basis, but it is difficult to use them in momentary basis. First, because there is a nominal delay of a residence time between inflows and outflows and secondly, because the temporary increases and decreases in the storage systems can easily affect the instantaneous performance. The low, in some cases, coefficients of determination,
indicate the importance of other factors, not included in this analysis, as the systems’ performance is a multiparametric subject.
Figure 6. Relationships of TN and N-NO− 3 effluent concentrations versus influent concentrations case of Vamvakofito’s WSPs system Figure 6 presents, indicatively, some of the linear regressions relating the TN and N-NO− 3 effluent corrected concentrations to the influent concentrations of Vamvakofito’s WSPs system. Table 7. Relationships of TN, N-NH4+ , N-NO3− , TP effluent versus influent concentrations System Vamvakofito N. Skopos Charopo Samples 49 34 34 C = 0.1353C – C = 0.527 C + 3.0881 C = 0.4713 Cin + TN out in out in out 0.2332
N-NH4+
R² = 0.7186
R² = 0.8781
R² = 0.5719
Cout = 0.1138 Cin – 0.1514
Cout = 0.5497 Cin + 1.9664
Cout = 0.457 Cin + 0.4783
N-NO− 3
R² = 0.6814
R² = 0.8923
R² = 0.5447
Cout = 0.8489 Cin + 0.0162
Cout = 0.8806 Cin – 0.0013
Cout = 0.8424 Cin + 0.0131
R² = 0.95 Cεξ = 0.4724Cεισ + 0.4419 R² = 0.683
R² = 0.9967 Cεξ = 0.4521 Cεισ + 1.0642 R² = 0.534
R² = 0.9414 Cεξ = 0.7367 Cεισ + 0.1681 R² = 0.955
TP
4.
0.5608
CONCLUSION
The three WSP systems have stable operation. The TN, N-NH4+ , N-NO3− and TP recorded concentrations [mg/L] of the three WSP systems had no significant divergences. The input TN, N-NH4+, N-NO− 3 and TP concentration values classify the three systems in low nutrient load class. The output concentration values are deemed to be satisfactory, when compared with values of similar WSP systems which operate in South Europe. The TN and N-NH4+ removal efficiencies were 88.13%, 35.25%, 54.21% and 90.02%, 35.57%, 55.27% respectively in Vamvakofito, N. Skopos and Charopo WSP system respectively and are considered satisfactory, compared to those of similar systems operating under similar climatic conditions. However, the outflow values do not render those outputs suitable for reuse, according to the Greek Legislation. The results are not satisfactory for the N-NO3− and TP removal, where the
efficiencies were 15.53%, 14.36%, 19.48% and 45%, 24%, 22% in Vamvakofito, N. Skopos and Charopo WSP system respectively. The facultative ponds’ retention time, the ratio of the ponds’ surface per m3 wastewater supply and the pH values also seem to have a strong positive correlation with TN and N-NH4+ removal efficiencies, with R2 > 0.97 and 0.94 respectively. The highest TN, N-NH4+ , and TP removal efficiencies were 93.21%, 95.82% and 70.83 % respectively and were recorded during the hot summer period in the system with the highest retention time and the highest ratio of the ponds’ surface per m3 wastewater supply. The lowest TN, N-NH4+ and TP efficiency values were 33.08%, 33.48% and 12.83% respectively and were observed during the cold winter period in the system with the lowest retention time and the lowest ratio of ponds’ surface per m3 wastewater supply. The performance of TN, NNH4+ and N-NO− 3 removal in each WSP system was nearly constant over time and throughout the seasonal change, with minor variations. The phosphorus removal efficiencies of N. Skopos and Charopo WSP systems are about the half of the BOD5 removal efficiencies. This relationship is also confirmed by other researchers in similar systems. The reduced TP performance can be attributed to the increase of the sediment in the ponds, since the sludge was not removed during the years of the systems’ operation as part of the inorganic and of the mineralized P, located in the sediment, redissolved and was presented in the effluent. In addition, the lowest phosphorus removal efficiency of N. Skopos and Charopo systems were attributed to the fewer surfaces of facultative ponds and to the lower pH value, due to the important role of pH in TP removing. The pH was ranged from 6.7 to 8.2 with an average value from 7 to 7.5, which partly explains the low TP systems’ efficiencies, inasmuch as these values for the phosphorus redissolution are usually higher, according to the literature. The mass removal efficiencies had not significant deviations from the concentration ones. Exception to this was during the summer period, where there was a decrease in mass removal efficiency in relation to the concentration efficiency due to the strong evapotranspiration. This phenomenon was more evident in the system with the greater ponds’ surface, where negative efficiencies were recorded. Equations expressing the TN, N-NH4+, N-NO− 3 and TP effluent concentrations as a function of the influent concentrations for each system were derived. References 1.
2. 3.
4.
5.
Gijzen H.J, Bos J.J., Hilderink H.B.M., Moussa M., Niessen L.W., de Ruyter van Steveninck E.D. Quick scan health benefits and costs of water supply and sanitation. Netherlands Environmental Assessment Agency (2004) National Institute for Public Health and the Environment – (MNP-RIVM), The Netherlands. Mara D.D. and Alabaster G.P., Design manual for waste stabilization ponds for Mediterranean countries, Lagoon Technology (1998) International Ltd, Leeds, England. Picot B., Bahlaoui A., Moersidik B., Baleux B., Bontoux J. Comparison of the purifying efficiency of high rate algal pond with stabilization pond (1992) Water Science and Technology, 25(12), pp. 197–206. Racault Y., Boutin C., Seguin A. Waste stabilisation ponds in France: a report on fifteen years experience (1995) Water Science and Technology, 31(12), pp. 91– 101 Garcia J., Mujeriego R., Bourrouet A., Penuelas G., Freixes A. Wastewater
6.
7.
8.
9.
10.
11.
12.
13.
14. 15.
16.
17.
18.
19.
20. 21.
treatment by pond systems: experiences in Catalonia, Spain (2000) Water Science and Technology, 42(10–11), pp. 35–42. Ghazy M.M.E., El-Senousy W.M., Abdel-Aatty A.M., Kamel M. Performance evaluation of a waste stabilization pond in a rural area in Egypt (2008) American Journal of Environmental Science, 4(4), pp. 316–325. Mburu N., Tebitendwa S.M., Bruggen J.J.A., Rousseau D.L.P., Lens P.N.L. Performance comparison and economics analysis of waste stabilization ponds and horizontal subsurface flow constructed wetlands treating domestic wastewater: a case study of the Juja sewage treatment works (2013) Journal of Environmental Management, 128, pp. 220–225. Strang T., Wareham D.G. Phosphorus removal in a waste-stabilization pond containing limestone rock filters (2006) Journal of Environmental Engineering and Science, 5(6), pp. 447-457. Camargo Valero M.A., Johnson M., Mather T., Mara D.D. Enhanced phosphorus removal in a waste stabilization pond system with blast furnace slag filters (2001) Desalination and Water Treatment, 4(1-3), pp. 122–127. Zimmo O.R, Van der Steen, N.P., and Gijzen, H.J. Comparison of Ammonia Volatilization Rates in Algae and Duckweed-based waste stabilization ponds treating domestic wastewater (2003) Water Research, 37 (19), pp. 4587-4594. Aloyce W. Mayo, Muslim Abbas. Removal mechanisms of nitrogen in waste stabilization ponds (2014) Physics and Chemistry of the Earth, Parts A/B/C, 72– 75, pp. 77–82. Pano A., Middlebrooks E.J. Ammonia nitrogen removal in facultative wastewater stabilization ponds (1982) J. Water Pollution Control Federation, 54 (4), pp. 344–351. Senzia, M.A., Mayo, A.W., Mbwette, T.S.A., Katima, J.H.Y., Jørgensen, S.E. Modelling nitrogen transformation and removal in primary facultative ponds (2002) Ecological Modelling, 154(3), pp. 207–215. Reed, S.C. Nitrogen removal in wastewater stabilization ponds (1985) J. Water Pollution Control Federation, 57 (1), pp. 39–45. Ingallinella A., Sanguinetti G., Fernandez R., Strausss M. and Montangero A. Co- treatment of sewage and septage in waste stabilization ponds (2002) Water Science and Technology, 45 (1), pp. 9-15. Banat I., Puskas K., Esen I. and Al-Daher R. Wastewater treatment and algal productivity in an integrated ponding system (1990) Biological Wastes, 32 (4), pp. 265-275. El-Shafai S.A., El-Gohary F.A., Nasr F.A., Van der Steen N.P. and Gijzen H.J. Nutrient recovery from domestic wastewater using a UASB-duckweed ponds system (2007) Bioresource Technology, 98 (4), pp. 798-807. Laginestra M. and van-Oorschot R. Wastewater treatment pond systems – An Australian experience (2009) Ozwater Paper 082. Proceedings of Australian Water Association Conference, March 18-19, Melbourne, Australia, avalaible at www.ghd.com/PDF/WWSP082.pdf. Reinoso R., Blanco S., Torres-Villamizar L. and Becares E. Mechanisms for parasites removal in a waste stabilization pond (2011) Microbial Ecology, 61 (3), pp. 684-692 National Metrological Service of Greece, Bureau of Serres. Chalatsi M. Qualitative and hydrodynamics characteristic of stabilization pond systems in Northern Greece (2014) PhD Thesis, Department of Civil Engineering, Democritus University of Thrace. [in Greek]
22. Heliotis F.D. and DeWitt C.B. A conceptual model of nutrient cycling in wetlands used for wastewater treatment: A literature analysis (1983) Wetlands, 3 (1), pp. 134-152. 23. Breen P.F. A mass balance method for assessing the potential of artificial wetlands for wastewater treatment (1990) Water Research, 24 (6), pp. 689-697. 24. Korkusuz E.A. Domestic wastewater treatment in pilot-scale constructed wetlands implemented in the Middle East Technical University (2004) Ph.D. Thesis, Department of Biotechnology, School of Natural and Applied Sciences, Middle East Technical University, Turkey. 25. Ward R.C. and Robinson M. Principles of Hydrology (2000) 4th ed., Mc GrawHill, New York. 26. Gratziou Μ., Chalatsi M. Use of waste stabilization ponds’ systems in Mediterranean Europe (2013) Desalination and Water Treatment, 51 (13-15), pp. 3018–3025. 27. Chalatsi Μ. and Gratziou M. Efficiency and design parameters of waste stabilization ponds in north-east Greece (2014) Desalination and Water Treatment, available at http://dx.doi.org/10.1080/19443994.2014.981677 28. Tsalkatidou M. Simulations of combined wastewater treatment using stabilization ponds and wetlands (2010) PhD Thesis, Department of Civil Engineering, Faculty of Engineering, Democritus University of Thrace, Xanthi, Greece. [in Greek] 29. IWA. Constructed Wetlands for Pollution Control – Processes, Performance, Design and Operation, (2001) Specialist Group on use of macrophytes in Water Pollution Control, Scientific and Technical Report No. 8, London, UK. 30. Mara D.D. Design Manual for Waste Stabilization Ponds in the United Kingdom (2003) School of Civil Engineering, University of Leeds, Leeds, England. 31. Hamzeh R., Ponce M.V. Design and performance of waste stabilization ponds, http://stabilizationponds.sdsu.edu, accessed on November 2, (2014)