MARINE ECOLOGY PROGRESS SERIES Mar Ecol Prog Ser
Vol. 204: 131–141, 2000
Published October 5
Nutrition of the sea urchin Paracentrotus lividus (Echinodermata: Echinoidea) fed different artificial food Catherine Fernandez1, 2,*, Charles-François Boudouresque2 1 EqEL and CRITT Corse Technologie, Université de Corse, BP 52, 20250 Corte, France UMR-DIMAR 3 BP 901, Faculté des Sciences de Luminy, 13288 Marseilles cedex 9, France
2
ABSTRACT: Nutrition and growth of 3 size classes of Paracentrotus lividus fed different artificial diets were studied at monthly intervals over 9 mo. At the end of the experiment, the gonadal, test and gut growth rates were estimated so as to establish nutritional budgets. Three types of food were provided: ‘vegetable-feed’ (low protein, high carbohydrate), ‘mixed-feed’ (intermediate protein and carbohydrate) or ‘animal-feed’ (high protein, low carbohydrate). Nutritional parameters were affected by food quality, sea urchin size and experimental period. The highest ingestion rate was obtained with the vegetable food. The highest absorption value was recorded with the animal food while the lowest was observed for the vegetable food. Absorption was negatively correlated to both ingestion rate and carbohydrate levels of the food. The assimilation efficiency was lowest with the vegetable diet and highest with the animal-based feed. Allocation of energy amongst the different body organs was influenced by food quality and sea urchin size. A growth model based on the results shows that sea urchin growth can be explained by 4 factors: the quantity of food ingested; the amount of food absorbed; the size of the individuals; and the quantity of dry matter absorbed. KEY WORDS: Sea urchin · Artificial diet · Nutrition · Growth · Nutritional budgets Resale or republication not permitted without written consent of the publisher
INTRODUCTION The quantity and quality of food can influence the physiology and morphology of regular sea urchins. First, the allocation of resources to different components of somatic growth varies with the level of food availability (Ebert 1988), with an increase in the relative size of Aristotle’s lantern and a decrease in the relative size of the test under conditions of low food availability (Ebert 1980, Levitan 1991, Fernandez & Boudouresque 1997, McShane & Anderson 1997). Second, variations in food supply can affect reproduction (gametogenesis, maturation, size and number of eggs; Gonor 1973, George 1996) even if reproduction may be
*E-mail:
[email protected] © Inter-Research 2000
protected by redirecting resources at the expense of somatic growth (Thompson 1982). Food quality also affects physiology and particularly nutritional parameters although the effects of are less known. A positive correlation has been observed between food quality and ingestion rate (optimal foraging theory) but a negative relationship between these 2 variables (compensatory intake model) has also been reported (Emlen 1968, Frantzis & Grémare 1992, Valiela 1995). In this type of study, it is difficult to evaluate the quality of the food. Several indices of food quality can be used, e.g. organic matter, proteins, energy (Frantzis & Grémare 1992). However, use of natural marine macrophytes is problematic due to the variability in their biochemical composition (which varies according to season or site). As a result, the use of food with a known and stable biochemical composition is necessary to study the ef-
132
Mar Ecol Prog Ser 204: 131–141, 2000
fect of food quality on nutrition and growth of sea urchins. Artificial diets are thus required. The edible Paracentrotus lividus (Lamarck) is the most abundant echinoid species in Mediterranean littoral communities. This urchin is a herbivore (Verlaque 1987) but can also consume animal food (Fernandez & Caltagirone 1998). The objective of the present study was to investigate the effects of food quality on feeding, absorption, growth rates and growth of the various organs in different size classes of Paracentrotus lividus. The experimental period adopted was designed to allow any temporal variations of these parameters to be discerned.
MATERIALS AND METHODS Collection of echinoids. A total of 1020 sea urchins Paracentrotus lividus (Lamarck) were collected in a Mediterranean lagoon (Urbinu Corsica, France, Mediterranean) in September 1993 using SCUBA at depths ranging from 1 to 3 m. Three size classes of the urchins were sampled with test diameters between 20 and 25 mm (mean size: 23.2 ± 1.1 mm and mean weight: 5.8 ± 0.9 g; mean ± standard deviation); between 30 and 35 mm (mean size: 32.1 ± 1.2 mm and mean weight: 14.8 ± 1.5 g); and between 40 and 45 mm (mean size: 42.5 ± 1.0 mm and mean weight: 31.9 ± 2.8 g). Experimental design. Sea urchins were maintained in the laboratory in 9 aquaria (3 for each size class) filled with running seawater (ambient temperature and salinity between 38 and 39 ‰). Each aquarium was divided into 10 equal-sized boxes and 1 sea urchin was placed in each box. It should be noted that no aquarium replicates were carried out but each treatment involved 10 individuals. The experimental conditions (temperature, type of aquarium, light, water flow) were exactly the same for each of the 9 aquaria used so as to reduce any potential tank effect. Urchins were fed artificial foods from October 1, 1993 to July 1, 1994. Diet composition. Three artificial foods were used: (1) vegetable meal and vegetable oils, which were rich in soluble carbohydrates (58%), referred to as ‘vegetable food’; (2) fish meal and vegetable meal in equal quantities mixed with fish oil and vegetable oil, referred to as ‘mixed food’ (it contained 29% soluble proteins and 35% soluble carbohydrates); and (3) fish meal and fish oil, rich in soluble proteins (47%) and referred to as ‘animal food’ (Table 1). The artificial diets were distributed in the form of small blocks (1 × 1 × 1.5 cm). Food was always in excess. The 3 aquaria for each size class received, respectively, vegetable food, mixed food and animal food. Nutritional parameters. Ingestion rates were measured monthly. Over a 3 d period, and for each food
Table 1. Ingredients used in the preparation of the artificial feeds. The artificial food contained 56% of base meal mixed into a 12.5% binder solution (binder used was gelatin from bovine skin). Biochemical composition of the final food (meal and binder) is also expressed as a percentage (in dry weight). Energetic levels are expressed in kJ g–1 dry weight Vegetable food %
Mixed food %
Animal food %
Corn meal Wheat meal Fish meal Sunflower oil Cod liver oil Vitamin and mineral mixturea Soluble proteins Soluble carbohydrates Total lipids Ash
44.7 44.7 0.0 8.9 0.0 1.7
22.3 22.3 44.7 4.5 4.5 1.7
0.0 0.0 89.4 0.0 8.9 1.7
12.7 58.2
28.9 35.3
47.2 15.9
10.7 4.9
12.8 8.1
15.5 10.7
Energetic level
17.1
18.0
19.8
a
The mixture is made up of (expressed in mg or UI kg–1 of feed): tocopherol acetate: 70.8 UI; ascorbic acid: 283 mg; thiamin: 7.1 mg; riboflavin: 7.6 mg; pyridoxine: 9.4 mg; cyanobalanine: 0.014 mg; biotine: 0.47 mg; folic acid: 1.89 mg; calcium pantothenate: 23.6 mg; vitamin A: 710 UI; vitamin D3: 700 UI; niacin: 14.6 mg; CaCO3: 2.1 mg; Cu SO4: 9.4; Fe SO4: 4.7 mg; NaF: 7.1 mg; Mg CO3: 174 mg; Mn SO4: 18.9 mg; CaHPO4: 75.5 mg; Zn SO4: 7.7 mg
type, a given amount of food was provided every 24 h. The feed not ingested at the end of 24 h was collected, freeze dried and weighed. Individual ingestion rates were calculated as being the difference between the provided food biomass and the biomass not ingested (dry weight). Similarly, the water content and dissolution rate of 10 blocks of food were studied to assess food biomass losses and were used to correct the daily ingestion rates. Ingestion was calculated in terms of wet weight, dry weight, organic matter, and protein, carbohydrate and lipid levels. Absorption efficiencies were also measured monthly. One day after the first food distribution (see ingestion rate protocol above), the faecal pellets produced by the 10 urchins of each aquarium were collected rinsed, freeze dried and weighed; this was repeated every 24 h over the 3 d feeding period. The calculation of absorption was performed using Eq. (1) and was calculated in terms of wet weight, dry weight, organic matter and protein, carbohydrate and lipid levels. absorption (%) =
(ingested biomass – defaecated biomass) × 100 ingested biomass
(1)
Growth was also recorded monthly based on total wet weight (after 1 min drainage). At the end of the experiment, the gonad, gut, test and lantern weights
Fernandez & Boudouresque: Nutrition of the sea urchin Paracentrotus lividus
for each sea urchin were determined after dissection and drying at 70°C to constant weight. To obtain initial values, these measurements were also taken at the beginning of the experiment from 10 urchins of each size class collected at the same time as the experimental animals. The difference in mean weight for each sea urchin compartment at the beginning and at the end of the experiment allows the growth rate of each organ and the calculation of compartment indices to be estimated. The relationship between the wet weight of the compartment (WWC) and the total wet weight of the sea urchin (TWW) in mg expresses a percentage: CI (%) = WWC 100/TWW (Lawrence et al. 1965). From these data, the gross assimilation efficiencies were calculated using Eq. (2). From these assimilation efficiency results, the quantity of ingested food which is transformed through growth into tissue can be estimated. For the monthly assimilation we used the wet weight. assimilation efficiency (%) =
ingestion rate × 100 growth rate (2)
The nutritional budgets, in energy, were then established using all the data obtained. The mode of representation is the same as that used by Frantzis (1992) and was derived from Hawkins & Hartnoll (1983). This method also allows us to calculate the assimilation in each of the compartments (in terms of energy) for the entire 9 mo experimental period. Statistics. Three-way ANOVAs and 1-way ANOVAs combined with Tukey multiple comparison tests were used to make comparisons of the nutritional parameters according to the 3 studied factors: ‘food type’ (dietary treatments), ‘size’ (sea urchin initial size) and ‘experimental period’ (9 measurements during the 9 mo of the study). The relationships between ingestion and the biochemical characteristics of the foods were assessed using correlation and regression analyses. Statgraphics plus (v. 1.4) for Windows and STATICF software was used.
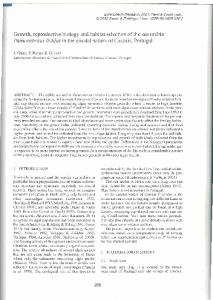
RESULTS Ingestion rates All the ingestion rate values (regardless of the units of measurement) vary directly with the 3 parameters examined (food type, size class, and experimental period) (Fig. 1). The variations in dry weight are significant (3-way ANOVA, F = 40.23, 72.48 and 32.87 respectively; p < 0.001) as is the interaction between the 3 factors (F = 2.30; p < 0.001). As a result, 1-way analyses were performed in order to eliminate these interactions.
133
In terms of the type of food, it was observed that the quantity of food ingested (in terms of dry weight, wet weight and organic matter levels) was greater with the vegetable food than for the other types (Tukey test, p < 0.05) throughout the experimental period. The levels of ingested protein are low for individuals fed the vegetable food, intermediate for those fed mixed food and high for those fed the animal food type (3-way ANOVA, food factor F = 329.44; p < 0.0001). The ingested carbohydrate levels recorded for the different types of food are exactly opposite to those observed for the proteins (3-way ANOVA, food factor F = 479.81; p < 0.0001). Finally, the significant variations in lipid ingestion are as follows: the lowest lipid ingestion levels are recorded for the mixed food, followed by the vegetable food and a high ingestion level is observed with the animal food (F = 18.04; p < 0.05). The results on relationship between ingestion rate and biochemical composition reveal a significant correlation between ingestion and protein levels for the 20–25 and 30–35 mm size classes (r = 0.55 and 0.52 respectively, p < 0.05). The quantity of food ingested (in terms of dry weight, wet weight, organic matter, protein, carbohydrate or lipid levels) increases with the size of the individuals (Tukey test, p < 0.05). For the 3 foods provided, a significant correlation exists between total food weight ingested and sea urchin final weight (multiplicative regression model: significance correlation test, p < 0.05). When the quantity of ingested food is calculated in terms of a percentage of total sea urchin weight, ingestion levels decrease as a function of urchin size class following a logarithmic regression model (significance correlation test, p < 0.05). The monthly variations in ingestion rate show that the lowest food intake levels were observed in winter (December, January, February) and occasionally in May, and the highest in June but also in March and October (1-way ANOVA, p < 0.05; Tukey test, p < 0.05). The correlation between ingestion levels and water temperature is significant for sea urchins fed the animal food (regardless of urchin size) (significance correlation test, p < 0.05) and for urchins of the 30–35 and 40–45 mm size classes fed the mixed food (r = 0.79 and 0.64, respectively). A significant correlation was only observed for the 40–45 mm size class when provided vegetable food (r = 0.85).
Absorption The absorption efficiency values varied (in terms of dry weight) from 40% for 20–25 mm sea urchins with vegetable food (in February) to 83% for 40–45 mm urchins fed animal food (in October) (Fig. 2). The
Mar Ecol Prog Ser 204: 131–141, 2000
IX VII
600 500 400 300 200 100 0
V III
Month I
M2
M3
M4
A2
A3
A4
VII
350 300 250 200 150 100 50 0
V III
Month
I
V2
V3
IX VII
300 250 200 150 100 50 0
V III I
V2
V3
V4
M2
M3
M4
A2
A3
A4
Ingested organic matter (mg d–1)
C C
Month
V4
M2
M3
M4
A2
A3
DD IX VII
150 125 100 75 50 25 0
V III
Month
I
V2
Treatment (diet and size class)
V3
V4
M2
M3
M4
A2
A3
200 V
150 100
III
Month
50 I
0 V4
M2
M3
M4
A2
A3
Treatment (diet and size class)
A4
IX VII
50 40
V
30 III
Ingested
VII
carbohydrates (mg d–1)
FF
IX
V3
A4
Treatment (diet and size class)
EE
V2
A4
Treatment (diet and size class)
Treatment (diet and size class)
Ingested proteins (mg d –1)
V4
IX
20
Month
10 I
0 V2
V3
V4
M2
M3
M4
A2
A3
Treatment (diet and size class)
A4
(mg d–1 )
V3
BB
lipids
V2
biochemical characteristics of the food are significant (significance correlation test; p < 0.001 in all cases). The most significant correlation is seen between absorption efficiency (dry weight) and the level of carbohydrates in the food (r = –0.81). The relationship existing between absorption efficiency and ingestion rate was also examined, and a significant correlation was observed for 2 size classes (20–25 mm: r = –0.56, p < 0.05; 30–35 mm: r = –0.40, p < 0.05; 40–45 mm: r = 0.08, p > 0.05).
Ingested dry weight (mg d–1 )
A A
Ingested wet weight (mg d–1 )
absorption efficiency values vary significantly with the food type but do not vary with the size of the individuals (dry weight: 2-way ANOVA; food factor: F = 76.61, p < 0.001; size factor: F = 0.32, p > 0.05; interaction: F = 0.5, p > 0.05). For dry weight, organic matter and carbohydrate levels, the absorption efficiencies are significantly different for the 3 food types. For protein levels, differences are only significant between the mixed and animal foods. Correlation analysis between absorption efficiencies (in terms of dry weight) and the
Ingested
134
Fig. 1. Paracentrotus lividus. Average ingestion rates during the 9 months (October [I] through June [IX]) of the experiment for the 9 treatments. Ingestion rates are expressed in terms of (A) wet weight, (B) dry weight, (C) organic matter, (D) proteins, (E) carbohydrates and (F) lipids. A: animal artificial diet, M: mixed artificial diet, V: vegetable artificial diet, 1: class size 20–25 mm; 2: class size 30–35 mm; 3: class size 40–45 mm
Fernandez & Boudouresque: Nutrition of the sea urchin Paracentrotus lividus
135
served for the 20–25 mm size class fed either mixed or animal food. The monthly fluctuations in growth reveal a growth decrease in winter as well as in May during the spawning period. At the end of the experiment the gonadal, gut and test indices had increased substantially within the tanks as compared to the initial values. Conversely, the lantern index decreased (Fig. 4).
Growth The mean initial size of the sea urchins was 23.2 mm (5.8 g) for individuals of the 20–25 mm size class, 32.1 mm (14.8 g) for 30–35 mm individuals and 42.5 mm (31.9 g) for the 40–45 mm size class. Growth differences were observed for the different food types and, for the different size classes, and they also depended on the experimental period (3-way ANOVA, p < 0.05) (Fig. 3). Maximal relative growth was ob-
Assimilation The assimilation efficiencies varied with the food provided, the size of the individuals and the experimental period (Fig. 5) (3-way ANOVA, food factor: F = 376.2, p < 0.0001; size factor: F = 28.36, p < 0.0001; month factor: F = 12.01, p < 0.0001; significant interaction between the food and month factors, p < 0.05). The vegetable food was the least efficient, followed by the mixed food, which was slightly less efficient than animal food (Tukey test, p < 0.05). Assimilation efficiencies were higher for small sea urchins (20–25 mm) than for the bigger ones (30–35 and 40–45 mm) (Tukey test, p < 0.05). The significant monthly variations differed
VII
90 75 60 45 30 15 0
V III I
V2
V3
V4
M2
M3
M4
A2
A3
A4
Treatment (diet and size class)
Absorption rate (% organic matter)
B B IX VII
90 75 60 45 30 15 0
V III
Month I
V2
V3
V4
M2
M3
M4
A2
A3
A4
C C IX VII
100 80
V
60 III
40
Month
20 I
0 V2
IX VII
100 80
V
60 III
40
Month
20 I
0 V4
M2
M3
M4
A2
A3
Treatment (diet and size class)
A4
Absorption rate (% carbohydrates)
D D
V3
V4
M2
M3
M4
A2
A3
A4
Treatment (diet and size class)
Treatment (diet and size class)
V2
V3
EE IX VII
90 75 60 45 30 15 0
V
Month
III I
V2
V3
V4
M2
M3
M4
A2
A3
A4
Absorption rate (% lipids)
Month
Absorption rate (% proteins)
IX
Absrorption rate (% dry weight)
A A
Treatment (diet and size class)
Fig. 2. Paracentrotus lividus. Average absorption efficiencies rates during the 9 months of the experiment for the 9 treatments. Absorption efficiencies are expressed in terms of (A) dry weight, (B) organic matter, (C) proteins, (D) carbohydrates and (E) lipids. Treatments and months as in Fig. 1
IX VII
2.5 2
V
1.5 III
1
Month
0.5 I
0 V2
V3
V4
M2
M3
M4
A2
A3
A4
Treatment (diet and size class)
IX VII
20 V
15 10
III
Month
5 I
0 V2
V3
V4
M2
M3
M4
A2
A3
Gross assimilation efficiency (% wet weight)
Mar Ecol Prog Ser 204: 131–141, 2000
Growth rate (g wet weight month–1)
136
A4
Treatment (diet and size class)
Fig. 3. Paracentrotus lividus. Average monthly growth rate (in wet weight) during the 9 months of the experiment for the 9 treatments. Treatments and months as in Fig. 1
Fig. 5. Paracentrotus lividus. Average gross assimilation efficiency (in % of wet weight) during the 9 months of the experiment for the 9 treatments. Treatments and months as in Fig. 1
depending on the food provided. The lowest assimilation levels were recorded during the winter (December to February) and during May; maximal assimilation efficiencies were observed in the spring and autumn (October, November, April; Tukey test, p < 0.05). In order to further examine assimilation in the various body compartments, a nutritional budget for each size class and for each food type was calculated from the nutrition and growth data (Fig. 6). The distribution
of energy ingested depended on the body compartment, the size class and the food provided (3-way ANOVA, body compartment factor: F = 19255, p < 0.00001; size class factor: F = 10, p < 0.00001; food factor: F = 2539, p < 0.0001). As a general rule, most of the ingested energy was allocated to respiration, excretion and secretion (losses), and only a small part was allocated to gut growth. The remaining energy was allocated to test and
Fig. 4. Paracentrotus lividus. Average physiological indices (in % of wet weight) recorded at the beginning (initial values) and at the end of the experiment for the 3 tested feeds and the 3 size classes
Fernandez & Boudouresque: Nutrition of the sea urchin Paracentrotus lividus
Ingested food v : 590.9 kJ m : 498.21 kJ a : 506.33 kJ
v : 1.71% m : 2.47% a : 2.79%
{
Test : L o s s e s
F a e c e s
{
{
{
Gonads :
v : 1.17% m : 2.80% a : 1.95%
v : 53.50% m : 70.72% a : 79.94%
v : 59.35% m : 74.94% a : 85.87%
v : 0.25% m : 0.24% a : 0.27%
{
Gut :
{
Size 30–35 mm Ingested food v : 788.14 kJ m : 608.19 kJ a : 684.71 kJ
Absorption L o s s e s
{
Gonads :
v : 1.60% m : 3.58% a : 2.51%
{
{
Size 40–45 mm
v : 1.38% m : 2.35% a : 2.48%
{
Test :
F a e c e s
v : 40.65% m : 25.06% a : 14.13%
v : 56.62% m : 68.76% a : 80.61%
v : 60.23% m : 72.47% a : 84.27%
v : 0.13% m : 0.28% a : 0.34%
{
Gut :
{
Ingested food
{
v : 897.10 kJ m : 785.94 kJ a : 853.83 kJ
Absorption F a e c e s
v : 39.77% m : 27.52% a : 15.73%
L o s s e s
Test :
v : 1.37% m : 2.16% a : 2.17%
Gonads :
v : 2.26% m : 3.48% a : 3.07%
{ {
{
{
DISCUSSION
v : 0.19% m : 0.24% a : 0.23%
{
Gut :
Absorption
v : 43.42% m : 23.77% a : 45.09%
(3)
where Gr = growth (in g); x1 = final sea urchin size (in mm); x2 = level of protein ingested (in mg); x3 = level of dry matter absorbed (in mg) and x4 = quantity of carbohydrates absorbed (in mg).
v : 56.58% m : 76.23% a : 84.91%
{
Size 20–25 mm
{
Gr = 3.05 – 0.16x1 + 0.35x2 – 0.12x 3 + 0.23x4
1968, Percy 1971, Miller & Mann 1973). These variations may be temperature dependent or they may be linked to the reproductive cycle (Moore & McPherson 1965, Fuji 1967, Lawrence 1975). The ingestion rates showed a significant positive correlation with temperature, as also reported by Miller & Mann (1973). The low ingestion levels in May (despite a high water temperature) may be the result of spawning during this period (May 3, 6 and 17, 1994). This is agreement with Fuji (1967), who observed that Stron-
{
gonad growth (1-way ANOVA, F = 1325 to 38854, p < 0.0001). The energy allocated to various body compartments differed with urchin size, except for the mixed food, for which the quantity of energy allocated to gonadal growth increased with size (1-way ANOVA, F = 4.15 to 9.26, p < 0.05). Conversely, the quantity of energy allocated to test and growth decreased with increasing sea urchin size (1-way ANOVA, F = 5.65 to 6.32, p < 0.05). No such tendencies were observed for either energy losses or allocations to the gut. Gonadal investment of ingested energy was of greater magnitude on the mixed food diet (increase of 201% between individuals of the 20–25 mm size class fed the vegetable and mixed food) and, to a lesser extent, the animal food. It should also be noted that for the mixed food, and contrary to the other foods, the energy allocated to the gonads was always higher than that attributed to the test, and this occurred regardless of the size class. For the test growth, the quantity of energy allocated was lower for the vegetable food than for the 2 other types (1-way ANOVA, F = 8.50 to 25.99, p < 0.0001). Finally, minimal losses were observed for the vegetable food, intermediate losses were seen for the mixed food and the highest losses were recorded for the animal food (1-way ANOVA, F = 726.6 to 2231.6, p < 0.0001). Although the nutritional budgets given above indicate where ingested nutrients are assimilated, no information is provided as to which nutrients are of importance. A multiple regression was performed to test the dependence of growth on all of the nutritional variables examined. Only 4 were retained for the purposes of the model: the levels of ingested protein (highest partial coefficient of determination, r2partial = 0.75), the quantity of carbohydrates absorbed (r2partial = 0.58), sea urchin size (r2partial = 0.40) and the quantity of dry matter absorbed (r2partial = 0.35). The regression is significant (ANOVA, F = 183; p < 0.0001) and the final correlation coefficient is r = 0.95. The equation for this multiple regression is as follows:
137
v : 43.7% m : 49.0% a : 61.1%
Monthly variation of nutritional parameters Monthly variations were observed in ingestion rate, absorption rate and gross assimilation efficiency as previously recorded for other Echinoidea (Leighton
Fig. 6. Paracentrotus lividus. Nutritional budgets (in terms of % of energy ingested) over the 9 months of the experiment for the 3 size classes. v: budget obtained with vegetable food, m: budget obtained with mixed food, a: budget obtained with animal food
138
Mar Ecol Prog Ser 204: 131–141, 2000
gylocentrotus intermedius (A. Agassiz) feeds very little just prior to and during its spawning. Fuji (1967) observed that variations in assimilation efficiencies concurred with fluctuations in water temperature. Similarly, Klinger et al. (1986) recorded a low absorption efficiency at low water temperatures, and Miller & Mann (1973) observed an elevation in absorption efficiency values with increasing temperature. Conversely, results given by Lares & McClintock (1991) suggest that absorption efficiency remains identical regardless of temperature. In the present study, only sea urchins fed vegetable food exhibited a significant correlation between water temperature and absorption levels. High values in gross assimilation efficiencies were recorded in the spring whereas values were low in the winter. Since respiration is known to increase with increasing temperature (Miller & Mann 1973), the assimilation efficiency should have dropped during the periods of elevated temperature, but this was not observed.
served in allocation to test and lantern with increasing size. A portion of the ‘lost’ energy represents spawned gametes. As a general rule, gametes which are produced and subsequently spawned are considered separately or are included in gonadal growth. In the present study however, urchins spawned in May and this portion of the energy allocated to gonadal growth is not included in our calculations. The part invested in the gametes spawned may represent up to 4% of the energy absorbed annually (Fuji 1967). ‘Losses’ are also costly for large individuals, probably due to the fact that the level of energy used for maintenance (particularly respiration) increases with increasing sea urchin age (Fuji 1967, Lawrence & Lane 1982). Conversely, the percentage of food allocated to test growth decreases with size, as observed with growth data obtained from theoretical models (Allain 1978, Azzolina 1988, Turon et al. 1995), and it is due to the individual’s physiology (Lawrence & Lane 1982). The same is true for the lantern, which requires less energy as its size decreases (Fuji 1967, Lumingas 1994), a phenomenon which holds true for other organs used in food acquisition (Lawrence 1975).
Effect of size on nutritional parameters An increase in ingestion rate (in terms of weight) with increasing size is generally observed in Echinoidea (Fuji 1967, Buxton & Field 1983, Mukai & Nojima 1985, Frantzis & Grémare 1992). A multiplicative regression model was observed in the present study for Paracentrotus lividus as has been reported for Parechinus angulosus Leske (Buxton & Field 1983). Proportionally speaking, the quantity of food available for growth in small individuals is greater than that in larger specimens. Absorption efficiencies for the different size classes are usually similar in Echinoidea (Fuji 1967, Miller & Mann 1973, Thompson 1982, Mukai & Nojima 1985). The present results are in agreement with this. The decrease of gross assimilation efficiencies with increasing sea urchin size is in agreement with Fuji (1967) and Leighton (1968). This cannot be due to a decrease in absorption. The nutrients absorbed are not used solely for growth but also for maintenance (Lawrence 1975). Miller & Mann (1973) and Lawrence & Lane (1982) observed that the quantity of food allocated to respiration increased with the size of the sea urchin. The variations in maintenance energy demands would therefore seem to be the main reason behind the observed decrease in gross assimilation efficiency with increasing urchin age. We also observed a variation in food allocation with increasing sea urchin size. As a general rule, the level of energy used for reproduction increases with increasing sea urchin size whereas a decrease is ob-
Effect of food provided on nutrition Variations in ingestion rate as a function of the food type provided have been reported in Echinoidea fed natural algae, with a correlation between food preference and food intake (Vadas 1977, Anderson & Velimirov 1982, De Ridder & Lawrence 1982, Frantzis & Grémare 1992) even when algae are used to prepare artificial food (Klinger & Lawrence 1984). With artificial food, the ingestion rates are higher for animal foods than for vegetable foods (Litchko et al. 1990) (note that it is with a carnivorous sea urchin). Finally, Lawrence et al. (1989) and Klinger et al. (1994) observed that the ingestion rates were identical for sea urchins given fish meal or vegetable meal. However, the 2 food types provided in the above experiments possessed a similar macro-nutrient quality: the same protein, carbohydrate and lipid percentages. The relationship between food quality and food intake levels is a subject of great controversy; the optimization theory suggests that ingestion levels increase with increasing food quality while the compensatory theory stipulates the existence of an inverse relationship between these 2 variables (Frantzis 1992, Valiela 1995). Although the results of the present study concern only 3 food types, the data generated seem to be more in agreement with the second theory, with an increase in ingestion rates when protein levels in the food are low (with protein levels being an indication of food quality). The same results have been obtained in
Fernandez & Boudouresque: Nutrition of the sea urchin Paracentrotus lividus
other studies (Miller & Mann 1973, Lowe & Lawrence 1976, Frantzis & Grémare 1992). In the present study, it should be noted that the increase in ingestion levels (in terms of weight) observed for individuals fed vegetable food does not compensate for the low protein content of this food type. According to several authors, maximal ingestion rate is governed by the volume of the gut (Frantzis 1992, but see also Klinger & Lawrence 1985). It is therefore possible that the quantity of vegetable food ingested does not reach the threshold limit and, as a result, that the quantity of food ingested is too low to provide the needed protein levels. Absorption efficiencies observed in regular sea urchins are generally quite high (see Lawrence 1975) (i.e. between 60 and 80%). Absorption efficiencies recorded for Paracentrotus lividus seem to vary substantially depending on the food provided; from 0 to 96% for marine plants (Frantzis & Grémare 1992, Ménager et al. 1995) and from 8 to 34% for artificial food (Lawrence et al. 1989). The high absorption recorded in our study may be due to the long duration as well as to the food provided. Indeed, the gut’s bacterial flora is not very efficient in wild specimens when they are exposed to a heterogeneous food resource. In contrast, during a long-term experiment using a unique food source, the microflora can become adapted and bring about an increase in the efficiency with which the food is absorbed (Frantzis & Grémare 1992, Barker pers. comm.). The differences in absorption efficiencies between the various types of food (in terms of dry weight and organic matter content) observed in this study seem to be due to a variability in the absorption of carbohydrates. Indeed, the absorption efficiencies for proteins remain very similar regardless of the food provided (between 81 and 86%) and the absorption of carbohydrates varied substantially from one food to another (from 49% for the vegetable food, to 88% for the animal food). It is suggested that these differences in absorption efficiency are due the differing carbohydrate quality. Regular sea urchins absorb insoluble carbohydrates poorly compared to the efficiency with which they absorb soluble sugars and proteins (Lawrence 1975, 1976, 1982). Insoluble carbohydrates are structural sugars which originate mainly from plant cell walls and they are abundant in vegetable meal whereas they are poorly represented in fish meal (McClintock 1986). The fact that ingestion rates are negatively correlated to protein content would seem to indicate that the sea urchins increase their food intake when eating vegetable food in an attempt to compensate for both the protein-poor aspect of this food source and also its low digestibility. The differences in absorption efficiency can also be explained by the relationship which exists between absorption efficiency and ingestion rate: absorption in Echinoidea is higher
139
when food intake levels are low (Thompson 1982, Mukai & Nojima 1985, Frantzis & Grémare 1992). This relationship may be due to the fact that the transit time of food within the gut increases when food intake levels are low (Kempf 1962, Fuji 1967, Gonor 1973) and would allow better activity of the digestive enzymes and microbial flora which would subsequently cause an increase in absorption efficiency (Gonor 1973, Frantzis 1992). The variations in gross assimilation efficiency observed for Paracentrotus lividus fed different food sources (10 to 25%) are similar to those recorded previously in Echinoidea (Fuji 1967, Leighton 1968, Mai & Mercer 1991) and to those of other herbivores, such as adult oyster (7 to 8%, Heral 1986), Rotifera (11%, Dajoz 1985), abalone (10 to 15%, Mai unpubl.) and limpets (10%, Hawkins & Hartnoll 1983). The values reported here, however, are much lower than the gross assimilation efficiencies observed in fish (45 to 58%) (Dajoz 1985). Concerning food allocation to each compartment, high allocation to gonad growth observed with the mixed food agrees with results of previous short-term growth experiments (Fernandez et al. 1995). In terms of the food type provided, the lower quantity of food allocated to test growth for the vegetable food corroborates a previous study where the lowest growth rates were obtained with vegetable food (Fernandez & Caltagirone 1994, Fernandez & Pergent 1998). This limited growth on vegetable food appears to result from not only the limited quantity of proteins but also to the relative quantity of food allocated to test growth which is lower than that observed for the more protein-rich food sources. The variation in energy losses as a function of feed could be due to oxygen consumption, which can vary greatly with the food provided (Gonzalez et al. 1993). In the present study, it was seen that the animal food and, to a lesser extent, the mixed food are more rapidly dissolved than the vegetable food. These solutions bring about pollution within the aquarium, with an increase in nitrates, nitrites and ammonia. These compounds are known to increase respiration, which leads to higher metabolic losses (Gonzalez et al. 1993). Although the gross assimilation efficiencies and nutritional budgets give a good indication of the utilization of food for growth, no information is provided about the nutritional aspects of the food sources most important for growth. It has been suggested that the growth of benthic plant-eating invertebrates is limited by the availability of macro- and micro-nutrients (Frantzis 1992). Multiple regression analyses suggest that growth is best explained by the quantity of proteins ingested than by the other variables. This is in agreement with the results of Lilly (1975) and Lowe & Lawrence (1976), who also observed that the amount
Mar Ecol Prog Ser 204: 131–141, 2000
140
of protein ingested best defines growth. Conversely, Frantzis (1992) thought that the growth of Paracentrotus lividus was best explained by the quantity of organic matter absorbed. Acknowledgements. We thank John M. Lawrence and Gilbert Barnabé for their comments on a earlier draft of this manuscript, and 3 anonymous referees for valuable criticism. Thanks to Dr Joel Le Campion, Station Marine d’Endoume, for his help in the statistical aspects of this study. The authors wish to thank Luc Bronzini de Caraffa, manager of the SCORSA Company, who permitted us to work in the Urbinu lagoon. Finally, we express our gratitude to Dr Denise Viale, University of Corsica, for providing the laboratory facilities. This research was supported by a grant from the regional government of Corsica and the Agence National de Valorisation de la Recherche (ANVAR).
LITERATURE CITED Allain JY (1978) Age et croissance de Paracentrotus lividus (Lmk) et de Psammechinus miliaris (Gmelin) des côtes nord de Bretagne (Echinoïdea). Cah Biol Mar 19(1):11–21 Anderson RJ, Velimirov B (1982) An experimental investigation of palatability of kelp bed algae to the sea urchin Parechinus angulosus Leske. PSZN I: Mar Ecol 3(4):357–373 Azzolina JF (1988) Contribution à l’étude de la dynamique des populations de l’oursin comestible Paracentrotus lividus (Lamarck). Croissance, recrutement, mortalité, migrations. PhD thesis, Univ Aix-Marseille II Buxton CD, Field JG (1983) Feeding, defecation and absorption efficiency in the sea urchin, Parechinus angulosus Leske. S Afr J Zool 18(1):11–14 Dajoz R (1985) Précis d’écologie. Dunod Publ, Paris De Ridder C, Lawrence JM (1982) Food and feeding mechanisms. In: Jangoux M, Lawrence JM (eds) Echinoderm nutrition. Balkema Publ, Rotterdam, p 57–92 Ebert TA (1980) Relative growth of sea urchin jaws: an example of plastic resource allocation. Bull Mar Sci 30:467–474 Ebert TA (1988) Allometry, design and contraint of body components and of shape in sea urchins. J Nat Hist 22: 1407–1425 Emlen JM (1968) Optimal choice in animals. Am Nat 102: 385–389 Fernandez C, Boudouresque CF (1997) Phenotypic plasticity of Paracentrotus lividus (Echinoidea: Echinodermata) in a lagoonal environment. Mar Ecol Prog Ser 152:145–154 Fernandez C, Caltagirone A (1994) Growth rate of adult Paracentrotus lividus in a lagoon environment: the effect of different diet types. In: David B, Guille A, Féral JP, Roux M (eds) Echinoderms through time. Balkema Publ, Rotterdam, p 655–660 Fernandez C, Caltagirone A (1998) Comportement alimentaire de Paracentrotus lividus (Echinodermata: Echinoidea) en milieu lagunaire. Rapp Comm Int Mer Médit 35:538–539 Fernandez C, Pergent G (1998) Effect of diet and rearing condition on growth parameters in the sea urchin Paracentrotus lividus. J Shellfish Res 17(5):1571–1581 Fernandez C, Dombrowski E, Caltagirone A (1995) Gonadic growth of adult sea urchin Paracentrotus lividus (Echinodermata: Echinoidea) in rearing: the effect of different diet type. In: Emson R, Smith A, Campbell A (eds) Echinoderms research 1995. AA Balkema, Rotterdam, p 269–275
Frantzis A (1992) Etude expérimentales des niveaux de consommation et d’utilisation des macrophytes et des détritus dérivés par deux invertébrés benthiques: Paracentrotus lividus (Echinoide, herbivore) et Abra ovata (Bivalve, dépositivore). PhD thesis, Univ Aix-Marseille II Frantzis A, Grémare A (1992) Ingestion, absorption, growth rate of Paracentrotus lividus (Echinodermata: Echinoïdea) fed different macrophytes. Mar Ecol Prog Ser 95:169–183 Fuji A (1967) Ecological studies on the growth and food consumption of Japanese common littoral sea urchin Strongylocentrotus intermedius (Agassiz). Mém Fac Fish Univ Hokkaïdo 15(2):83–160 George SB (1996) Echinoderm egg and larval quality as a function of adult nutritional state. Oceanol Acta 19(3–4): 297–308 Gonor JJ (1973) Reproductive cycles in Oregon populations of the echinoid Strongylocentrotus purpuratus (Stimpson). Annual gonad growth and ovarian gametogenic cycles. J Exp Mar Biol Ecol 12:45–64 Gonzalez ML, Perez MC, Lopez DA, Pino CA (1993) Effect of algal diet on the energy available for growth of juvenile sea urchin Loxechinus albus (Molina, 1782). Aquaculture 115:87–95 Hawkins SJ, Hartnoll RG (1983) Grazing of intertidal algae by marine invertebrates. Oceanogr Mar Biol Annu Rev 21: 195–282 Heral M (1986) L’ostréiculture française traditionnelle. In: Barnabé G (ed) Aquaculture, Vol 1 (1st edn). Lavoisier Tech & Doc Publ, Paris, p 345–390 Kempf M (1962) Recherches d’écologie comparée sur Paracentrotus lividus (Lmk.), Arbacia lixula (L.). Rec Trav Stn Mar Endoume Fac Sci Mars 25(39):47–116 Klinger TS, Lawrence JM (1984) Phagostimulation of Lytechinus variegatus (Lamarck) (Echinodermata: Echinoidea). Mar Behav Physiol 11:49–67 Klinger TS, Lawrence JM (1985) Distance perception of food and the effect of food quantity on feeding behavior of Lytechinus variegatus (Lamarck) (Echinodermata: Echinoidea). Mar Behav Physiol 11:327–344 Klinger TS, Hsielh HL, Pangallo A, Chen CP, Lawrence JM (1986) The effect of temperature on feeding, digestion, and absorption of Lytechinus variegatus (Lamarck) (Echinodermata: Echinoïdea). Physiol Zool 59(3):332–336 Klinger TS, Lawrence JM, Lawrence AL (1994) Digestive characteristics of the sea-urchin Lytechinus variegatus (Lamarck) (Echinodermata: Echinoidea) fed prepared feeds. J World Aquacult Soc 25(4):489–496 Lares MT, McClintock JB (1991) The effect of temperature on the survival, organismal activity, nutrition, growth, and reproduction of the carnivorous Eucidaris tribuloides. Mar Behav Physiol 19(2):75–96 Lawrence JM (1975) On the relationships between marine plants and sea-urchins. Oceanogr Mar Biol Annu Rev 13: 213–286 Lawrence JM (1976) Absorption efficiencies of four species of tropical echiniods fed Thalassia testudinum. Thalassia Jugosl 12(1):201–205 Lawrence JM (1982) Digestion. In: Jangoux M, Lawrence JM (eds) Echinoderm nutrition. Balkema Publ, Rotterdam, p 283–316 Lawrence JM, Lane JM (1982) The utilization of nutrients by post metamorphic echinoderms. In: Jangoux M, Lawrence JM (eds) Echinoderm nutrition. AA Balkema, Rotterdam, p 331–371 Lawrence JM, Lawrence AL, Holland ND (1965) Annual cycle in the size of the gut of the purple sea urchin, Strongylocentrotus purpuratus (Stimpson). Nature 205(4977):1238–1239
Fernandez & Boudouresque: Nutrition of the sea urchin Paracentrotus lividus
141
Lawrence JM, Regis MB, Delmas P, Gras G, Klinger T (1989) The effect of quality of food on feeding and digestion in Paracentrotus lividus (Lamarck) (Echinodermata: Echinoidea). Mar Behav Physiol 15:137–144 Leighton DL (1968) A comparative study of food selection and nutrition in the abalone Haliotis rufescens (Swainson) and the sea urchin Strongylocentrotus purpuratus (Stimpson). PhD thesis, Univ California, San Diego Levitan DR (1991) Skeletal changes in the test and jaws of the sea urchin Diadema antillarum in response to food limitation. Mar Biol 11:431–435 Lilly GR (1975) The influence of diet on the growth and bioenergetics of the tropical sea urchin, Tripneustes ventricosus (Lamarck). PhD thesis, Univ of British Columbia, Vancouver Litchko MA, Martin KA, Klinger TS (1990) Digestion respiration and movement of Eucidaris tribuloides (Lamarck) (Echinodermata: Echinoidea) fed plant or animal material. Northeast Gulf Sci 11(1):87 Lowe EF, Lawrence JM (1976) Absorption efficiencies of Lytechinus variegatus (Lamarck) (Echinodermata: Echinoidea) for selected marine plants. J Exp Mar Biol Ecol 21: 223–234 Lumingas LJL (1994) La plasticité chez l’oursin Sphaerechinus granularis en rade de Brest (Bretagne, France). PhD thesis, Univ Bretagne Occidentale Mai K, Mercer JP (1991) Studies on the nutrition of abalone, Haliotis tuberculata, Haliotis hannai and sea urchin Paracentrotus lividus. Report 1. Shellfish Research Laboratory, University College Galway McClintock JB (1986) On estimating energetic values of prey: implication on optimal diet models. Oecologia 770: 161–162 McShane PE, Anderson OF (1997) Resource allocation and growth rates in the sea urchin Evechinus chloroticus (Echinoidea: Echinometridae). Mar Biol 128(4):657–663
Ménager V, Puddy L, Boudouresque CF (1995) The daily intake and degree of absorption of the sea urchin Paracentrotus lividus fed upon Caulerpa taxifolia (Chlorophyta), Cystoseira compressa and Halopteris scoparia (Fucophycea). Rapp Comm Int Mer Médit 34:36 Miller RJ, Mann KH (1973) Ecological energetic of seaweed zone in a marine bay on the Atlantic coast of Canada. III. Energy transformation by sea urchins. Mar Biol 18:99–114 Moore HB, McPherson BF (1965) A contribution to the study of the productivity of the urchins Tripneustes esculensus and Lytechinus variegatus. Bull Mar Sci 15(4):855–869 Mukai H, Nojima S (1985) A preliminary study on grazing and defecation rates of sea grass grazer, Tripneustes gratilla (Echinodermata: Echinoidea) in a Papua New Guinean seagrass beds. Spec Publ Mukaishima Mar Biol Stn, p 185–192 Percy JA (1971) Thermal acclimatation in the echinoid, Strongylocentrotus droebachiensis (O. F. Muller, 1776). PhD thesis, Mem Univ St John’s, Newfoundland Thompson RJ (1982) The relationship between food ration and reproductive effort of the green sea urchin, Strongylocentrotus droebachiensis. Oecologia 56:50–57 Turon X, Gibiret G, Lopez S, Palacin C (1995) Growth and population structure of Paracentrotus lividus (Echinodermata: Echinoidea) in two contrasting habitats. Mar Ecol Prog Ser 122:193–204 Vadas RL (1977) Preferential feeding: an optimization strategy in sea urchins. Ecol Monogr 47:337–371 Valiela I (1995) Marine ecological processes, 2nd edn. Springer-Verlag, New York Verlaque M (1987) Relations entre Paracentrotus lividus (Lmk.) et le phytobenthos de Méditerranée occidentale. In: Boudouresque CF (ed) Colloque international sur Paracentrotus lividus et les oursins comestibles. GIS Posidonie Publ, Marseille, p 5–36
Editorial responsibility: Otto Kinne (Editor), Oldendorf/Luhe, Germany
Submitted: March 29, 1999; Accepted: October 26, 1999 Proofs received from author(s): September 14, 2000