Discussion Paper
The Cryosphere Discuss., 9, 4067–4116, 2015 www.the-cryosphere-discuss.net/9/4067/2015/ doi:10.5194/tcd-9-4067-2015 © Author(s) 2015. CC Attribution 3.0 License.
This discussion paper is/has been under review for the journal The Cryosphere (TC). Please refer to the corresponding final paper in TC if available.
|
, D. E. Shean
1
3
1
, A. Campbell , M. Fahnestock , and S. D. Malone
1
University of Washington, Department of Earth and Space Sciences, Washington, USA 2 University of Washington, Applied Physics Lab Polar Science Center, Washington, USA 3 University of Alaska Fairbanks, Geophysical Institute, Fairbanks, Alaska, USA a now at: USGS Geologic Hazards Science Center, Golden, CO, USA
Published by Copernicus Publications on behalf of the European Geosciences Union.
|
4067
Discussion Paper
Correspondence to: K. E. Allstadt (
[email protected])
|
Received: 16 June 2015 – Accepted: 9 July 2015 – Published: 31 July 2015
Observations of seasonal and diurnal glacier velocities at Mount Rainier, Washington K. E. Allstadt et al.
Title Page
Discussion Paper
1,2
9, 4067–4116, 2015
|
K. E. Allstadt
1,a
Discussion Paper
Observations of seasonal and diurnal glacier velocities at Mount Rainier, Washington using terrestrial radar interferometry
TCD
Abstract
Introduction
Conclusions
References
Tables
Figures
J
I
J
I
Back
Close
Full Screen / Esc Printer-friendly Version Interactive Discussion
5
4068
|
Discussion Paper
Direct observations of alpine glacier velocity can help improve our understanding of ice dynamics. Alpine glacier surface velocities are typically dominated by basal sliding, which is tightly coupled to subglacial hydrology (Anderson et al., 2004; Bartholomaus et al., 2007). However, the spatial extent and spatial/temporal resolution of direct measurements are often limited to short campaigns with sparse point measurements in accessible regions (e.g., Hodge, 1974; Driedger and Kennard, 1986). Remote sensing can help overcome many of these limitations. Radar interferometry, a form of active re-
|
25
9, 4067–4116, 2015
Observations of seasonal and diurnal glacier velocities at Mount Rainier, Washington K. E. Allstadt et al.
Title Page
Discussion Paper
20
Introduction
TCD
|
1
Discussion Paper
15
|
10
We present spatially continuous velocity maps using repeat terrestrial radar interferometry (TRI) measurements to examine seasonal and diurnal dynamics of alpine glaciers at Mount Rainier, Washington. We show that the Nisqually and Emmons glaciers have −1 small slope-parallel velocities near the summit (< 0.2 m day ), high velocities over −1 their upper and central regions (1.0–1.5 m day ), and stagnant debris-covered regions near the terminus (< 0.05 m day−1 ). Velocity uncertainties are as low as ±0.02– 0.08 m day−1 . We document a large seasonal velocity decrease of 0.2–0.7 m day−1 (−25 to −50 %) from July to November for most of the Nisqually glacier, excluding the icefall, suggesting significant seasonal subglacial water storage under most of the glacier. We did not detect diurnal variability above the noise level. Preliminary 2-D ice flow modeling using TRI velocities suggests that sliding accounts for roughly 91 and 99 % of the July velocity field for the Emmons and Nisqually glaciers, respectively. We validate our observations against recent in situ velocity measurements and examine the long-term evolution of Nisqually glacier dynamics through comparisons with historical velocity data. This study shows that repeat TRI measurements with > 10 km range can be used to investigate spatial and temporal variability of alpine glacier dynamics over large areas, including hazardous and inaccessible areas.
Discussion Paper
Abstract
Abstract
Introduction
Conclusions
References
Tables
Figures
J
I
J
I
Back
Close
Full Screen / Esc Printer-friendly Version Interactive Discussion
4069
|
9, 4067–4116, 2015
Observations of seasonal and diurnal glacier velocities at Mount Rainier, Washington K. E. Allstadt et al.
Title Page
Discussion Paper | Discussion Paper
25
TCD
|
20
Discussion Paper
15
|
10
Discussion Paper
5
mote sensing, detects mm- to cm- scale displacements between successive images of the same scene and can see through clouds and fog. In the past few decades, satellite interferometric synthetic aperture radar, or InSAR (e.g., Massonnet and Feigl, 1998; Burgmann et al., 2000) has emerged as an invaluable tool for quantifying glacier dynamics (e.g., Joughin et al., 2010). However, limited data availability and revisit times limit the application of InSAR for the study of many short-term processes. Terrestrial radar interferometry (TRI), also referred to as ground-based radar interferometry, has recently emerged as a powerful technique for observing glacier displacement that is not prone to the same limitations (Caduff et al., 2014). Sets of radar data acquired at as low as ∼ 1 min intervals from up to several km away allow for observations of velocity changes over short timescales and large spatial extents, while stacking these large numbers of interferogram pairs over longer timescales can significantly reduce noise. Here, we employ this relatively new technique to provide spatiallyand temporally-continuous surface velocity observations for several glaciers at Mount Rainier volcano in Washington State (Fig. 1). Though Rainier’s glaciers are among the best-studied alpine glaciers on earth (Heliker et al., 1984; Nylen, 2004), there are many open questions about diurnal and seasonal dynamics that TRI can help address, especially for inaccessible locations like the Nisqually icefall and ice cliff. In this study we gain new insight on the evolution of this hydrological network through analysis of the relative magnitude and spatial patterns of surface velocity over diurnal and seasonal timescales. To our knowledge, no other studies have investigated seasonal changes to glacier dynamics using TRI. Mount Rainier offers an excellent setting for TRI, with several accessible viewpoints offering a near-continuous view with ideal line-of-sight vectors for multiple glaciers and well-distributed static bedrock exposures for calibration. The ability to image the velocity field of entire glaciers from one viewpoint with minimal shadowing sets this study area apart. Most previous studies only image part of the glaciers under investigation, usually due to less favorable viewing geometries (e.g., Noferini et al., 2009; Voytenko et al., 2015; Riesen et al., 2011). However, the steep topography and local climatic factors at
Abstract
Introduction
Conclusions
References
Tables
Figures
J
I
J
I
Back
Close
Full Screen / Esc Printer-friendly Version Interactive Discussion
Discussion Paper |
4070
|
25
With a summit elevation of 4392 m, Mount Rainier (Fig. 1) is the largest stratovolcano in the Cascades and is considered the most dangerous volcano in the US (Swanson et al., 1992). It also holds the largest concentration of glacial ice in the mainland US 2 (Driedger and Kennard, 1986): 87 km is covered with perennial snow and ice as of 2008 (Sisson et al., 2011). The steep upper sections of the major glaciers are relatively thin, with typical thicknesses of ∼ 30 to 80 m (Driedger and Kennard, 1986). Thickness increases at lower elevations, with a maximum of ∼ 200 m for the Carbon glacier, although these estimates likely provide an upper bound, as these glaciers have ex-
9, 4067–4116, 2015
Observations of seasonal and diurnal glacier velocities at Mount Rainier, Washington K. E. Allstadt et al.
Title Page
Discussion Paper
20
Study area
TCD
|
2
Discussion Paper
15
|
10
Discussion Paper
5
Mount Rainier result in strong atmospheric variability and turbulence – a major source of noise for radar interferometry techniques (Goldstein, 1995). Atmospheric noise is a particular issue for the long ranges (> 10 km) associated with accessible viewpoints at Mount Rainier. We successfully combine, expand on, and evaluate noise reduction techniques such as stacking interferograms (e.g., Voytenko et al., 2015) and using stable rock points to fit and subtract atmospheric noise (e.g., Noferini et al., 2009). We demonstrate the significant reductions in velocity uncertainties these techniques yield with a new bootstrapping approach that does not require stable rock points (e.g., Voytenko et al., 2015). In the following sections, we provide background on Mount Rainier’s glaciers, and detail our sampling methodology and data processing techniques. We then present TRI results documenting seasonal and diurnal velocity variations for the Nisqually, Wilson, and Emmons Glaciers, and quantify measurement uncertainty. Next we examine the partitioning of observed surface velocities between deformation and basal sliding at different times of year using a simple 2-D flow model, and compare our observations to other recent and historical velocity measurements. These comparisons provide ground truth for TRI measurements and new insight into the evolution of the Nisqually glacier since the late 1960s.
Abstract
Introduction
Conclusions
References
Tables
Figures
J
I
J
I
Back
Close
Full Screen / Esc Printer-friendly Version Interactive Discussion
4071
|
9, 4067–4116, 2015
Observations of seasonal and diurnal glacier velocities at Mount Rainier, Washington K. E. Allstadt et al.
Title Page
Discussion Paper | Discussion Paper
25
TCD
|
20
Discussion Paper
15
|
10
Discussion Paper
5
perienced significant thinning in recent decades, losing 14 % of their volume between 1970 and 2008 (Sisson et al., 2011). Mass balance stake measurements from 2003– 2010 show that the average winter balance for Nisqually was 2.4 m water equivalent (m.w.e.), average summer balance was −3.5 m.w.e., and cumulative net balance was −8.6 m.w.e. from 2003–2011 (Riedel, 2010; Riedel and Larrabee, 2015). The glaciers of Mt. Rainier have been of interest to geoscientists for over 150 years and have a long record of scientific observation (Heliker, 1984). In this study, we focus on large, accessible, well-documented glaciers in the park: the Nisqually and Wilson glaciers on the southern flank, and Emmons and Upper Winthrop glaciers on the northeastern flank (Fig. 1). The Nisqually Glacier is visible from several viewpoints near the Paradise Visitor Center, which is accessible year-round. The terminus location has been measured annually since 1918, and three transverse surface elevation profiles have been measured nearly every year since 1931 (Heliker, 1984). Veatch (1969) documented a 24 year history of Nisqually’s advances and retreats and other dynamic changes through a meticulous photographic survey from 1941–1965. Hodge (1974) conducted a detailed 2 year field study of the seasonal velocity cycle for the lower Nisqually. He found that velocities varied seasonally by about 50 %, with maximum velocities in the spring (June) and minimum in the fall (November). This finding, and the lack of correlation between runoff and sliding speeds, advanced the idea that efficient conduits close as meltwater input decreases in the fall, leading to distributed subglacial storage through the fall, winter and spring. Increased surface melting in spring and summer leads to increased subglacial discharge and the opening of a more efficient network of conduits capable of releasing some of this stored water (Hodge, 1974). Walkup et al. (2013) tracked the movements of supraglacial rocks with high precision from 2011–2012, yielding velocity vectors for a wide network of points over the lower parts of Nisqually glacier. The Emmons glacier, visible from the Sunrise Visitors Center, has received less attention than Nisqually, despite the fact that it is the largest glacier on the mountain in terms of area (Driedger and Kennard, 1986), mainly because it is not as easily accessi-
Abstract
Introduction
Conclusions
References
Tables
Figures
J
I
J
I
Back
Close
Full Screen / Esc Printer-friendly Version Interactive Discussion
5
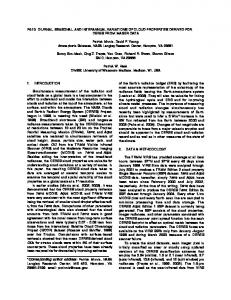
In this study, we employed the GAMMA portable radar interferometer (GPRI) (Werner et al., 2008, 2012) – a ground-based, frequency-modulated continuous waveform (FMCW) radar that can capture mm-scale surface displacements. The instrument includes three 2 m antennas mounted on a vertical truss, with one transmit antenna 35 cm above the upper of two receiving antennas spaced 25 cm apart (Fig. 2). The ◦ ◦ transmit antenna produces a 35 vertical beam with 0.4 width that azimuthally sweeps across the scene to build a 2-D radar image as the truss rotates. The radar operates at a center frequency of 17.2 GHz, with selectable chirp length of 2–8 ms and bandwidth of 25 to 200 MHz. The radar wavelength is 0.0176 m with range resolution of ∼ 0.75 cm and one-way interferometric change sensitivity of 8.7 mm cycle−1 of phase providing < 1 mm line-of-sight precision. Line-of-sight interferograms are generated by compar-
|
4072
Discussion Paper
25
Instrument description
|
20
9, 4067–4116, 2015
Observations of seasonal and diurnal glacier velocities at Mount Rainier, Washington K. E. Allstadt et al.
Title Page
Methods
Discussion Paper
15
TCD
|
3.1
Discussion Paper
3
|
10
3
Discussion Paper
7
ble as Nisqually. A large rock fall (∼ 1.1×10 m ) from Little Tahoma in December 1963 covered much of the lower Emmons glacier with a thick debris layer (Crandell and Fahnestock, 1965). The insulating debris cover likely contributed to the advance and thickening of the Emmons Glacier from 1970–2008, while all other glaciers on Mount Rainier experienced significant thinning (Sisson et al., 2011). Average 2003–2010 winter balance for Emmons was 2.3 m.w.e., average summer balance was −3.2 m.w.e, and cumulative net balance was −7.7 m.w.e. from 2003–2011 (Riedel, 2010; Riedel and Larrabee, 2015). The National Park Service’s long-term monitoring protocols include both the Nisqually and Emmons glaciers and involve regular photographs, annual mass balance measurements, meltwater discharge rates, plus area and volume change estimates every decade (Riedel, 2010; Riedel and Larrabee, 2015).
Abstract
Introduction
Conclusions
References
Tables
Figures
J
I
J
I
Back
Close
Full Screen / Esc Printer-friendly Version Interactive Discussion
3.2
5
| Discussion Paper |
4073
9, 4067–4116, 2015
Observations of seasonal and diurnal glacier velocities at Mount Rainier, Washington K. E. Allstadt et al.
Title Page
Discussion Paper
25
TCD
|
20
Discussion Paper
15
We performed four data collection campaigns in 2012 (Table 1). The first campaign occurred on 6–7 July 2012. This timing corresponds to just after the expected peak glacier velocities at Mount Rainier (Hodge, 1974). Following the success of this study, three subsequent deployments were performed during the late fall and early winter, which should capture near-minimum seasonal velocity (Hodge, 1974). These campaigns were timed to occur before, immediately after, and a few weeks after the first heavy snowfall of the season (2 November 2012, 27 November 2012 and 10 December 2012, respectively). Three viewpoints were selected for data collection: GLPEEK and ROI, which overlook the Nisqually and Wilson glaciers, and SUNRIZ, which overlooks the Emmons and upper Winthrop glaciers (Fig. 1). ROI and SUNRIZ were directly accessible from park roads, which greatly facilitated instrument deployment, and GLPEEK was accessed on foot. ROI was occupied during all campaigns, while SUNRIZ and GLPEEK were only occupied during the July 2012 campaign because of access limitations. Figures A1–A3 show the field of view from each viewpoint. Distances from the GPRI to the summit were 6.7, 7.6, and 10.8 km from GLPEEK, ROI and SUNRIZ, respectively. Radar images were continuously collected with a 3 min interval for all surveys. Total acquisition time at each site was dictated by logistics (weather conditions, personnel), with ∼ 24 h acquisitions at SUNRIZ and ROI to capture diurnal variability. The instrument was deployed on packed snow during the 6 July 2012 GLPEEK and 27 November and 10 December 2012 ROI acquisitions. Over the course of the GLPEEK survey, we noted limited snow compaction and melt beneath the GPRI tripod with total displacement of ∼ 2–4 cm over ∼ 6 h. However, this instrument motion proved
|
10
Survey description
Discussion Paper
ing phase differences in successive acquisitions from the same viewpoint. Short repeat acquisition intervals of tens of seconds to minutes ensure high coherence.
Abstract
Introduction
Conclusions
References
Tables
Figures
J
I
J
I
Back
Close
Full Screen / Esc Printer-friendly Version Interactive Discussion
Discussion Paper
5
to be negligible for the interferogram interval used (6 min). No snow compaction was noted during the fall/winter surveys. Weather conditions during the July 2012 surveys were clear with light/variable wind. The 2 November 2012 survey involved high-altitude clouds, passing showers and brief interruptions in data collection. Weather conditions were clear with sun for the 27 November 2012 campaign, and fog with limited visibility on 10 December 2012.
|
3.3
|
4074
Discussion Paper
25
Slight changes in the dielectric properties of the atmosphere between the GPRI and target surfaces can lead to uncertainty in the interferometric displacement measurements (Zebker et al., 1997; Werner et al., 2008). Changes in atmospheric humidity, temperature, and pressure can all affect radar propagation velocity, which determines the two-way travel time (Goldstein, 1995). These variations are manifested as phase offsets in the received radar signal, which must be isolated from phase offsets related to true surface displacements. This atmospheric noise proved to be significant for the long range (∼ 22 km two-way horizontal path at SUNRIZ), mountainous terrain (∼ 2.4 km vertical path from SUNRIZ
|
20
Atmospheric noise corrections
Observations of seasonal and diurnal glacier velocities at Mount Rainier, Washington K. E. Allstadt et al.
Title Page
Discussion Paper
3.3.1
9, 4067–4116, 2015
|
15
All radar data were processed with the GAMMA SAR and Interferometry software suite. Multi-look intensity (mli) products were generated from original single-look complex (slc) data by averaging 15 samples in the range direction. Interferograms were generated from the mli products with a time separation of 6 min, though sometimes longer if acquisition was interrupted (for example images, see Fig. A4). A correlation threshold filter of 0.7 and an adaptive bandpass filter (ADF) with default GAMMA parameters were applied to the interferograms to improve phase unwrapping. Phase unwrapping was initiated in areas with high correlation scores and negligible deformation, such as exposed bedrock or stagnant ice.
Discussion Paper
10
Data processing
TCD
Abstract
Introduction
Conclusions
References
Tables
Figures
J
I
J
I
Back
Close
Full Screen / Esc Printer-friendly Version Interactive Discussion
4075
|
9, 4067–4116, 2015
Observations of seasonal and diurnal glacier velocities at Mount Rainier, Washington K. E. Allstadt et al.
Title Page
Discussion Paper | Discussion Paper
25
TCD
|
20
Discussion Paper
15
|
10
Discussion Paper
5
to summit), and turbulent atmosphere involved with this study, with the magnitude of this noise often exceeding that of surface displacement signals. In order to minimize this atmospheric noise in the individual interferograms, we interpolated apparent displacement values over static control surfaces (e.g., exposed bedrock) via Delauney triangulation. A subset (5 %) of pixels over exposed bedrock was resampled randomly for each unwrapped interferogram and the interpolated result was smoothed to reduce artifacts. These corrections were applied to all individual interferograms, and the resulting products were stacked to further reduce noise. The median line-of-sight (LOS) velocities from this stack provide a single measurement with a high signal to noise ratio for the entire sampling period. In addition to computing these campaign median LOS velocities, we also computed a running mean of the LOS velocities to characterize any short-term velocity variations in the extended occupation datasets: 7–8 July SUNRIZ (24 h) and 1–2 November ROI (21 h). The running mean was computed every 0.3 h with a 2 h centered (acausal) window, with standard error used to estimate uncertainty. Interferograms with significant phase unwrapping errors, low correlations, or anomalous noise were excluded from stacking. Only a few images were deleted for each site for these reasons with the exception of SUNRIZ, which produced many images with anomalous noise and unwrapping errors, possibly due to instrument noise and/or the extended range through significant atmospheric disturbance. For this reason, more than half of the data from SUNRIZ was excluded from the analysis (Table 2). For GLPEEK and ROI, interferograms with occasional localized unwrapping errors were preserved during stacking, as they have little influence on the final stack median. However, localized areas with persistent unwrapping errors in the SUNRIZ data were −1 masked using a threshold standard deviation filter of 0.6 m day . We estimated median LOS velocity uncertainties using a bootstrapping approach (Efron, 1979). This involved resampling the set of images used in the stack with replacement 1000 times for each campaign. Then, for each pixel, the 25th and the 975th ordered values were set as the lower and upper bounds of the 95 % confidence interval.
Abstract
Introduction
Conclusions
References
Tables
Figures
J
I
J
I
Back
Close
Full Screen / Esc Printer-friendly Version Interactive Discussion
5
Discussion Paper |
4076
|
While the line-of-sight vectors for these surveys are roughly aligned with surface displacement vectors (median incidence angles for glacier surfaces are ∼ 22◦ for ◦ ◦ GLPEEK, ∼ 25 for SUNRIZ and ∼ 26 for ROI), glaciological analyses typically require horizontal and vertical velocity components relative to the glacier surface. As each GPRI survey offers only a single look direction, this is not possible. However, we can assume that displacement is dominated by surface-parallel flow, and use an existing DEM to extract surface slopes needed to estimate 3-D displacement vectors (Joughin et al., 1998). This approach is intended for relatively smooth, continuous surface slopes over length scales > 2–3× ice thickness. It is therefore possible that the slope-parallel correction can overestimate velocity for steep, high relief surfaces with significant highfrequency topographic variability (e.g., icefalls). The slope-parallel assumption also be-
9, 4067–4116, 2015
Observations of seasonal and diurnal glacier velocities at Mount Rainier, Washington K. E. Allstadt et al.
Title Page
Discussion Paper
25
Correction to slope-parallel velocities
TCD
|
20
3.3.3
Discussion Paper
15
For campaign intercomparison, we developed a sensor model and tools to terraincorrect the stacked GPRI data (in original azimuth, range coordinates) using an exist−1 ing 2 m pixel airborne 2008 LiDAR digital elevation model (DEM) for Mount Rainier (Robinson et al., 2010). While some elevation change has undoubtedly occurred for glacier surfaces between September 2008 and July 2012, the magnitude of these changes (< 20 m) is negligible for orthorectification purposes given the GPRI acquisition geometry. A single control point identified over exposed bedrock in the LiDAR DEM and the multi-look image (mli) radar data was used to constrain absolute az−1 imuth orientation information for each campaign. A ∼ 10 m pixel (mean of azimuth and range sample size) grid in UTM 10N (EPSG: 32610) was created for each campaign, with extent computed from the GPRI GPS coordinates, min/max range values, and min/max absolute azimuth values. Each 3-D pixel in this grid was then populated by extracting the radar sample with corresponding range and azimuth.
|
10
Conversion from radar coordinates to map coordinates
Discussion Paper
3.3.2
Abstract
Introduction
Conclusions
References
Tables
Figures
J
I
J
I
Back
Close
Full Screen / Esc Printer-friendly Version Interactive Discussion
ˆ Vsp = VLOS /(Sˆ · L)
Discussion Paper
(1)
ˆ is the dot product between the unit vector pointing directly downslope from where Sˆ · L ˆ and the unit vector pointing from each grid cell to the sensor (L). ˆ each grid cell (S) ◦ Regions where the angle between these two vectors exceeded 80 were masked to avoid dividing by numbers close to zero which could amplify noise.
|
10
Discussion Paper
5
gins to break down where the vertical flow velocity component becomes significant. This is expected in the upper accumulation and lower ablation zones, where the submergence and emergence velocities become more significant, respectively, but is less important near the ELA or locations where sliding dominates motion. We implement a slope-parallel correction by first downsampling the 2008 LiDAR DEM to 20 m pixel−1 and smoothing with a 15 × 15 pixel (∼ 300 m), 5-sigma Gaussian filter. The slope-parallel velocity (Vsp ) is defined as:
TCD 9, 4067–4116, 2015
Observations of seasonal and diurnal glacier velocities at Mount Rainier, Washington K. E. Allstadt et al.
Title Page
|
15
|
4077
Discussion Paper
25
The median stacks of surface-parallel velocity for all viewpoints and their respective estimated uncertainties are shown in Figs. 3–6. Overall, our results show that repeat TRI measurements can be used to document spatial and temporal variability of alpine glacier dynamics over large areas from > 10 km away. Our noise removal approach was successful in extracting a glacier displacement signal for all campaigns, with best results for Nisqually Glacier due to the shorter range from ROI and GLPEEK viewpoints and limited glacier width between control surfaces. The median width of the 95 % confidence interval for each stacked pixel is plotted in Figs. 3b and 5. Note near-zero values over exposed bedrock surfaces used to derive atmospheric noise correction. We were able to reduce uncertainties (half the median −1 confidence interval width) to about ±0.02 to ±0.08 m day over glacier surfaces for some campaigns, with uncertainty dependent on the total number of stacked images,
|
20
Results
Discussion Paper
4
Abstract
Introduction
Conclusions
References
Tables
Figures
J
I
J
I
Back
Close
Full Screen / Esc Printer-friendly Version Interactive Discussion
9, 4067–4116, 2015
Observations of seasonal and diurnal glacier velocities at Mount Rainier, Washington K. E. Allstadt et al.
Title Page
| Discussion Paper |
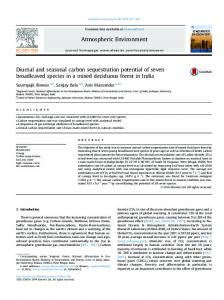
The 6–7 July 2012 observations show slope-parallel velocities that range from ∼ 0.0– 1.5 m day−1 for both the Nisqually and Emmons glaciers (Figs. 3a, 4 and 6). Both display high velocities over their upper and central regions that taper into stagnant (< 0.05 m day−1 ) debris-covered regions near the terminus. In general, slope-parallel −1 velocities near the summit are small (< 0.2 m day ). −1 On the Nisqually Glacier, a series of local velocity maxima (> 1.0 m day ) are associated with increased surface slopes between local surface highs. Local velocity maxima are also observed for the fast-flowing Nisqually icefall (western branch of Upper Nisqually, see Fig. 3) and above the Nisqually ice cliff (eastern branch). A relatively smooth velocity gradient from slow- to fast-moving ice is present upstream of the icefall, while the velocities above the ice cliff display a steep velocity gradient (Fig. 3). The main (south) branch of the Emmons glacier displays generally increasing velocity from the summit to lower elevations. A large high velocity region (> 0.7–1.1 m day−1 ) is present over central Emmons, downstream of the confluence of upper branches. These elevated velocities decrease at lower elevations, where ice thickness increases and surface slopes decrease (Fig. B1). A central faster channel of exposed ice surrounded by slow or stagnant debris-covered ice decreases to below our detection limit as it approaches the terminus. Velocities exceed 1 m day−1 over the “central” branch of the Upper Emmons Glacier, where flow is restricted between two parallel bedrock ridges, with local maxima similar 4078
Discussion Paper
25
July 2012 surface velocities
TCD
|
20
Discussion Paper
15
4.1
|
10
Discussion Paper
5
weather conditions, and target range (Table 2). For example, the 6 July 2012 ROI survey had a final confidence interval width of 0.11 m day−1 (∼ ±0.06 m day−1 ) while the −1 10 December 2012 ROI survey had a final confidence interval width of 0.15 m day −1 (∼ ±0.08 m day ) despite a 50 % increase in stack count. This is likely due to increased local atmospheric variability, as low-altitude clouds obscured the surface during 10 December 2012 survey. The 2 November 2012 ROI survey had the highest stack count (359) with the lowest uncertainty values of ±0.02 m day−1 (Table 2).
Abstract
Introduction
Conclusions
References
Tables
Figures
J
I
J
I
Back
Close
Full Screen / Esc Printer-friendly Version Interactive Discussion
| Discussion Paper
25
9, 4067–4116, 2015
Observations of seasonal and diurnal glacier velocities at Mount Rainier, Washington K. E. Allstadt et al.
Title Page
Discussion Paper
20
TCD
|
15
|
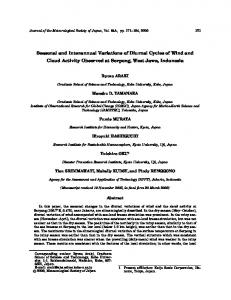
The repeat observations from the ROI viewpoint provide time series that capture seasonal velocity variability for the Nisqually, Wilson and Upper Kautz Glaciers. We observe significant velocity changes during the summer to winter transition and more subtle changes within the winter period. These changes are shown in map view on Fig. 4 and in profile view with corresponding slope and ice thickness on Fig. 6. These data show a velocity decrease of 0.2–0.7 m day−1 (−25 to −50 %) from July to November 2012 for most of the Nisqually Glacier. This includes central and lower Nisqually and the ice above the ice cliff. The greatest velocity decreases are observed near the crest and lee of surface rises (downstream of data gaps from radar shadows, Fig. 4), where some of the highest velocities were observed in July. In contrast, the area immediately downstream of the ice cliff and the area surrounding the icefall both display an apparent velocity increase for the same time period (Figs. 4 and 6). While the increase is less than the 95 % confidence interval for most areas, we can confidently state that the icefall and area below the ice cliff do not display the significant decrease in velocity observed elsewhere. The majority of the Wilson Glacier displays a similar ∼ 0.3–0.7 m day−1 (−40 to −60 %) velocity decrease from July to November. Interestingly, the steep transition where the Wilson merges with the Nisqually displays an apparent velocity increase −1 of ∼ 0.1 m day during this time period (Fig. 4). These data also reveal subtle velocity 4079
Discussion Paper
10
Seasonal variability
|
4.2
Discussion Paper
5
to Nisqually. Velocities at higher elevations within the “central” branch appear slower −1 (< 0.1–0.5 m day ), separated from the fast downstream velocities by a small area that was excluded due to phase unwrapping errors. Photographs show that this area appears heavily fractured with many large blocks indicative of rapid, discontinuous flow (Fig. A3). Smaller, relatively thin glaciers, such as the Fryingpan, Upper Kautz, and Inter −1 Glacier (labeled on Fig. 1), also display nonzero surface velocities of < 0.1–0.2 m day , but with limited spatial variability.
Abstract
Introduction
Conclusions
References
Tables
Figures
J
I
J
I
Back
Close
Full Screen / Esc Printer-friendly Version Interactive Discussion
Diurnal variability
Discussion Paper
4.3
|
10
Discussion Paper
5
increases in the debris-covered ice near the Nisqually terminus and the Upper Kautz glacier (Fig. 4), though these increases are statistically insignificant. The repeat winter observations of Nisqually show relatively constant velocities with some notable variability. Analysis of the 2 November to 10 December observations reveals a statistically significant −0.1 m day−1 (−50 %) velocity decrease ∼ 1 km upstream of the terminus (centered on ∼ 0.7 km in Fig. 6a profile), a +0.1 to +0.2 m day−1 (+20 to +30 %) increase over central Nisqually centered on ∼ 3.5 km in the Fig. 6D profile, −1 and an apparent +0.2 m day (+130 %) increase over the Upper Wilson. In the latter case, the 10 December velocities are actually higher than those observed in July. The slowdown over lower Nisqually appears robust, but other trends have amplitudes that are mostly below the 95 % confidence interval for the 27 November and 10 December observational campaigns (Fig. 4).
TCD 9, 4067–4116, 2015
Observations of seasonal and diurnal glacier velocities at Mount Rainier, Washington K. E. Allstadt et al.
Title Page
|
20
| Discussion Paper |
4080
Discussion Paper
15
We collected ∼ 21 and ∼ 24 h time series for the Emmons and Nisqually/Wilson Glaciers (Table 1) in July and November, respectively. Although uncertainties are large, we present the time series on Fig. 7. In general, velocities for these regions remain relatively constant during their respective sampling periods. The Emmons time series shows an apparent decrease in velocity over the central, fast-flowing regions (B, C, D in Fig. 7a) from ∼ 18:00 to 21:00 LT, and an apparent increase between ∼ 07:00 to 09:00 LT (Fig. 7a). The Nisqually time series shows an apparent decrease from ∼ 06:00 to 11:00 LT for the icefall and ice cliff, and an apparent decrease for several areas of the glaciers followed by an increase (Fig. 7b). However, uncertainties are large and none of these are statistically significant.
Abstract
Introduction
Conclusions
References
Tables
Figures
J
I
J
I
Back
Close
Full Screen / Esc Printer-friendly Version Interactive Discussion
5
| |
4081
Discussion Paper
25
Discussion
The continuous coverage of the TRI provides information about the spatial distribution of surface velocities and strain rates. Several local velocity maxima are apparent along the centerline of the Nisqually glacier and the central branch of the Emmons glacier. These velocity maxima are associated with surface crevasses and increased surface slopes, with peak velocities typically observed just upstream of peak slope val-
9, 4067–4116, 2015
Observations of seasonal and diurnal glacier velocities at Mount Rainier, Washington K. E. Allstadt et al.
Title Page
Discussion Paper
5
TCD
|
20
Discussion Paper
15
We now validate our TRI results against independent velocity measurements for the same time period. Walkup et al. (2013) performed repeat total station surveys to document the location of sparse supraglacial cobbles and boulders on the lower Nisqually glacier from 2011–2012. While measurement errors such as cobble rolling and sliding for these observations are difficult to document, the large sample size and relatively long measurement intervals allow for accurate surface velocity estimates. Figure 8 shows average velocity vectors measured by Walkup et al. (2013) for the period between 19 July and 11 October 2012, with corresponding surface-parallel velocity vectors from the 07 July and 02 November TRI surveys. In general, the velocity magnitudes appear similar, with the Walkup et al. (2013) measurements often falling between the 7 July and 2 November GPRI magnitude, as would be expected of a mean velocity spanning approximately the same period. The velocity directions are also relatively consistent, with greatest deviation near the ice margins and over small-scale local topography (e.g., ice-cored moraine near western margin), where surface-parallel flow assumptions break down. In general, the two techniques provide similar results and offer complementary data validation. However, since the Walkup et al. (2013) measurements were limited to accessible areas, they cannot be used to validate heavily crevassed areas, icefalls, and other hazardous dynamic areas generally higher on the mountain.
|
10
Comparison with independent velocity measurements
Discussion Paper
4.4
Abstract
Introduction
Conclusions
References
Tables
Figures
J
I
J
I
Back
Close
Full Screen / Esc Printer-friendly Version Interactive Discussion
Discussion Paper
5
ues (Fig. 6). They are likely related to accelerated flow downstream from local bedrock highs, However, the local velocity maxima at ∼ 2.1 km in Fig. 6 corresponds to a region of decreased surface slopes and increased ice thickness. This location also displayed significant seasonal velocity change, suggesting that variations in local subglacial hydrology could be a controlling factor here.
|
5.1
| Discussion Paper
25
Observations of seasonal and diurnal glacier velocities at Mount Rainier, Washington K. E. Allstadt et al.
Title Page
Discussion Paper
20
9, 4067–4116, 2015
|
15
|
Terrestrial radar interferometry offers new observations over dynamic, inaccessible areas that have received limited attention in previous studies (e.g., icefalls, ice cliffs). For example, the velocities above the Nisqually ice cliff display an abrupt transition from slow- to fast-moving ice (Fig. 4). The high strain rates associated with this transition are suggestive of crevasse opening and “detached slab” behavior rather than continuous flow, which is reflected in the heavily crevassed surface at this location. Our results show that the Nisqually icefall and the icefall at the convergence of the Wilson and Nisqually glaciers appear to increase in velocity from July to the winter months. This suggests that the icefalls may not be susceptible to the same processes that caused the seasonal velocity decrease over much of the rest of the glacier. This may indicate that there is a lack of local continuity through icefalls, which appears to prevent or dampen propagation of downstream seasonal velocity decreases. It could also indicate that the icefall is relatively well drained year-round, and is not significantly affected by seasonal changes in subglacial hydrology. Another potential explanation for the observed increase in velocity could be early winter snow accumulation on blocks within the icefall. Interestingly, in contrast to the icefall, the hanging glacier above the Nisqually ice cliff displayed a significant velocity decrease from July to November, despite similar steep surface slopes and crevasse density. This could potentially be related to the lack of backstress from downstream ice and an increased sensitivity to minor fluctuations in subglacial hydrology. Hanging glaciers are also thought to be the source of some of the 4082
Discussion Paper
10
Icefall and ice cliff dynamics
TCD
Abstract
Introduction
Conclusions
References
Tables
Figures
J
I
J
I
Back
Close
Full Screen / Esc Printer-friendly Version Interactive Discussion
5.2
5
| Discussion Paper |
4083
9, 4067–4116, 2015
Observations of seasonal and diurnal glacier velocities at Mount Rainier, Washington K. E. Allstadt et al.
Title Page
Discussion Paper
25
TCD
|
20
Discussion Paper
15
We expected to see significant variability over the 24 h July time series for Emmons, as atmospheric temperatures varied from 16 to 27 ◦ C at Paradise Visitors Center (∼ 1600 m.a.s.l), and skies remained cloud-free during data collection. We hypothesized that the resulting increase in meltwater input from late morning through late afternoon might produce an observable increase in sliding velocity. While the results potentially show a slight velocity decrease at higher elevations overnight, and a slight velocity increase in the morning (Fig. 7a, A–D), these changes are not statistically significant nor coincident with times expected to have highest melt input. The lack of a significant diurnal speedup suggests that the subglacial conduits are relatively mature by July, and are capable of accommodating the diurnal variations in meltwater flux without affecting basal sliding rates. We did not expect to see significant diurnal changes in the 21 h November time series for Nisqually (Fig. 7a), as atmospheric temperatures ranged between 2 and 6 ◦ C at Paradise Visitors Center (∼ 1600 m a.s.l.) and skies were partly-cloudy to overcast during data collection, so surface meltwater input should have been minimal. Our results show only a minor velocity decrease higher on the glacier in the morning hours but it is not statistically significant and does not occur at times we would expect increased meltwater. Though some of the subtle changes in the extended time series may reflect actual diurnal velocity variability, we cannot interpret these with confidence. This suggests that the magnitude of diurnal variability, if it exists, during these time periods is minor when compared to the observed seasonal changes. It also implies that other stacks derived from a subset of the day can be considered representative of the daily mean, and can be compared for seasonal analysis.
|
10
Lack of significant diurnal variability
Discussion Paper
repeating glacial earthquakes that are triggered by snow loading (Allstadt and Malone, 2014), which highlights their sensitivity to minor perturbations.
Abstract
Introduction
Conclusions
References
Tables
Figures
J
I
J
I
Back
Close
Full Screen / Esc Printer-friendly Version Interactive Discussion
5
| Discussion Paper |
4084
9, 4067–4116, 2015
Observations of seasonal and diurnal glacier velocities at Mount Rainier, Washington K. E. Allstadt et al.
Title Page
Discussion Paper
25
TCD
|
20
Discussion Paper
15
Surface ice flow can be partitioned into internal deformation and basal sliding components. We present simple, 2-D plan-view ice flow and sliding models constrained by the TRI slope-parallel velocity observations assess the importance of basal sliding for the glaciers in our study area and to connect changes in the observed flow field to the temporal and spatial evolution of subglacial hydrology. Sophisticated ice flow models (e.g., Gagliardini et al., 2013; Le Meur et al., 2004; Zwinger et al., 2007) can capture complete 3-D stress and velocity fields, but we do not consider these options due to residual uncertainty in ice thickness (∼ 5–25 %) and bedrock topography, as described in Appendix B. With improved bedrock topography and ice thickness data, it might be possible to use these more sophisticated models in the future to invert observations of surface velocity for basal shear stress. This would offer a much more accurate picture of the spatial and temporal variability of glacier sliding and thus illuminate the changes in subglacial hydrology. However, this is beyond the scope of this study so here we implement simple ice flow models to provide preliminary estimates of deformation and sliding contributions and leave more sophisticated modeling to future work. The deformation model uses the shallow ice approximation (SIA) (Cuffey and Paterson, 2010). The SIA is not well-suited for narrow mountain glaciers, so we modify it to simulate the effect of non-local conditions, such as lateral sidewall drag and longitudinal stretching using a weighting function based on Kamb and Echelmeyer (1986). The sliding model uses a Budd type sliding parameterization (Bindschadler, 1983) where the minimization technique solves for two parameters k and Neff . k is a temporally constant and spatially uniform coefficient that represents a coupling of the glacier to its bed, which could be affected by bedrock geology, sediment layer thickness, size, and distribution. Neff is the effective pressure, and is allowed to vary temporally with weak spatial dependence. We adjust k and Neff to produce a sliding velocity model that most closely matches the residual velocity (observed TRI velocity minus the modeled deformation
|
10
2-D flow modeling
Discussion Paper
5.3
Abstract
Introduction
Conclusions
References
Tables
Figures
J
I
J
I
Back
Close
Full Screen / Esc Printer-friendly Version Interactive Discussion
| Discussion Paper |
4085
9, 4067–4116, 2015
Observations of seasonal and diurnal glacier velocities at Mount Rainier, Washington K. E. Allstadt et al.
Title Page
Discussion Paper
25
TCD
|
20
Discussion Paper
15
|
10
Discussion Paper
5
velocity). A detailed description of the modeling methods is presented in Appendix B, model input parameters are summarized on Table 3. Figure 9 shows modeled deformation, sliding velocity residual (observations – deformation model), percentage sliding (sliding velocity residual as percentage of total velocity), modeled sliding velocity, and sliding velocity model mismatch for Nisqually glacier in July and November. Figure 10 shows corresponding output for Emmons. Table 4 summarizes the best fitting values of k and Neff for each survey period. The SIA deformation models suggest that most areas of both glaciers are moving almost entirely by sliding. The modeled glacier deformation alone is unable to account for the observed surface velocity during any of the observation periods. Only a median of 1 % area of the velocity field over the Nisqually glacier area can be explained by internal deformation in July, and only 2 % in November. These numbers are similar to those calculated by Hodge (1974), who estimated ∼ 5–20 % sliding for the upper third of the ablation area and 1–3 % at the equilibrium line, though the numbers are not directly comparable because Hodge (1974) did not include any area above the equilibrium line. The results for Emmons suggest that that sliding is slightly less important for the Emmons glacier, where a median of 9 % of the velocity field can be explained by deformation. However, there are a few regions where the observed surface velocity can be explained entirely or nearly entirely by internal deformation such as the relatively flat downstream portions of the Emmons glacier and the terminus of the Nisqually glacier where ice is thick, surface slopes are small, and observed velocities can be explained largely by deformation. The sliding models, on the other hand, offer a poor fit for the observations. The sliding model residual (Figs. 9e and 10e) provides a measure for goodness of fit, with 28 −1 and 19 % of the glacier area fitting the observations within ±0.1 m day for winter and summer models, respectively. If the residual threshold is increased to ±0.2 m day−1 , the model accounts for 46 and 60 % of the summer and winter models, respectively.
Abstract
Introduction
Conclusions
References
Tables
Figures
J
I
J
I
Back
Close
Full Screen / Esc Printer-friendly Version Interactive Discussion
| Discussion Paper |
4086
9, 4067–4116, 2015
Observations of seasonal and diurnal glacier velocities at Mount Rainier, Washington K. E. Allstadt et al.
Title Page
Discussion Paper
25
The observed seasonal velocity changes from July to November can be attributed to changes in glacier sliding, which in turn are driven by evolving englacial and subglacial hydrology (Fountain and Walder, 1998). During the spring-summer months, runoff from precipitation (i.e., rain) and surface snow/ice melt enters surface crevasses, moulins, and/or conduits near the glacier margins. This water travels through a series of englacial fractures, reservoirs and conduits, and eventually ends up in a subglacial network of channels and reservoirs between the ice and bed. Storage time and discharge rates within the subglacial system are variable, with water finally exiting the system through one or more proglacial streams at the terminus. This dynamic system is continuously evolving due to variable input, storage capacity, and output. In early July, ongoing snowmelt should produce high meltwater discharge that travels through a relatively efficient network of mature conduits. As discharge decreases later in the summer, these subglacial conduits/reservoirs close due to ice creep without high flow to keep them open through melting due to heat from viscous dissipation. By November, there should be little or no surface meltwater input and we would expect to see a minimum in basal sliding velocity (Hodge, 1974). This is consistent with the observed velocity decrease in Fig. 4. However, the deformation modeling results (Fig. 9) show
TCD
|
20
Seasonal velocity changes
Discussion Paper
15
5.4
|
10
Discussion Paper
5
Despite doing a poor job of fitting the data, the simple sliding models provide some useful insights. The pattern of the misfit is informative: in general, the sliding models over-predict sliding velocities near glacier margins and under-predict sliding velocities toward glacier centerlines. More importantly, the misfit suggests that there is significant spatial variation in the sliding behavior of these alpine glaciers that cannot be captured by sliding models with homogeneous bed properties and subglacial water pressure. Collecting better bed topography and ice thickness data and implementing more sophisticated models would yield better results but is beyond the scope of the current study.
Abstract
Introduction
Conclusions
References
Tables
Figures
J
I
J
I
Back
Close
Full Screen / Esc Printer-friendly Version Interactive Discussion
| Discussion Paper |
4087
9, 4067–4116, 2015
Observations of seasonal and diurnal glacier velocities at Mount Rainier, Washington K. E. Allstadt et al.
Title Page
Discussion Paper
25
TCD
|
20
Discussion Paper
15
|
10
Discussion Paper
5
that a significant sliding component is still present for most of the Nisqually glacier in November and December, when minimum surface velocities are expected. The spatial patterns of the velocity change observed between July and November can be used to infer the extent of basal sliding. This may provide some insight into subglacial water storage, since the deformation component of surface velocity should remain nearly the same year-round. Figure 4 indicates that almost the entire Nisqually glacier slows down significantly between July and November, suggesting that storage is occurring under most of the glacier below the icefall and ice cliff. Significant velocity decreases are observed near local surface rises (Fig. 4), where some of the highest velocities were observed in July. This suggests that there are likely subglacial cavities downstream of these areas with high basal water pressures that can support enhanced sliding during the summer. Hodge (1974) interpreted a delay in both the maximum summer velocity and minimum winter velocity between the terminus and ELA as a propagating “seasonal wave” −1 traveling ∼ 55 m day . While our sampling is limited, the continued 2 November to 27 November slowdown over the lower Nisqually near the terminus (Fig. 4f) could represent a delayed response to the significant slowdown over central Nisqually. This might be expected, as surface velocities near the terminus are dominated by internal deformation and should respond more slowly than areas dominated by basal sliding. The seasonal velocity changes are reflected in the sliding models, with best-fit sliding parameters (Table 4) indicative of seasonal changes in subglacial hydrology. The Nisqually Glacier experienced more sliding in July 2012 relative to November– December 2012, which corresponds to an increase in effective pressure Neff . This change in Neff is likely due to the lack of meltwater input into the subglacial hydrological system during the fall-winter.
Abstract
Introduction
Conclusions
References
Tables
Figures
J
I
J
I
Back
Close
Full Screen / Esc Printer-friendly Version Interactive Discussion
5
|
In this study, we used repeat TRI measurements to document spatially continuous velocities of the Emmons and Nisqually glaciers at Mount Rainier, WA. We produced −1 surface velocity maps that reveal speeds of > 1.0–1.5 m day over the upper and cen−1 tral regions of these glaciers, < 0.2 m day near the summit, and < 0.05 m day−1 over
|
4088
Discussion Paper
25
Conclusions
9, 4067–4116, 2015
Observations of seasonal and diurnal glacier velocities at Mount Rainier, Washington K. E. Allstadt et al.
Title Page
Discussion Paper
6
TCD
|
20
Discussion Paper
15
As described earlier, Hodge (1972, 1974) measured surface velocity for a network of centerline stakes on the lower Nisqually from 1968–1970. He documented a significant seasonal cycle with minimum velocities in November and maximum velocities in June. To put our velocity data in historical context, we digitized Hodge’s (1972) July and November 1969 surface velocity data at 19 stake locations along a profile of the lower half of the Nisqually glacier. We then sampled the 2012 TRI slope-parallel velocities at these locations (Fig. 11). Remarkably, in spite of significant terminus retreat of up to ∼ 360 m and surface elevation changes of approximately −20 m (Sisson et al., 2011), the November 1969 and November 2012 surface velocities are almost identical at stakes 12–20, suggesting bed properties and geometry rather than ice thickness is a controlling factor. In contrast, the July 2012 velocities at stakes 12–20 are 8–33 % faster than the July 1969 velocities. The ice is mostly sliding at these locations, so the change could be related to a difference in the timing of the peak summer velocities, or potentially enhanced sliding in 2012. The most notable difference between the profiles is observed closer to the terminus at stakes 7–12. At these locations, the July and November 2012 velocities are both < 0.05 m day−1 , whereas July and November 1969 velocities are ∼ 0.2 and −1 ∼ 0.1 m day , respectively, with significant seasonal variability. This suggests that the ice near the present-day terminus is stagnant and no longer strongly affected by changes in subglacial water.
|
10
Comparison with historical velocity measurements
Discussion Paper
5.5
Abstract
Introduction
Conclusions
References
Tables
Figures
J
I
J
I
Back
Close
Full Screen / Esc Printer-friendly Version Interactive Discussion
|
4089
Discussion Paper
Appendix A contains Supplement figures.
|
Appendix A
9, 4067–4116, 2015
Observations of seasonal and diurnal glacier velocities at Mount Rainier, Washington K. E. Allstadt et al.
Title Page
Discussion Paper
25
TCD
|
20
Discussion Paper
15
|
10
Discussion Paper
5
the stagnant ice near their termini. Novel data processing techniques reduced uncer−1 tainties to ±0.02–0.08 m day , and the corrected, surface-parallel TRI velocities for Nisqually display similar magnitude and direction with a set of sparse interannual velocity measurements (Walkup et al., 2013). Repeat surveys show that Nisqually glacier surface velocities display significant seasonal variability. Most of the glacier experienced a ∼ 25–50 % velocity decrease (up −1 to −0.7 m day ) between July and November. Interestingly, steep icefalls display no velocity change or even a slight velocity increase over the same time period. These seasonal variations are most likely related to changes in basal sliding and subglacial water storage. We documented no statistically significant diurnal velocity variations in ∼ 24 h datasets for Nisqually and Emmons, suggesting that subglacial networks efficiently handled diurnal meltwater input. Using a simple 2-D ice flow model, we estimate that sliding is responsible for approximately 91–99 % of the observed velocity for Emmons and Nisqually glaciers, similar to sliding percentage estimates for Nisqually glacier in 1969 (Hodge, 1974). Comparisons with 1969 velocity measurements over the Lower Nisqually (Hodge, 1972, 1974) reveal similar 2012 and 1969 November velocities, and faster 2012 July velocities. In summary, TRI presents a powerful new tool for the study of alpine glacier dynamics remotely. With just a few hours of fieldwork for each survey, we were able to document the dynamics of several glaciers at Mount Rainier in unprecedented detail from up to 10 km away. TRI is an ideal technique for examining diurnal and seasonal glacier dynamics, particularly for areas that are difficult to access directly like many parts of the glaciers at Mount Rainier. Repeat surveys provide precise surface displacement measurements with unprecedented spatial and temporal resolution, offering new insight into complex processes involving subglacial hydrology and basal sliding.
Abstract
Introduction
Conclusions
References
Tables
Figures
J
I
J
I
Back
Close
Full Screen / Esc Printer-friendly Version Interactive Discussion
The model uses the shallow ice approximation (SIA) – an approximate solution of the Navier–Stokes Equations (Cuffey and Paterson, 2010). The surface velocity us resulting from internal deformation given from the SIA is n
n+1
(B1)
−
W (x, y) = e
(x−x )2 +(y−y 0 )2 l
(B2)
9, 4067–4116, 2015
Observations of seasonal and diurnal glacier velocities at Mount Rainier, Washington K. E. Allstadt et al.
Title Page
Discussion Paper
where ρi represents ice density, g represents gravitational acceleration, α represents local surface slope, H represents local ice thickness, A represents an ice softness parameter and n represents a flow rate exponent. However, the SIA only takes into account local conditions to determine the deformation component of the surface velocity. To simulate the effect of non-local conditions, such as lateral sidewall drag and longitudinal stretching, the ice thickness H and surface slope α are smoothed using a weighting function based on Kamb and Echelmeyer (1986). Kamb and Echelmeyer (1986) calculated a longitudinal coupling length l using a 1-D force balance approach, for each point in their domain. They calculated l to be in the range of one-to-three ice thicknesses for valley glaciers. We simplified this by using a single value for l over the domain of model. The longitudinal couple length l is used in a weighting function to smooth α and H. The weighting function has the form: √ 0
TCD
|
15
2A(sin(α)ρi g) H n+1
Discussion Paper
10
us =
|
5
Discussion Paper
Appendix B
|
Abstract
Introduction
Conclusions
References
Tables
Figures
J
I
J
I
Back
Close
0
25
|
where x and y represent the horizontal coordinates of the weight position, and x and 0 y represent the horizontal coordinates of the reference position. Weights are calculated at each point in the model domain, over a square reference window (side length of Aw ). H and α are smoothed at the reference position by normalizing weights over the reference window. We choose a coupling length l of ∼ 1.5 ice thickness and an averaging window size of ∼ 3 ice thicknesses, consistent with the usage in Kamb and Echelmeyer (1986). Model input parameters are summarized in Table 3. 4090
Discussion Paper
20
Full Screen / Esc Printer-friendly Version Interactive Discussion
usliding = k
| Discussion Paper
25
9, 4067–4116, 2015
Observations of seasonal and diurnal glacier velocities at Mount Rainier, Washington K. E. Allstadt et al.
Title Page
Discussion Paper
20
TCD
|
15
|
where k represents a coefficient that approximates the coupling strength of the glacier to the underlying bed, τd represents the gravitational driving stress τd = sin(α)ρi gH, m represents an adjustable flow rate exponent, Neff represents the effective pressure at the base of the glacier and ρi represents ice density. Effective pressure is the difference of water from overburden ice pressure Neff = pice − pwater where ice pressure pice = ρi gH water pressure pwater = ρw gHwt , Hwt represents the height of the water table above the bed and ρw represents water density. We use a spatially uniform and temporally constant ice softness parameter suitable for ice at the pressure melting point of 2.4×10⁻²⁴ Pa−3 s−1 (Cuffey and Paterson, 2010, p. 75). Surface slope (Fig. B1B) was estimated from the 2008 LiDAR DEM (Robinson et al., 2010). Surface velocities us are the median slope-parallel velocities. Ice thicknesses H (Fig. B1A) were estimated by differencing the 2008 LiDAR DEM surface elevations and the digitized and interpolated bed topography from Driedger and Kennard (1986). The Driedger and Kennard (1986) bed topography contours were derived from ice-penetrating radar point measurements and surface contours from aerial photographs. The published basal contours for Nisqually/Wilson, Emmons, and Winthrop Glaciers were digitized and interpolated to produce a gridded bed surface using the ArcGIS Topo to Raster utility. The gridded bed elevations have root mean squared error (RMSE) of 11 m when compared with the 57 original radar point measurements. A point-to-plane iterative closest point algorithm (implemented in the NASA Ames Stereo Pipeline pc_align utility (Shean et al., 2015) was used to coregister the 1986 bed topography to the 2008 LiDAR topography over exposed bedrock on valley walls. Mean error over these surfaces was 7.6 m following coregistration, although some of this error can be attributed to actual surface evolution near glacier margins 4091
Discussion Paper
10
Neff
(B3)
|
5
τdm
Discussion Paper
In order to model the basal sliding component of motion, we use a Budd type sliding parameterization (Bindschadler, 1983). The sliding parameterization has the form
Abstract
Introduction
Conclusions
References
Tables
Figures
J
I
J
I
Back
Close
Full Screen / Esc Printer-friendly Version Interactive Discussion
|
Author contributions. K. E. Allstadt coordinated the effort, developed methods, performed data acquisition and processing, made the figures and prepared the manuscript. D. E. Shean developed methods, performed data acquisition, processing, analysis, and interpretation of results, and contributed significantly to the manuscript. A. Campbell performed modeling experiments and contributed the related section of the manuscript. M. Fahnestock and S. Malone contributed significantly to experiment design, establishment of objectives, data acquisition, and manuscript review.
Discussion Paper
4092
|
25
9, 4067–4116, 2015
Observations of seasonal and diurnal glacier velocities at Mount Rainier, Washington K. E. Allstadt et al.
Title Page
Discussion Paper
The Supplement related to this article is available online at doi:10.5194/tcd-9-4067-2015-supplement.
TCD
|
20
Discussion Paper
15
|
10
Discussion Paper
5
(e.g., hillslope processes) from 1986–2008. The accumulation of these uncertainties results in highly uncertain ice thickness estimates. The sliding model minimization technique solves for two parameters, a coupling coefficient k, and effective pressure Neff . We chose to force k to be both temporally constant and spatially uniform, but we allow Neff to be temporally variable with a weak spatial dependence. k represents a coupling of the glacier to its bed, which could be affected by bedrock geology, sediment layer thickness, size, and distribution. We chose not to explicitly include any of those processes because they are poorly constrained, they are not expected to vary much on timescales of days to months, nor is their effect on the sliding relationship well understood. Neff can change rapidly over the course of months and possibly days as subglacial water storage is strongly affected by seasonal melt cycles, we therefore choose to allow it vary temporally. Neff is weakly spatially dependent in our model because we don’t allow Neff be greater than local ice pressure, if that were the case it would imply an unphysical, negative water pressure. We prohibit Neff from being greater than ice pressure at any particular location. We adjust k and Neff to produce a sliding velocity model that most closely matches the residual velocity (observed velocity minus the modeled deformation velocity). To do this, we calculate a model mismatch, the difference between the model sliding velocity and the residual velocity, at each point, choosing parameters that minimize the summed squares of the mismatch over the domain.
Abstract
Introduction
Conclusions
References
Tables
Figures
J
I
J
I
Back
Close
Full Screen / Esc Printer-friendly Version Interactive Discussion
|
4093
Discussion Paper
30
|
25
9, 4067–4116, 2015
Observations of seasonal and diurnal glacier velocities at Mount Rainier, Washington K. E. Allstadt et al.
Title Page
Discussion Paper
20
TCD
|
15
Allstadt, K. and Malone, S. D.: Swarms of repeating stick-slip icequakes triggered by snow loading at Mount Rainier volcano, J. Geophys. Res.-Earth, 119, 1180–1203, doi:10.1002/2014JF003086, 2014. Anderson, R. S., Anderson, S. P., MacGregor, K. R., Waddington, E. D., O’Neel, S., Riihimaki, C. A., and Loso, M. G.: Strong feedbacks between hydrology and sliding of a small alpine glacier, J. Geophys. Res.-Earth, 109, F03005, doi:10.1029/2004JF000120, 2014. Bartholomaus, T. C., Anderson, R. S., and Anderson, S. P.: Response of glacier basal motion to transient water storage, Nat. Geosci., 1, 33–37, doi:10.1038/ngeo.2007.52, 2007. Bindschadler, R.: The importance of pressurized subglacial water in separation and sliding at the glacier bed, J. Glaciol., 29, 3–19, 1983. Burgmann, R., Rosen, P. A., and Fielding, E. J.: Synthetic aperture radar interferometry to measure Earth’s surface topography and its deformation, Annu. Rev. Earth Pl. Sc., 28, 169– 209, doi:10.1146/annurev.earth.28.1.169, 2000. Caduff, R., Schlunegger, F., Kos, A., and Wiesmann, A.: A review of terrestrial radar interferometry for measuring surface change in the geosciences, Earth Surf. Proc. Land., doi:10.1002/esp.3656, in press, 2014. Crandell, D. R. and Fahnestock, R. K.: Rockfalls and avalanches from Little Tahoma Peak on Mount Rainier Washington, Contribution to General Geology 1965, Geological Survey Bulletin 1221-A, US Geological Survey, Washington, D.C., A1–A30, 1965.
Discussion Paper
References
|
10
Discussion Paper
5
Acknowledgements. Many thanks to the National Park Service staff at Mount Rainier National Park, in particular S. Beason, L. Walkup, and B. Samora. J. Sweet and Z. Ploskey provided field assistance. R. Cassotto and D. Schmidt provided data processing guidance. The University of Washington Glaciology group provided useful discussions. Original data used in this analysis are available upon request from the corresponding author. This work was supported in part by the US Geological Survey under contract G10AC00087 to the Pacific Northwest Seismic Network, the University of Washington Earth and Space Sciences Department Awards, the Colorado Scientific Society, the Gordon and Betty Moore Foundation (Grants 2626 and 2627), and the National Science Foundation under Award No. 1349572 during the final part of manuscript preparation.
Abstract
Introduction
Conclusions
References
Tables
Figures
J
I
J
I
Back
Close
Full Screen / Esc Printer-friendly Version Interactive Discussion
Discussion Paper |
4094
|
30
9, 4067–4116, 2015
Observations of seasonal and diurnal glacier velocities at Mount Rainier, Washington K. E. Allstadt et al.
Title Page
Discussion Paper
25
TCD
|
20
Discussion Paper
15
|
10
Discussion Paper
5
Cuffey, K. M. and Paterson, W. S. B.: The physics of glaciers, 4th Edn., Academic Press, Burlington, MA, 2010. Driedger, C. L. and Kennard, P. M.: Ice volumes on cascade volcanoes: Mount Rainer, Mount Hood, Three Sisters, Mount Shasta, USGS Professional Paper 1365, USGS, Washington, D.C., 1986. Efron, B.: Bootstrap Methods: another look at the jackknife, Ann. Stat., 7, 1–26, doi:10.1214/aos/1176344552, 1979. Fountain, A. G. and Walder, J. S.: Water flow through temperate glaciers, Rev. Geophys., 36, 299–328, 1998. Gagliardini, O., Zwinger, T., Gillet-Chaulet, F., Durand, G., Favier, L., de Fleurian, B., Greve, R., Malinen, M., Martín, C., Råback, P., Ruokolainen, J., Sacchettini, M., Schäfer, M., Seddik, H., and Thies, J.: Capabilities and performance of Elmer/Ice, a new-generation ice sheet model, Geosci. Model Dev., 6, 1299–1318, doi:10.5194/gmd-6-1299-2013, 2013. Goldstein, R.: Atmospheric limitations to repeat-track radar interferometry, Geophys. Res. Lett., 22, 2517–2520, 1995. Heliker, C., Johnson, A., and Hodge, S.: Nisqually Glacier, Mount Rainier, Washington, 1857– 1979: A Summary of the Long-Term Observations and a Comprehensive Bibliography, USGS Open-file Report 83-541, US Geological Survey, Tacoma, WA, p. 20, 1984. Hodge, S. M.: The movement and basal sliding of the Nisqually Glacier, Mt. Rainier: Seattle, Wash., PhD dissertation, University of Washington, Department of Atmospheric Sciences, Washington, 1972. Hodge, S. M.: Variations in the sliding of a temperate glacier, J. Glaciol., 13, 349–369, 1974. Joughin, I. R., Kwok, R., and Fahnestock, M. A.: Interferometric estimation of three-dimensional ice-flow using ascending and descending passes, IEEE T. Geosci. Remote, 36, 25–37, doi:10.1109/36.655315, 1998. Joughin, I. R., Smith, B. E., and Abdalati, W.: Glaciological advances made with interferometric synthetic aperture radar, J. Glaciol., 56, 1026–1042, 2010. Kamb, B. and Echelmeyer, K., Stress-gradient coupling in glacier flow, I: longitudinal averaging of the influence of ice thickness and surface slope, J. Glaciol., 32, 267–284, 1986. Le Meur, E., Gagliardini, O., Zwinger, T., and Ruokolainen, J.: Glacier flow modelling: a comparison of the Shallow Ice Approximation and the full-Stokes solution, C. R. Phys., 5, 709–722, doi:10.1016/j.crhy.2004.10.001, 2004.
Abstract
Introduction
Conclusions
References
Tables
Figures
J
I
J
I
Back
Close
Full Screen / Esc Printer-friendly Version Interactive Discussion
Discussion Paper |
4095
|
30
9, 4067–4116, 2015
Observations of seasonal and diurnal glacier velocities at Mount Rainier, Washington K. E. Allstadt et al.
Title Page
Discussion Paper
25
TCD
|
20
Discussion Paper
15
|
10
Discussion Paper
5
Massonnet, D. and Feigl, K. L.: Radar interferometry and its application to changes in the Earth’s surface, Rev. Geophys., 36, 441–500, doi:10.1029/97RG03139, 1998. Meier, M. F. and Tangborn, W. V.: Distinctive characteristics of glacier runoff, US Geological Survey Professional Paper 424, US Geological Survey, Washington, D.C., 14–16, 1961. National Park Service: Annual snowfall totals at Paradise, 1920 to 2013, Dept. of the Interior, available at: http://www.nps.gov/mora/planyourvisit/upload/ Annual-snowfall-totals-July15-w-centlogo.pdf (last access: 29 November 2014), 2013. Noferini, L., Mecatti, D., Macaluso, G., Pieraccini, M., and Atzeni, C.: Monitoring of Belvedere Glacier using a wide angle GB-SAR interferometer, J. Appl. Geophys., 68, 289–293, doi:10.1016/j.jappgeo.2009.02.004, 2009. Nylen, T. H.: Spatial and Temporal Variations of Glaciers (1913–1994) on Mt. Rainier and the Relation with Climate, Masters thesis, Portland State University, Department of Geology, Portland, OR, 2004. Riedel, J.: Long Term Monitoring of Glaciers at Mount Rainier National Park, Narrative and Standard Operating Procedure Version 1.0, Natural Resource Report NPS/NCCN/NRR2010/175, National Park Service, Fort Collins, Colorado, 2004. Riedel, J. and Larrabee, M. A.: Mount Rainier National Park Annual Glacier Mass Balance Monitoring, Water Year 2011, North Coast and Cascades Network, Natural Resource Technical Report NPS/NCCN/NRDS-2015/752, National Park Service, Fort Collins, Colorado, 2015. Riesen, P., Strozzi, T., Bauder, A., Wiesmann, A., and Funk, M.: Short-term surface ice motion variations measured with a ground-based portable real aperture radar interferometer, J. Glaciol., 57, 53–60, doi:10.3189/002214311795306718, 2011. Robinson, J. E., Sisson, T. W., and Swinney, D. D.: Digital topographic map showing the extents of glacial ice and perennial snowfields at Mount Rainier, Washington, based on the LiDAR survey of September 2007 to October 2008, US Geological Survey Digital Data Series 549, United States Geological Survey, http://pubs.usgs.gov/ds/549/ (last access: July 2015), 2010. Shean, D. E., Alexandrov, O., Moratto, Z., Smith, B. E., Joughin, I. R., Porter, C. C. and Morin, P. J.: An automated, open-source pipeline for mass production of digital elevation models (DEMs) from very high-resolution commercial stereo satellite imagery, ISPRS J. Photogramm. Remote Sens, submitted, 2015.
Abstract
Introduction
Conclusions
References
Tables
Figures
J
I
J
I
Back
Close
Full Screen / Esc Printer-friendly Version Interactive Discussion
| Discussion Paper |
4096
9, 4067–4116, 2015
Observations of seasonal and diurnal glacier velocities at Mount Rainier, Washington K. E. Allstadt et al.
Title Page
Discussion Paper
25
TCD
|
20
Discussion Paper
15
|
10
Discussion Paper
5
Sisson, T., Robinson, J., and Swinney, D.: Whole-edifice ice volume change AD 1970 to 2007/2008 at Mount Rainier, Washington, based on LiDAR surveying, Geology, 39, 639– 642, doi:10.1130/G31902.1, 2011. Swanson, D. A., Malone, S. D., and Samora, B. A.: Mount Rainier: a decade volcano, EOS Trans. Am. Geophys. Un., 73, 177–186, 1992. Veatch, F.: Analysis of a 24-Year Photographic Record of Nisqually Glacier, Mount Rainier National Park, Washington, Geological Survey Professional Paper 631, United States Geological Survey, Washington, D.C., 1969. Voytenko, D., Dixon, T. H., Howat, I. M., Gourmelen, N., Lembke, C., Werner, C. L., De la Pena, S., and Oddsson, B.: Multi-year observations of Breidamerkurjokull, a marineterminating glacier in southeastern Iceland, using terrestrial radar interferometry, J. Glaciol., 61, 42–54, doi:10.3189/2015JoG14J099, 2015. Walkup, L. C., Beason, S. R., Kennard, P. M., Ohlschlager, J. G., and Stifter, A. C.: Surficial Ice Velocities of the Lower Nisqually Glacier and their Relationship to Outburst Flood Hazards at Mount Rainier National Park, Washington, United States, Paper 240-3, 2013 GSA Annual Meeting Abstracts, Denver, 2013. Werner, C., Strozzi, T., Wiesmann, A., and Wegmuller, U.: A real-aperture radar for ground-based differential interferometry, Radar Conference, 2009 IEEE, Pasadena, 3, 1–4, doi:10.1109/RADAR.2009.4977136, 2008. Werner, C., Wiesmann, A., Strozzi, T., Kos, A., Caduff, R., and Wegmiuler, U: The GPRI multimode differential interferometric radar for ground-based observations, Synthetic Aperture Radar, 2012, 9th European Conference on EUSAR, Nuremberg, Germany, 304–307, 2012. Zebker, H. A., Rosen, P. A., and Hensley, S.: Atmospheric effects in interferometric synthetic aperture radar surface deformation and topographic maps, J. Geophys. Res.-Solid, 102, 7547–7563, doi:10.1029/96JB03804, 1997. Zwinger, T., Greve, R., Gagliardini, O., Shiraiwa, T., and Lyly, M.: A full stokes-flow thermomechanical model for firn and ice applied to the Gorshkov crater glacier, Kamchatka, Ann. Glaciol., 45, 29–37, 2007.
Abstract
Introduction
Conclusions
References
Tables
Figures
J
I
J
I
Back
Close
Full Screen / Esc Printer-friendly Version Interactive Discussion
Discussion Paper |
Start Time (UTC)
End Time (UTC)
Survey length (h)
Latitude
Longitude
Elev (m)
Glaciers in view
Sampling Interval (min)
Number of Scans
Azimuth sweep
Chirp length (ms)
Chirp Band width (Hz)
Antennae angle
GLPEEK
7/6/12 17:20 7/7/12 19:50 7/6/12 00:32 11/2/12 01:20 11/27/12 18:47 12/10/12 20:50
7/6/12 23:37 7/8/12 19:56 7/6/12 05:23 11/2/12 23:14 11/28/12 00:29 12/11/12 01:32
6.3
46.7924
−121.7399
1788
Nisqually, Wilson Emmons, Winthrop Nisqually, Wilson Nisqually, Wilson Nisqually, Wilson Nisqually, Wilson
3
105
75◦
4
50
+15◦
SUNRIZ
ROI ROI ROI
24.1
46.9157
−121.6492
1929
4.8
46.7836
−121.7502
1564
21.9
46.7837
−121.7502
1559
5.7
46.7836
−121.7502
1563
4.7
46.7836
−121.7502
1562
3
436
29
8
25
+5
3
62
68◦
4
50
+15◦
3
377
52◦
4
50
+15◦
4
50
+15
4
50
+15◦
◦
3
107
60
3
91
70◦
K. E. Allstadt et al.
Title Page
◦
| Discussion Paper |
4097
Observations of seasonal and diurnal glacier velocities at Mount Rainier, Washington
◦
Discussion Paper
ROI
◦
9, 4067–4116, 2015
|
Sampling Location
Discussion Paper
Table 1. Survey parameters.
TCD
Abstract
Introduction
Conclusions
References
Tables
Figures
J
I
J
I
Back
Close
Full Screen / Esc Printer-friendly Version Interactive Discussion
Discussion Paper |
Sampling Location
GLPEEK SUNRIZ
ROI ROI a b
7/6/12 23:37 7/8/12 19:56 7/6/12 05:23 11/2/12 23:14 11/28/12 00:29 12/11/12 01:32
Total interferograms used/total collected
Median confidence interval width a −1 over ice (m day ) Before correctionb
After correction
93/105
0.23
0.07
215/436
0.14
0.09
56/62
0.33
0.11
359/377
0.16
0.04
100/107
0.44
0.10
76/91
0.43
0.15
Observations of seasonal and diurnal glacier velocities at Mount Rainier, Washington K. E. Allstadt et al.
Title Page
|
Derived from bootstrapping, 95 % confidence, line of sight velocities. Correction refers to subtracting an interpolated surface fitting the rock points from the entire image.
Discussion Paper
ROI
7/6/12 17:20 7/7/12 19:50 7/6/12 00:32 11/2/12 01:20 11/27/12 18:47 12/10/12 20:50
End Time (UTC)
9, 4067–4116, 2015
|
ROI
Start Time (UTC)
Discussion Paper
Table 2. Summary of uncertainty estimates of median stacks.
TCD
Discussion Paper |
4098
Abstract
Introduction
Conclusions
References
Tables
Figures
J
I
J
I
Back
Close
Full Screen / Esc Printer-friendly Version Interactive Discussion
Discussion Paper |
Value
Unit
Ice softness parameter Side length of reference window Acceleration of gravity Coupling length Sliding law exponent Flow law exponent Density of ice Density of water
A Aw g l m n ρi ρw
2.4 × 10⁻²⁴ 120 9.81 60 1 3 900 1000
Pa−3 s−1 m m s−2 m dimensionless dimensionless kg m−3 kg m−3
| Discussion Paper |
4099
Observations of seasonal and diurnal glacier velocities at Mount Rainier, Washington K. E. Allstadt et al.
Title Page
Discussion Paper
Symbol
9, 4067–4116, 2015
|
Name
Discussion Paper
Table 3. Constants used in modeling analysis.
TCD
Abstract
Introduction
Conclusions
References
Tables
Figures
J
I
J
I
Back
Close
Full Screen / Esc Printer-friendly Version Interactive Discussion
Discussion Paper |
Emmons Nisqually Nisqually Nisqually Nisqually
6 Jul 2012 6 Jul 2012 2 Nov 2012 27 Nov 2012 10 Dec 2012
Modeled k [m s−1 ] −6
3.2 × 10 −6 5.3 × 10 −6 5.3 × 10 5.3 × 10⁻⁶ 5.3 × 10⁻⁶
Modeled Neff [Pa]
K. E. Allstadt et al.
Title Page
| Discussion Paper |
4100
Observations of seasonal and diurnal glacier velocities at Mount Rainier, Washington
5
1.6 × 10 5 2.2 × 10 5 3.7 × 10 3.7 × 10⁵ 3.7 × 10⁵
Discussion Paper
Date
9, 4067–4116, 2015
|
Glacier
Discussion Paper
Table 4. Best fitting parameters for 2-D sliding model.
TCD
Abstract
Introduction
Conclusions
References
Tables
Figures
J
I
J
I
Back
Close
Full Screen / Esc Printer-friendly Version Interactive Discussion
W
Oregon ο 118 W
122ο W
n
ow ic
h
Discussion Paper
Cowlitz
lly
GLPEEK
|
5
x10
Figure 1. Glaciers at Mount Rainier and locations of viewpoints used for ground based radar interferometry. Instrument view angle ranges are indicated by green arrows. Boxes A–C show zoom areas for later figures. Inset map shows regional location of Mount Rainier. Glacier outlines in this and subsequent figures are from Robinson et al. (2010).
|
4101
Discussion Paper
Easting (m)
9, 4067–4116, 2015
Observations of seasonal and diurnal glacier velocities at Mount Rainier, Washington K. E. Allstadt et al.
Title Page
C
ROI
TCD
|
Ka ut
A
mo Em
Fryingp an B I W ng h rah itm am an
Nisqua
ow ich up ll a y Pu a om a m Tah ho a S.T
z
S.M
ns
Discussion Paper
o Carb
ell
Russ N.M
Winthr op
126ο
SUNRIZ
Mount Rainier
|
44 ο N
Washington
Idaho
46 ο N
British Columbia
Pacific Ocean
48 ο N
Discussion Paper
50ο N
Abstract
Introduction
Conclusions
References
Tables
Figures
J
I
J
I
Back
Close
Full Screen / Esc Printer-friendly Version Interactive Discussion
Discussion Paper
Receiving Antennae
Discussion Paper
Nisqually glacier
|
RadioFrequency Unit
Transmitting Antenna
TCD 9, 4067–4116, 2015
Observations of seasonal and diurnal glacier velocities at Mount Rainier, Washington K. E. Allstadt et al.
Title Page
|
Instrument Controller
12V Battery & Inverter
Discussion Paper
Rotary Position Motor
| |
4102
Discussion Paper
Figure 2. GPRI equipment setup during 27 November 2012 campaign at ROI viewpoint.
Abstract
Introduction
Conclusions
References
Tables
Figures
J
I
J
I
Back
Close
Full Screen / Esc Printer-friendly Version Interactive Discussion
Discussion Paper
TCD 9, 4067–4116, 2015
| Discussion Paper
Observations of seasonal and diurnal glacier velocities at Mount Rainier, Washington K. E. Allstadt et al.
Title Page
| | Discussion Paper |
4103
Discussion Paper
Figure 3. (a) Median slope-parallel velocity for timeseries from GLPEEK and SUNRIZ viewpoints taken on 6–7 July 2011. (b) Width of 95 % confidence interval (high minus low limits for slope parallel flow field) of slope parallel velocities for 6–7 July 2011 computed by bootstrapping after performing atmospheric noise corrections and stacking. Area shown is indicated by Box A on Fig. 1.
Abstract
Introduction
Conclusions
References
Tables
Figures
J
I
J
I
Back
Close
Full Screen / Esc Printer-friendly Version Interactive Discussion
Discussion Paper
TCD 9, 4067–4116, 2015
| Discussion Paper
Observations of seasonal and diurnal glacier velocities at Mount Rainier, Washington K. E. Allstadt et al.
Title Page
| Discussion Paper | |
4104
Discussion Paper
Figure 4. (a–d) Median slope-parallel velocities for Nisqually and Wilson glaciers for four different time periods taken from ROI viewpoint. Dashed lines on top left panel show locations of profiles taken to create Fig. 6, markers indicate distance in km. (e–g) Percent change in median slope-parallel velocity for the Nisqually and Wilson glaciers between time periods. Blue indicates a velocity decrease and red indicates a velocity increase relative to the earlier time period, gray polygons indicate areas where velocity change is significant with 95 % confidence. Area shown is indicated by Box B on Fig. 1.
Abstract
Introduction
Conclusions
References
Tables
Figures
J
I
J
I
Back
Close
Full Screen / Esc Printer-friendly Version Interactive Discussion
Discussion Paper
TCD 9, 4067–4116, 2015
| Discussion Paper
Observations of seasonal and diurnal glacier velocities at Mount Rainier, Washington K. E. Allstadt et al.
Title Page
| | Discussion Paper |
4105
Discussion Paper
Figure 5. Width of 95 % confidence interval (high minus low limits for slope parallel flow field) computed by bootstrapping. Shown for four sampling periods from the ROI viewpoint. Note that the color bar is scaled differently than Fig. 3b.
Abstract
Introduction
Conclusions
References
Tables
Figures
J
I
J
I
Back
Close
Full Screen / Esc Printer-friendly Version Interactive Discussion
Discussion Paper
West Profile 1.6
A
1.4 SP velocity (m/day)
July 7 (ROI) July 7 (GLPEEK) Nov 2 (ROI) Nov 27 (ROI) Dec 10 (ROI)
Nisqually Ice Fall
1.2 1
0.8 0.6 0.4 0
40
5
B
4.5
4
1.5
3 2.5 2 Distance up glacier (km)
1.5
1
20 10 5
4.5
4
3.5
0.5
Terminus
1
0.5
0
East Profile 1.6
C
July 7 (ROI) July 7 (GLPEEK) Nov 2 (ROI) Nov 27 (ROI) Dec 10 (ROI)
Nisqually Ice Cliff
1.2 1
Discussion Paper
0.6 0.4 0.2
Surface slope (degrees)
40
D
4.5
10
3 2.5 2 Distance up glacier (km)
1.5
1
0.5
Terminus
Ice thickness (m) 4.5
4
3.5
3 2.5 2 Distance up glacier (km)
1.5
1
0.5
0
|
4106
Discussion Paper
Figure 6. (a) and (c): Slope parallel velocity profiles along the two branches of Nisqually glacier (profile lines shown in map view on Fig. 5) for all sample time periods and viewpoints. (b) and (d): surface slope and ice thickness along each profile line. Surface slope is smoothed identically to that used for slope parallel corrections (see text), ice thicknesses are estimated from digitized basal contours from Driedger and Kennard (1986) and surface elevations from the 2008 LiDAR (Robinson et al., 2010).
|
0 5
3.5
50 25 0
30 20
4
Observations of seasonal and diurnal glacier velocities at Mount Rainier, Washington K. E. Allstadt et al.
Title Page
0.8
0
9, 4067–4116, 2015
|
SP velocity (m/day)
1.4
Discussion Paper
3 2.5 2 Distance up glacier (km)
50 25 0 Ice thickness (m)
30
0
3.5
|
Surface slope (degrees)
0.2
TCD
Abstract
Introduction
Conclusions
References
Tables
Figures
J
I
J
I
Back
Close
Full Screen / Esc Printer-friendly Version Interactive Discussion
Discussion Paper
Emmons Glacier (SUNRIZ) July 7-8, 2012
A
D
1
D C
E
C
0.6
C
Bad Data
B
B
A
B A 1 km
0.2
E
E 0
0.7
18:00
21:00
00:00 03:00 Centerpoint Time (PDT, UTC-7hr)
06:00
C
LOS velocity (m/day)
D
0.5
0.1
0
D
D
E E
Slope parallel velocity (m/day)
1 km 0
21:00
00:00
09:00
12:00
|
03:00 06:00 Centerpoint Time (PDT, UTC-7hr)
Discussion Paper
1.0
0.3
E
Discussion Paper
Figure 7. LOS velocities computed using a sliding mean with a 2 h centered window for areas of the glaciers indicated on the median flow field maps at right. Error margins, shown as transparent polygons around each line represent ± one standard error. (a) 24 h timeseries at SUNRIZ on 7–8 July 2012, gray box indicates the period with poor data quality (see text for details). (b) 22 h timeseries at ROI on 1–2 November 2012.
|
4107
K. E. Allstadt et al.
1.5
C B
Observations of seasonal and diurnal glacier velocities at Mount Rainier, Washington
Title Page
B
C
B
0.4
A
A
9, 4067–4116, 2015
|
A
0.5
09:00
Nisqually and Winthrop (ROI) Nov 1 - 2, 2012
B
0.6
0.2
Discussion Paper
A
0.4
D
|
LOS velocity (m/day)
0.8
TCD
Abstract
Introduction
Conclusions
References
Tables
Figures
J
I
J
I
Back
Close
Full Screen / Esc Printer-friendly Version Interactive Discussion
Discussion Paper
5.186
6
x 10
5.1855
| Discussion Paper
Northing (m)
5.185
5.1845
TCD 9, 4067–4116, 2015
Observations of seasonal and diurnal glacier velocities at Mount Rainier, Washington K. E. Allstadt et al.
Title Page
|
5.1835 50 cm/day
0.5 km
July 7 (GLPEEK) Walkup et. al (2013)
5.955
5.96 Easting (m)
5.965
5.97 5 x 10
|
4108
Discussion Paper
Figure 8. Comparison of average azimuth and velocities measured by Walkup et al. (2013) between 19 July 2012 and 11 October 2012 (black) compared to slope-parallel velocities derived from this study at the same locations for two time periods that bracket the time period measured by Walkup et al. (2013). Area shown is indicated by Box C on Fig. 1.
|
5.183 5.95
Nov 2 (ROI)
Discussion Paper
5.184
Abstract
Introduction
Conclusions
References
Tables
Figures
J
I
J
I
Back
Close
Full Screen / Esc Printer-friendly Version Interactive Discussion
Discussion Paper
TCD 9, 4067–4116, 2015
| Discussion Paper
Observations of seasonal and diurnal glacier velocities at Mount Rainier, Washington K. E. Allstadt et al.
Title Page
| Discussion Paper | |
4109
Discussion Paper
Figure 9. Modeling results for summer (6 July 2012) and a late fall (2 November 2012) time period for Nisqually and Wilson glaciers. (a), (f) Deformation model; (b), (g) sliding residual (slope parallel velocities from observations minus the deformation model); (c), (h) estimate of the percentage sliding (sliding residual divided by total slope parallel velocities); (d), (i) sliding model; (e), (j) difference between sliding residual and sliding model.
Abstract
Introduction
Conclusions
References
Tables
Figures
J
I
J
I
Back
Close
Full Screen / Esc Printer-friendly Version Interactive Discussion
Discussion Paper
TCD 9, 4067–4116, 2015
| Discussion Paper
Observations of seasonal and diurnal glacier velocities at Mount Rainier, Washington K. E. Allstadt et al.
Title Page
| Discussion Paper | |
4110
Discussion Paper
Figure 10. Same as Fig. 9 for Emmons glacier.
Abstract
Introduction
Conclusions
References
Tables
Figures
J
I
J
I
Back
Close
Full Screen / Esc Printer-friendly Version Interactive Discussion
Discussion Paper |
Velocity (m/day)
3
4
5
7
8
9
10
11 12 13 14 15 16 17 18 19 20 20 19 18 17 16 15 14 13 12 11 10 9 8 7
0.4 0.3 0.2
July 2012 July 1969 Nov 2012 Nov 1969 0.5
1
Distance (km)
1.5
2
2 1
0.5 km
2.5
|
Figure 11. Surface velocities measured in 1969 by Hodge (1974, digitized from Hodge, 1972) at 19 stake locations along lower Nisqually profile (circles), compared with the slope parallel velocities derived from this study for the same times of year at the same locations (triangles). Stake locations are labeled and indicated with dotted lines and are shown in map view at right, area shown is same as Fig. 8.
Discussion Paper |
4111
Observations of seasonal and diurnal glacier velocities at Mount Rainier, Washington K. E. Allstadt et al.
Title Page 3
Discussion Paper
0 0
5 4
9, 4067–4116, 2015
|
0.1
Discussion Paper
0.5 1 2
TCD
Abstract
Introduction
Conclusions
References
Tables
Figures
J
I
J
I
Back
Close
Full Screen / Esc Printer-friendly Version Interactive Discussion
Discussion Paper
TCD 9, 4067–4116, 2015
| Discussion Paper
Observations of seasonal and diurnal glacier velocities at Mount Rainier, Washington K. E. Allstadt et al.
Title Page
| Discussion Paper
Figure A1. Photomosaic acquired from ROI viewpoint on 5 July 2012.
| Discussion Paper |
4112
Abstract
Introduction
Conclusions
References
Tables
Figures
J
I
J
I
Back
Close
Full Screen / Esc Printer-friendly Version Interactive Discussion
Discussion Paper
TCD 9, 4067–4116, 2015
| Discussion Paper
Observations of seasonal and diurnal glacier velocities at Mount Rainier, Washington K. E. Allstadt et al.
Title Page
| Discussion Paper |
Figure A2. Photomosaic acquired from GLPEEK viewpoint on 6 July 2012.
Discussion Paper |
4113
Abstract
Introduction
Conclusions
References
Tables
Figures
J
I
J
I
Back
Close
Full Screen / Esc Printer-friendly Version Interactive Discussion
Discussion Paper
TCD 9, 4067–4116, 2015
| Discussion Paper
Observations of seasonal and diurnal glacier velocities at Mount Rainier, Washington K. E. Allstadt et al.
Title Page
| Discussion Paper
Figure A3. Photomosaic acquired from SUNRIZ viewpoint on 7 July 2012.
| Discussion Paper |
4114
Abstract
Introduction
Conclusions
References
Tables
Figures
J
I
J
I
Back
Close
Full Screen / Esc Printer-friendly Version Interactive Discussion
Discussion Paper
TCD 9, 4067–4116, 2015
| Discussion Paper
Observations of seasonal and diurnal glacier velocities at Mount Rainier, Washington K. E. Allstadt et al.
Title Page
| Discussion Paper
Figure A4. Samples of pair of multi-look images (mli) radar images (left and center panels) and resulting interferogram (right panel) taken from ROI viewpoint.
| Discussion Paper |
4115
Abstract
Introduction
Conclusions
References
Tables
Figures
J
I
J
I
Back
Close
Full Screen / Esc Printer-friendly Version Interactive Discussion
Discussion Paper
TCD 9, 4067–4116, 2015
| Discussion Paper
Observations of seasonal and diurnal glacier velocities at Mount Rainier, Washington K. E. Allstadt et al.
Title Page
| Discussion Paper | |
4116
Discussion Paper
Figure B1. (a) Filtered ice thickness and (b) filtered slope used as modeling inputs.
Abstract
Introduction
Conclusions
References
Tables
Figures
J
I
J
I
Back
Close
Full Screen / Esc Printer-friendly Version Interactive Discussion