Grim (40.6°S, 144.6E), Baring Head (41.3°S, 174.8°E), Mauna Loa (19.5°N,154â¢8°W), La .... they involve all the stages of the food web (phytoplankton,.
GLOBAL BIOGEOCHEMICAL
CYCLES, VOL. 13, NO 2, PAGES 257-271, JUNE 1999
Ocean primary production derived from satellite data: An evaluation with atmosphericoxygen measurements Yves BalkanskiandPatrickMonfray Laboratoire desSciencesduClimatet deYEnvironnement, Commissariat/t l'EnergieAtomique,Gif-sur-Yvette, France Mark Battle Departmentof Geosciences, PrincetonUniversity,Princeton,New Jersey Martin Heimann M. Heimann,Max-Planck-Institut fuerBiogeochemie, Jena,Germany
Abstract. Recently,veryprecisemeasurements havedetectedtheseasonal variabilityin the atmospheric O•/N• ratioat severalsitesin thenorthernandsouthernhemispheres. In thispaper,we derivemarineprimaryproductivity(PP) from satelliteoceancolordata.To infer air-seaoxygenfluxes,a simpleone-dimensional •diagnostic modelof oceanbiology hasbeendevelopedthatdependson only two parameters: a time delaybetweenorganic productionandoxidation(setto 2 weeks)andan exportscalelength(50 m). This model
givesa globalnetcommunity production of 4.3molC m': yr'• intheeuphotic zoneand 3.2molC m-•yr-•inthemixed layer.Thislastvaluecorresponds toa global fratio(net communityproduction(NCP)/PP)at thebaseof the mixedlayerof 0.37. The air-sea fluxes derived from this model are then used at the base of a three-dimensional
atmospheric modelto comparethe atmospheric seasonalcycleof O•/N• at five sites:Cape
Grim(40.6øS,144.6E),BaringHead(41.3øS,174.8øE), MaunaLoa(19.5øN,154•8øW), La Jolla(32.9øN,117.3øW),andBarrow(71.3øN,156.6øW).The agreement betweenmodel andobservationsis very encouraging. We infer from the agreementthatthe seasonal variationsin O•/N• arelargelycontrolledby thephotosynthesis ratebut alsoby the remineralization linkedto thedeepening andshoalingof themixedlayer.Lateral ventilationto highlatitudesmayalsobe an importantfactorcontrollingthe amplitudeof the seasonalcycle.
1. Introduction
variationsof atmospheric oxygenare photosynthesis and respirationfrom marinebiota, ventilation,and thermal
Inthispaper weuseatmospheric oxygen measurements to invasion andevasion duetovariations ingassolubility. assess predicted air-sea fluxesof oxygen derived from Although oxygen isthesecond most abundant constituent satellite ocean color.Atmospheric oxygen measurements oftheatmosphere andamounts to20.946% of itsvolume integrate air-sea oxygen fluxes oververylargeoceanic [Machta andHughes, 1970], thecombined effects of the expanses andarewellsuited to assess strengths and above processes induce seasonal variations in itsrelative
weaknesses of oceanic carbon models predictions of abundance ofupto200parts permillion. Following the
oxygenand carbonfluxes.Seasonal variations in the def'mition ofKeeling andShertz(1992)(hereinafter referred concentration of O2in theatmosphere areinduced by the to as K-S), we expressrelativechangesin the same processes thatinfluence carbon dioxide concentration oxygen/nitrogen ratioof air in unitsof "permeg",i.e. changes. Onland,these processes include photosynthesis, multiply by10therelative deviation fromareference plant respiration,soil respiration,changesin land use, and
fossilfuelcombustion. In theocean, processes causing
•5(O2/N2) = 106[(O2/N2)sampie/(O2fN2)referenc (1)
Carbon dioxide forms carbonic acid, bicarbonate, and
Copyright1999by theAmericanGeophysical Union.
carbonateions in seawater and equilibrateswith the atmosphere in about a year. In contrast,the equilibration time for dissolvedoxygen is typically only 3 weeks
Papernumber98GB02312 0886-6236/99/98GB-02312512.00 257
258
BALKANSKI
ET AL.'
OCEAN
[Broeckerand Peng, 1982]. The chemicalreactionsof CO2 in seawater cause the ocean to be a large reservoir for carbonand a comparativelysmall one for oxygen [Keeling et al., 1993]. As a consequence,seasonal atmospheric variationsinducedby oceanicprocesses are muchlargerfor 02 than for CO2. Because emissionsof fossil fuel CO2 are largely aseasonaland oceanic thermal effects (discussed below) tend to be out of phasewith CO2 fluxes causedby oceanbiology, almostthe entire amplitudeof the seasonal CO2cycleis due to terrestrialbiotic activity. Since the main goal of this paper is to study the air-sea fluxes of oxygen and learn about oceanbiology, we can subtractthe contributionof the land biosphereby using an appropriatelyscaledrecordof atmospheric CO2. Hereafter, we follow K-S and work with the oceanicO2/N2component defined as
•5(O2/N2)ocea n -- •5(O2/N2)+ (1.1/0.20946) Xco2
(2)
where 0.20946 is the 02 mole fraction in dry air, 1.1 is the O2:C photosyntheticratio for the terrestrial biosphere [Severinghaus,1995], andXco2is the CO2 mole fraction in partsper million by volume. While the thermal componentof air-sea O2/N2 flux is relativelywell known [Keelinget al., 1993], the biological component(the majorone) is poorlydetermined[Keelinget al., 1993: Bender et al., 1996]. Recentestimatesof primary productionhavebeenderivedby Antoineet al. [ 1996] using the climatological ocean color archive of Coastal Zone Color Scanner (CZCS) data. This allows a monthly descriptionof the marineproductionover the global ocean. Here we use a one-dimensional(l-D) model of the global upper oceanto convertthis productionto a net air-sea02
PRIMARY
PRODUCTION
In section 2, we present a 1-D model of 02 fluxes associatedwith the seasonalcycle of productionwhich incorporates thesethreeprocesses. We alsoapplythe model to a well-measuredregion of the oceanfor validationand calibration.
Section
3
describes
how
the
model
is
generalisedover the whole oceanto generatethe air-sea02 flux field. In section4, we presentthe three-dimensional (3D) atmospherictransport model used to simulate the seasonalatmosphericO2/N2. We then compare model resultsto availableatmospheric datain section5, discussing the constraintsderivedfrom this studyfor marine organic matterproductivity. 2. A One-Dimensional
Ocean Model
of Seasonal
Dissolved02 in the Upper Ocean Becausethe main seasonalvariability of water masses occurs in the vertical dimension, we have chosen to
describethe seasonal02 variability in the upperoceanwith a simple 1-D (depth)model. Variationsof the mixed layer depth (MLD), especiallyin midlatitudesto high latitudes, causestratificationof the upperlayersduringthe springand summer (MLD
around 10-30 m) and entrainment of
subsurfacewater duringautumn-winter(MLD around100300 m). A good representationof MLD is therefore essential to describe the time evolution of the 02 fluxes
back to the surfaceas the mixed layer deepensand shoals. If the seasonalthermoclineincludesa fraction of the upper net autotrophicpart of the euphotic zone, the seasonal thermoclinewill be supersaturated with 02. The mixed layer will, in turn, becomesupersaturated upon entraining the seasonal thermocline
waters when stratification
breaks
down in early winter. In contrast, if the seasonal Phytoplanktonin the oceanswill carryout photosynthesis thermoclineextendsonly to the net heterotrophicpartof the The to produceorganiccarbonand 02 when light and nutrients euphoticzone or below, it will be undersaturated. are available. The conversionof light to organic carbonis mixed layer will then become undersaturatedupon watersin late autumndefined by Williams [1993] as grossprimary production entrainingtheseO2-undersaturated flux.
winter.
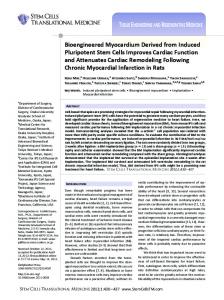
(GPP), in terms of material productivity. This organic carbon will serve as a substrate for respiration by phytoplankton,bacteria, protozoa, and metazoa. For the 2.1. Description of the Model entire ocean, GPP is almost exactly balanced by gross respiration when averaged over the annual cycle. The We use a modifiedversionof the model developedby difference between GPP and the algae respiration by Peng et al. [1987]. Figure 1 presentsa schematicdiagram autotrophsover 1 day is definedas the primary production of our formulation.The modelis a 1-D descriptionof ocean (PP), or simply "production" [Morel, 1991]. Oxygen mixing and biology that extendsfrom the surfaceto the productionis derivedfrom PP usingan O2:Cratio discussed bottom of the seasonal thermocline, i.e., the maximum below. mixed layer depth reachedin wintertime. While the mixed no mixing occursin Unfortunately,there is no direct way to estimatethe layer (ML) is treatedashomogeneous, fractionof this 02 productionthat escapesfrom the photic the thermocline below.The layer resolutionis 5 m in the layer into the atmosphere.Three processesneed to be upper 150 m, 100 m between 200 and 1000 m, and 500 m consideredwhen estimatingthe 02 air/seaexchange:(!) down__ to 2000m. The integration timestepi• 1 day,ancltho heterotrophic respiration consumes dissolved oxygen modelis run for 1 year followinga 4 year spin-uptime. duringremineralizationof organicmatter,(2) stratification Physicalandbiogeochemical processes takeninto account of the seasonalthermocline and associatedprocesses are described herein. 2.1.1. Oxygenproduction. Oxygenproductionis derived sequester O2-oversaturated or -undersaturated watersbelow the mixedlayer (ML), and(3) the finite 02 air/seaexchange from primaryproductionestimatedat differentdepths.We rate inducesa time lag betweeneuphoticzone mixed layer use a vertically resolved version of primary production monthlymapsestablished by Antoineet al, [1996] from the 02 productionandexportto the atmosphere.
BALKANSKI
ET AL.'
OCEAN PRIMARY
GAS EXCHANGE
J[ LU Z
PRODUCTION
259
thefact thatorganicmatteris oxidizedlateranddeeperthan it is produced.The time delay of the oxidationreflectsthe storageof carbonas organicmatter, while the depthterm accounts for the sinkingof particlesand/orthe migrationof plankton. We thereforeassumethat primary production(i.e., the producedorganicmatter) is instantaneously redistributed downwardwith an exponentialdependence on depth. After a delay x, all redistributedorganic matter is oxidized. Formally, the remineralizationREM at level z (Z>z0)and time t is relatedto the earlier productionat depthz0 and time toby
ATMOSPHERE
/////4. LU
--
x
MIXING •k,O
LU
zo
oo
- Zo ].pp(zo, t - •)dzo(4) REM (z,t)- œz exp[•zLexp wherethe exportscalelengthLexpis comparable to the product of the average sinking rate and the lifetime of organic matter. The symbol x representsthe time lag
betwe•en production andremineralization. We havechosen to describe the depth dependent distribution with an exponentialform ratherthanthe powerlaw of Martin et al. [1987], sincewe use it both in and below the photic zone and because we apply this profile implicitly for both Figure 1. Schematicdiagramof the one-dimensional(l-D) modelusedto predictoxygenfluxes.The arrowsrepresent dissolved and particulate organic matter. The 02 these fluxes. consumptionis calculatedfrom remineralizationby RQ x REM(z,t), wheretheregenerationquotientis the sameas the photosynthetic quotient,namely, 1.4. Finally, we define net community production(NCP) or CZCS oceancolor archive(seeTable 1). This enablesus to simply "net production"in a given layer, as production capturethe upper seasonalthermoclinesupersaturation minusremineralization over the courseof 1 dayby WINTER
MIXED
LAYER
when the photiczone extendsbelow the bottomof the mixedlayer.FollowingandMorel [1996],we calculatePP from sea surfaceirradiance,chlorophylla concentrations, and temperature.Furthermore,we discretizedprimary production PP(z,t)asa functionof depthz andtimet using Thus, in the net production zone (i.e., NCP > 0), the depthdependence for chlorophyll[Morel and Berthon, production can be divided into two components:net 1989]andpenetration of photosynthetic availableradiation communityproductionand regeneratedproduction(REGP) [Morel, 1991].To getthe O2variability,at levelz andtime (here equal to REM). This definitionis equivalentto K-S
NCP(z,t)_=lttO0+ 24[PP(z,t)-REM(z,t)] (5)
and Williams [ 1993]. Finally, becauseRQ- PQ, the net 02 production(which may be positive or negative) can be dO2(z,t)/dt= PQ x PP(z,t)- RQ x REM(z,t) + GASEX + calculated,as a function of time and depth, by PQ x NCP(z,O. Hereafter, we refer to net 02 productionin the MIXING (3) euphoticzone as NEZP and to net 02 productionin the wherePQ is thephotosynthetic quotientassumed to be 1.4. mixedlayerasNMLP, extendingthe defmitionproposedby This value has been inferred for the new componentof K-S. We define the euphoticzone as the upper portion of production [Laws,1991].RQxREM(z,0,whereRQ is the the water column receiving 1% or more of the incident t, we use the relation
regenerationquotient, is the consumptionduring remineralization,discussedbelow. GASEX refers to the
solar radiation.
2.1.3. Vertical mixing. As presented,the 1-D model
changesin oxygendue to gas exchangeat the sea-air accountsonly for the entrainment/ventilation of dissolved interfaceand MIXING representsthe redistributionof 02 due to the deepeningand shoalingof the mixedlayer. oxygenthroughwatermixing. The mixed layer depth is derived from climatological 2.1.2. Oxygen consumption. The consumptionof oxygen occurswhen organic matter is remineralized.The pathwaysof thisoxidationare obviouslycomplicated,since theyinvolveall the stagesof the food web (phytoplankton, zooplankton,bacteria)as well as both solid and dissolved matter. Insteadof attemptingto describethis,we usea very simpleparameterization. The parameterization accountsfor
densityvaluesof Levitus [1982]. We defmethe baseof this layerto be thedepthat whichthe densityvalueexceedsthe
10m valueby 0.125kg m-3.Asexpected, thisdefinition givesa shallowmixed layer in springand summerand a deep mixed layer in fall and winter. In practice,during autumndeepening,the subsurfacewatersentrainedin the
ML are mixed instantaneously. Duringvernalshoaling,
260
BALKANSKI ET AL.: OCEAN PRIMARY PRODUCTION
Table
1. Data Sets Used in the Model
ISCCP
CZCS
Satellite Archive
C2
ECMWF/WCRP
Satellite Archive
Level IIIA
Levitus
HydrographicArchive
AtmosphericArchive Years of
Oct.78-June
86
Jul. 83-Dec.
90
Jan. 90- Dec. 90
Spatialand temporal
Climatologydescribedby Levims [ 1982]
climatology
monthlycomposites 512x512 pixels
resolution
monthly
12 hours
2.5øx2.5 ø
2.5øx 2.5 ø resolution
løxl o resolution
resolution
Derived
2-D fields of pigment
quantity(ies)
concentrations
monthlyfor temperature, 3-monthlyfor salinity;
2-D fields of
2-D fieldsof 10 m wind speed;oxygen
cloudiness
3D fieldsof temperature andsalinity;mixedlayer depthusingdensity
exchange coefficientdeparture of0.125kgm'3
(mgm'3)using Csat-10(0'012*pixel_counts - 1.4)
from Lissand Merlivat from 10 rn depthreference. [1986] scaledby 1.7 (see text).
asdescribedby few missingdata, objectivemapping
Filling of missing Antoine et al. [ 1996] data pluscorrections
polewardof 30øS andfilling winter monthspolewardof circa 60 ø
Esaias et al. [1986] References
Feldman
et al.
[19891
Rossowet al.
Bengtssonet al. [1982]
Levims[1982]
[1988]
Sullivan et al.
[1993] Yoder et al. [ 1993] Abbrevations are CZCS, coastalzonecolorscanner,ISCCP, InternationalSatelliteCloudClimatologyProject; ECMWF, EuropeanCenterfor Medium-Range WeatherForecasts, WCRP,WorldClimateResearch Program; and Levitus, Levitus [ 1982].
is generallypositiveat low latitudes watersat the base of the ML are incorporatedinto the oceanto atmosphere stratified layers of the seasonal.Becausewe used thin andnegativeat midlatitudesto high latitudeswhere waters layersin thefirst 100 m, thenumericaldiffusivityis limited of the main thermocline(andbelow) outcrop. to5m. Sinceorganicmatterleavesthe seasonalthermocline,the The simplifyingassumptions of our modelcan introduce model neglects any oxygen demand when the resulting significantartifacts.Mixing that occursin the seasonal undersaturatedwaters are ventilated. Therefore, to close the
thatfor thermocline (whichwe takeas stratifidd) is neglected. No modeloxygenbudgetona globalscale,we assume 3-D advectionor horizontalmixing is takeninto account. eachextratropical hemisphere, suboxicwaterresulting from Finally, the carbonand the oxygencyclesare not closed within the 1-D model,as part of the downwardexportof organicmatteris lost throughthe bottomof the seasonal thermocline. In thereal ocean,theoxygendepletioncaused by the oxidationof this organicmatterin layersbelowthe baseof the seasonal thermoclineis redistributed overlarge lateral distances.As a consequence, annually averaged fluxesat any givenlocationare nonzero.The 02 flux from
02 consumption belowthe seasonal thermocline (from 11ø to 90ø) is redistributedand ventilatedwith a uniform flux duringthe fall-winter monthof eachyear (Octoberthrough March in the northem hemisphere, April through Septemberin the southernhemisphere).The ventilation occursuniformlyoverthe worldoceanspolewardof 49ø. This admittedlycrudeapproximation waschosento include the high latitudes where lateral ventilation is known to
BALKANSKI
ET AL.' OCEAN PRIMARY
occur (the North Atlantic and the SouthernOceans). Over thesehigh latitudesregions,we simply distributethe 02
PRODUCTION
300 250
demand dueto remineralization duringthe6 monthperiod.
•
to be ventilated in the same region and to have no
•
seasonality.
c• 400
Production intheintertropical belt(11øS11øN)isassumed •• We are aware that ventilation is neither constant in
200 '•5o
50
timenoruniformlydistributed. Unfortunately, the dearthof observational constraints makesany morerefinedestimates of thetemporalandspatialscalesof ventilationspeculative.
• •
Clearly, we will be able to use far more realistic
o
o 20 0
parameterizations of nonlocallybalancedfluxesas regions and strengths of lateral ventilation become better documentedon a global scale.Nonetheless,this simple assumptionis useful to understandO2/N2 atmospheric variations. As we seein section5, theessential featuresare
v• • •
captured bythe model.
• • 40
to airFo2(mol m-2yr'l),attime t, isdriven by•he differenceof partialpressurein waterand air.
• • -40 • •
2.1.4.Gasexchange. Thenetoxygen outgasing fromsea
261
=
•g
(:::)
-10
_
•
-20 0 20 _ -
02 productiort
- .... ,
02 NEZP 02 NMLP 02 outflux , , ,
. •
I
•
I
•
I
0
-20
-
o c o100••
-
0
O
0
F02 (t)=k[VlOm(t),T(t)]S02 (T(t)][po 2(0,t)-0,209461 (6)
,
2,0 m
-3o
I
Jan
I
I
Apr
,
. ,
I
Jul
,
,
O ,
I
Oct Month
The effects of bubble-inducedsupersaturation have been
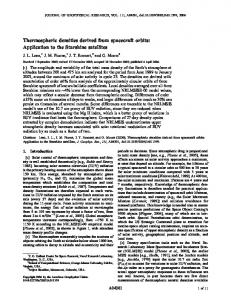
neglected. Thekinetic factor k isthepiston velocity for Figure 2.O2seasonal cycle attheNorth Atlantic Bloom oxygen (meters peryear). Weuse theLiss andMerlivat Experiment site (48øN, 20øW)showing mixed layer depth, [1986] relationship using theO2molecular diffusion photic zone depth, O2 flux due to primary production (thin solidline), net productionin photiczone (thin dashedline),
[Jenkinsand Goldman,1985] andlinking pistonvelocityto temperatureT and 10-m wind speedV10m.As describedby net productionin mixed layer (thick dashedline), and 02 Rarnonet and Mortfray [1996], we scaled the Liss and sea to air exchange (thick solid line). Also, oxygen at 20 m and 100 m depthsis displayedboth Mefiivat relation by a factor 1.7 to agree with the global supersaturation
exchange of 14CO2. The02 solubility So2(molm'3atm'l) is for data(circles)andthe 1-D model(lines).Finally,vertical
computedfrom Weiss[ 1970]. The othertermsrepresentthe lines indicatewhen mixed layer depthcrossesthe photic
02partial pressure (atmospheres) insurface water (po2) anddepth (solid lines) orthe100mlevel (dotted lines).
the 02 partialpressurein air (0.20946). The temperature dependenceof the solubility in the model allows natural simulation of the solubility-driven effects: degasing in spring/summer,and ingasing in archives(CZCS), InternationalSatelliteCloud Climatology fall/winter. We also accounted for the ice-covered surfaces Project (ISCCP), European Center for Medium-Range where sea-air exchange is forbidden. When averaged Weather Forecasts (ECMWF), and Levitus hereinafter zonally,the oxygenfluxesdue to gassolubilityare foundto referred to as Levitus [1982]) used to force the model are in Table 1. Figure2 displaysthe major driving be very similar to the ones describedby Keeling et al. summarised variablesof the 1-D model(mixedlayer depth,photicdepth [1993]. In summary, the 1-D model simulates the seasonal and O2•production).Computed02 net productionin the evolution of oxygen air-sea fluxes using ocean color, photic zone (NEZP) and the mixed layer (NMLP), and 02 cloudiness,surfacewind speed,temperatureand density air-sea fluxes are also shown. We assumedan export
of 50 m andno timelag for theremineralization profilesof the upper ocean.We employ only two free lengthLexp parameters(Le•, 'C). Both describethe respirationof (x--O). It is worth noting that in the presenceof a deep mixed layer, 02 outgasingis inhibited despitesignificant organicmatter. springtimeproduction.If the mixed layer depth is much 2.2. Application Experiment Site
at
the
North
Atlantic
Bloom
To test the behavior of the model, we simulated
conditions at the North Atlantic Bloom Experiment (NABE) site (48øN, 20øW) in the northernAtlanticwhere intensivecarbon and oxygen budget studieswere made duringa bloom event [Benderet al., 1992]. Climatological
greater than the photic depth, two processesoccur. (1) A significantfraction of organic matter cannot escapethe mixed layer and is remineralizedbelow the photic zone, consumingthe oxygen produced higher in the water column. Thus NMLP is much lower than NEZP; (2) When the ML exceeds 100 m, there is a significant time lag between02 productionand outgasing(up to 1.5 months).In summer, a large fraction of the net 02 production is
262
BALKANSKI ET AL.' OCEAN PRIMARY PRODUCTION
exportedto the atmosphere, while in autumn,after a short introducea storageof organicmatter'cof 2 weeksbefore 02 supersaturation of subsurface waters,ventilationof remineralizationoccurs, the outgasingof 02 is slightly undersaturated waters takes place. We now discussthe increased.If 'c is greaterthan a few months,the effectson amplitudeand the phasethat resultfrom theseprocesses 02 outgasingcan be substantial,but such a large value causesunrealisticallydurableorganicmatterto be produced andareparameterized in termsof Lexp andx. Lexp is a criticalvaluethatdetermines thef ratioof net daily. An increase of the export length Lexp will production to production (NCP/PP)for a givenmodellayer significantlyincreasethe amplitudeof the air-sea fluxes, or depth.At steadystate,the f ratio corresponds to the but thef ratio for the photic zone then reachesunrealistic fractionof production exportedfromthebaseof the given. values (as high as 0.75 during summer). At the other An exportlengthof 50 m wouldleadto anf ratio closeto extreme, a small export length implies a near-surface 0.07 at 150 m depth. If we consideronly the photiclayer, remineralizationwith very little export at 150 m. Finally, thef ratiorangesfrom 0.4 in wintertimeto 0.65 in summer. reducingthe gas exchangecoefficientby a factor of 1.7 In particular,if surfacechlorophyllincreases (a bloom),the (i.e., withoutthe aforementionedcalibration)delaysthe 02 photic layer depth decreasesand a smallerfractionof outgasingby about2 weeks.On the basisof thesedata,we productionis remineralizedin it, inducingthe expected simplyuseLexp-- 50 m and 'c = 2 weeksfor all of the increasein thef ratio. Observations, madeby Benderet al. modelingthat follows.We recognizethat in the real world, [1992] duringa 13-daybloomeventin May, are consistent the capacityof marinebiomassto storeand export carbon with these predictions. They found that (1) the net variesfrom the oligotrophicregimeto the eutrophicregime. productionin the photic layer was aroundhalf of the In the interestof simplicityhowever,in our presentstudy outchoiceof thef ratio production;(2) roughly half of this net productionwas we useNABE sitedatatOconstrain exported,the rest remainingin the photiclayer; (3) the and of the export length and assumethat thesevaluesare exportproductionat 150 m was roughly0.07 of the net suitableto otherregionsas well. photicproduction. To checkthe behaviorof 02 in the regionsof production and remineralization,we plot both the predicted and 3. Application of the One-DimensionalModel observed02 supersaturation values at 20 m and 100 m Over the Globe Using Climatological Archives depths(seeFigure2). The observations arerecentmonthly analysesof the National OceanographicData Center We have extendedthe 1-D model to the global open resolution (7.5ø x 7.5ø) as (NODC) data set [Najjar and Keeling, 1997]. The oceanusingthe samehorizontal the atmospheric transport model (TM2) described below. agreementof the amplitudes of the signalsare encouraging. PP hasbeencomputedmonthlyfrom CZCS However, it seemsthe onset of stratification occurs earlier The production in the springthanthemodel(drivenby theLevitusML (surfacechlorophyll),ISCCP (cloudiness),andLevitus(T) archives(seeTable 1). In areaspoorly coveredby CZCS, depth)wouldsuggest. particularly in gyres and midlatitudesto high latitudes, Figure 3 presentssensitivitytestsof the air-seafluxes ocean color was interpolatedin time and spacefollowing when the effect of gas solubilityis not included.If we the procedureof Antoineet al. [1996]. In the southern oceans, south of 30øS, we corrected the satellite underestimation by the algorithmproposedby Sullivan et 20 al. (1993, Figure 2a), basedon 6173 in situ measurements of surfacechlorophyllconcentrations. The oxygen piston 10 velocity is computedat 12-hourintervalsfrom ECMWF
wind fieldsfor the year 1990usinga resolution of 2.5øx 2.5ø [seeRamonetand Monfray, 1996]. The depthof the mixedlayeris deducedfrom the monthlytemperature fields and the seasonalsalinityfields of the Levitus data set. All
-10
..... -20
..... •
-30
I
Jan
forcingfieldsweregriddedoverthe 7.5ø resolution of the
L=50m,Tau=Ow,1.7L&M L=50m,Tau=2w,1.7L&M L=75m,Tau =Od, 1.7L&M L=50m,Tau=Od,L&M
Apr
globalized1-D model and interpolatedlinearly in time to give daily values.Finally to closethe oxygenbudgetbelow the seasonalthermocline,we follow the crude procedure I
•
Jul
describedabove (see section2.1.3) to take into accountthe
Oct
lateralventilationof deepwatersat midlatitudessand high Figure 3. Sensitivitystudyof oxygenair-seafluxes at the latitudesduringfall andwinter. NABE site.The standardcase(thick solidline) corresponds In summary,we computethe O2 fluxes (Fo2)by taking (1) photosynthetic production, to an export length of 50 m and a storagetime lag of 2 into accountfour processes: weeks.The followingsensitivitiesare displayed:increased (2) consumptionin the mixed layer and seasonal export length 75 m (thin dashed line), instantaneous thermocline,(3) the solubility pump (solubility-driven remineralization(thick dashed line), and reduced gas flux), and (4) lateral ventilation of deep waters in exchange (thinsolidline)without InCcalibration (seetext). midlatitudesandhigh latitudes. Month
BALKANSKI ET AL. ' OCEAN PRIMARY PRODUCTION
263
I•1 >20 F'•I ß 15-20 .-'...-'• ß 10-15 :'":• 5-10 •