KLINKOWSKI_LAYOUT_Layout 1 11/22/13 12:31 PM Page 44
On the Advantages of Elastic Optical Networks for Provisioning of Cloud Computing Traffic Mirosł aw Klinkowski, National Institute of Telecommunications, Poland Krzysztof Walkowiak, Wroclaw University of Technology, Poland
Abstract
This article provides motivation for the elastic optical network (EON) approach, an efficient and cost-effective solution for provisioning of cloud computing traffic. As opposed to wavelength switched optical networks (WSONs), the capabilities of which are limited by the use of rigid frequency grids, EON architectures allow for both scalable bandwidth provisioning and flexible resource allocation. The deployment cost, energy consumption, and bandwidth usage for both EON and classical WSON transport networks are compared in pan-European and U.S. backbone networks for 2012–2020 using Cisco traffic predictions. Results show that the EON concept significantly outperforms WSON in all examined criteria, and the gap between the two architectures increases in subsequent years. Moreover, potential advantages of anycast routing in transport networks with data center traffic are demonstrated.
I
n last few years, cloud computing has evolved from an emerging technology to a recognized networking approach that is gaining extensive acceptance and deployment. The concept of cloud computing, combining both flexible network access and scalable distributed computing, provides perfect solutions to many present-day business and research challenges. Both business and public customers are gradually migrating from the traditional client-server model to the cloud model. Concurrently, optical fiber networks play an important role in communications networks since they provide an infrastructure for the transport of aggregated IP traffic. During the past couple of years, research in optical networking has experienced significant advances, which among others have been governed by developments of spectrally efficient modulation techniques and new functional optical components. It is broadly expected that with the advent of new networking capabilities and demanding network services, the evolution of transport networks will lead toward mixed-line-rate (MLR) and elastic/flexible optical network (EON) architectures [1, 2]. As a consequence, the next generation optical transport networks will utilize network resources more efficiently and, at the same time, provide network connectivity adaptively according to bandwidth demands. Taking into account both great interest of the research community in EON solutions and the feasibility of EON technologies, it is important to recognize the potential advantages of EON, with respect to conventional WSON transport networks implemented with wavelength-division multiplexing (WDM) technology in the new cloud computing context. This article is our first attempt to answer this question. In particular, we focus on the evaluation of the overall cost, energy, and
44
0890-8044/13/$25.00 © 2013 IEEE
spectrum gain resulting from the implementation of EON technology in the optical transport network serving aggregated traffic demands. The evaluation is performed for two representative network topologies, namely, a pan-European and a United States network. We assume realistic traffic demands projected for 2012–2020 and taking into account a substantially growing contribution of inter-data center traffic, which is related to the cloud computing traffic. Eventually, we briefly discuss some other aspects related to the design and operation of cloud-ready EONs, such as provisioning and survivability of anycast connections as well as dynamic and adaptable bandwidth provisioning in the scenarios with heterogeneous and time and geographically varying traffic demands. The main novelties of this article compared to previous works addressing the comparison of EON with traditional WSON are as follows: • Traffic patterns applied in the simulations are based on Cisco predictions. • The anycasting approach is considered to serve the traffic between users and data centers. • Various options with different flexibility of frequency grids and transponders are examined.
Cloud Networking Cloud Computing The current expansion of cloud computing follows mainly from several recent IT trends, including the “dot-com boom,” which started an explosion of interest in outsourcing IT services; the popularity, maturity, and scalability of the present Internet; and the appearance of large data centers developed by companies such as Google, Amazon, and Microsoft [3].
IEEE Network • November/December 2013
KLINKOWSKI_LAYOUT_Layout 1 11/22/13 12:31 PM Page 45
The most common elements in the cloud computing definitions are network access and distributed computing resources. In the last few years, these two issues have been the focus of much interest in many areas of industry, parallel to the tremendous popularity of the Internet and growing needs to process huge amount of data, including the big data concept. Big data is a general idea used to explain the exponential increase, availability, and use of various types of information coming from numerous different sources (e.g., climate information, stock ticker data, financial transactions, sensor data, posts to social media, digital pictures and videos, and purchase transaction records). There are three major types of services provided in cloud computing systems [4, 5]: • Infrastructure as a service (IaaS). In this model, a customer outsources from the provider the equipment used to support operations, including storage, hardware, servers, virtual machines (VMs), and networking components. The provider is the owner of the equipment, and is responsible for housing, running, and maintaining it. The client typically pays on a per-use basis. Examples of IaaS include Amazon EC2 and Windows Azure Virtual Machines. • Platform as a service (PaaS). In this model, a customer rents virtualized servers and associated services (e.g., operating system, programming language execution environment, database, web server) for running existing applications or developing and testing new ones. Examples include Google App Engine and Microsoft Windows Azure Compute. • Software as a service (SaaS). In this model, applications are hosted by service providers and made available to customers over a network, typically the Internet. The customers do not manage the cloud infrastructure and platform on which the application is running, which consequently reduces the requirement to install and run the application on the customer’s own hardware, simplifying maintenance and support. Examples include Google Apps and Microsoft Office 365. The SaaS approach looks to become an increasingly dominant model that also follows from the fast development of technologies that support web services and service-oriented architecture (SOA). Moreover, this model is the simplest one in terms of business needs.
Cloud-Ready Transport Networks A transport network is an indispensable element of the cloud computing model since it provides connectivity between distributed computing resources. The unprecedented development of cloud computing triggers the need to make a critical review of currently used networks from the perspective of cloud computing requirements. According to [6], current transport networks are not efficiently designed to meet the needs of cloud environments. In particular, the authors of [6] highlight three requirements for cloud-ready transport networks: • Flexibility, defined as the ability to guarantee the required capacity on demand • Multilayer oriented network management • Cross-strata capabilities enabling joint optimization of the resources of both the cloud-based application and the underlying network providing connectivity Moreover, existing networks are mostly focused on unicast (one-to-one) traffic, while different types of applications running on cloud computing systems lead to new traffic patterns including anycast (one-to-one-of-many) flows. Eventually, concentration of processing in relatively small number of sites (i.e., data centers) means that the volume of traffic on net-
IEEE Network • November/December 2013
work links adjacent to these sites can become very large; thus, network technologies supporting high capacity may be required.
Virtualization Virtualization can be defined as a set of techniques that abstracts the details of a physical element (e.g., hardware platform, storage device, operating system, or network resources) and provides virtualized resources. A very common example of the virtualization approach is a VM, that is, a computing environment in which an operating system or program can be installed and run. Here, user software executed on VMs is separated from the underlying hardware resources. In consequence, the VM emulates a physical computing environment that can easily be copied and moved between host servers. The migration capability following from virtualization enables both simple sharing of computing resources in data centers and on-demand assigning or reassigning of virtual resources to applications. Moreover, virtualization within cloud data centers enables the use of economical commodity hardware, and introduces elasticity, load balancing, and economies of scale. Therefore, virtualization is perceived as one of the key foundations of cloud computing [3–5]. The key impact of virtualization on cloud networking follows from the migration capability. In a nutshell, virtualization enables the migration of VMs to other servers, with the aim to both improve performance and protect against failures. The migration can be arranged within the data center or outside the data center. In the latter case, it has a twofold impact on the transport network traffic. First, the virtual machines and related data must be sent (migrated) from one data center to another one. Second, after the migration, all network traffic related to migrated systems is carried to/from a new data center. Moreover, the relatively simple migration provided by virtualization and cloud computing allows application of anycast routing, or anycasting: the applications can easily be moved between data centers and then accessed by users, according to various objectives, such as cost, performance, and survivability.
Data Center Traffic in the Internet The growing popularity of cloud computing and the preceding advent of grid computing triggered changes in Internet traffic. Indeed, increasing numbers of various workloads are served by data centers accessed through the Internet. Consequently, a dominant and ever growing volume of Internet traffic can be categorized as data center traffic. Cisco, in forecast reports “Cisco Visual Networking Index” and “Cisco Global Cloud Index,” categorizes the network traffic and presents various statistics including volume of the traffic in exabytes per year and compounded annual growth rate (CAGR) in 2011–2016. According to Cisco, the Internet traffic can be divided into the following categories: • Non data center traffic — 70 exabytes of traffic in 2011, predicted CAGR for 2011–2016 18 percent • Data center to user — 299 exabytes of traffic in 2011, the predicted CAGR for 2011–2016 31 percent • Data center to data center — 118 exabytes of traffic in 2011, the predicted CAGR for 2011–2016 32 percent The first two types of traffic (non-data-center traffic and datacenter-to-user traffic) establish the consumer traffic, which can be further subdivided into various services like file sharing, Internet video, web email and data, online gaming, and voice over IP. The traffic related to data centers compromises both cloud data center and traditional data center traffic. According to Cisco, although in 2011 cloud traffic was only 39 percent of the overall data center traffic, cloud traffic is going to grow much faster (44 percent CAGR 2011–2016) than the
45
KLINKOWSKI_LAYOUT_Layout 1 11/22/13 12:31 PM Page 46
traditional data center traffic (17 percent CAGR 2011–2016). Cisco also specifies another type of traffic related to data centers: traffic that remains within the data center. The volume of the intra-data-center traffic is the largest compared to the above types (about 76 percent of all data center traffic in 2011). Note that this traffic is not carried over the Internet and therefore is not included in our analysis.
Elastic Optical Networks The Evolution of Optical Transport Networks Nowadays optical communication networks are limited to WDM transmission systems, which operate within rigid/fixed frequency grids and with single-line-rate (SLR) transponders making use of single-carrier modulation techniques. The main drawbacks of current systems are their low spectral efficiency, lack of adaptability to heterogeneous bandwidth demands, and low optical path (lightpath) scalability in terms of carried bit rate. Taking into account these arguments, the needs of emerging network services, and recent advances in optical networking, it is expected that optical transport networks will evolve toward more flexible and functional architectures [2]. The currently foreseen evolution path of optical transport networks comprises: • The application of advanced modulation formats, such as phase shift keying (PSK) and quadrature amplitude modulation (QAM) in MLR networks, allowing for 100 Gb/s connection provisioning • Elastic access to optical spectrum resources within flexible frequency grids, enabling further bandwidth scalability • The use of multi-carrier modulation techniques such as optical orthogonal frequency-division multiplexing (OOFDM), allowing for highly-granular and elastic bandwidth provisioning by means of splitting a high-rate data stream into a number of low-rate data streams that are transmitted simultaneously over a number of subcarriers Eventually, each of the above components will bring improvement in spectral efficiency.
Elastic Optical Network Architectures The concept of EON, proposed initially in [1] as a SLICE architecture, is a novel and very promising solution for next generation optical networks. The main innovation of EON with respect to conventional WSON is the provisioning of sub-wavelength granularity for low-rate transmission and super-channel connectivity for accommodating ultra-highcapacity client signals within a common network. The EON allows flexible allocation of appropriate-sized optical bandwidth, by means of contiguous concatenation of optical spectrum, to an end-to-end lightpath according to traffic demand. Two components are essential for EON architectures: bandwidth-variable transponders (BV-Ts) and bandwidth-variable wavelength cross-connects (BV-WXCs). The role of a BV-T is to adapt the client data signal to be sent to/received from the optical network with just enough frequency resources. Concurrently, BV-WXCs allow the creation of an optical routing path through the network by switching transmitted signals within their frequency bandwidth to appropriate switch output ports. EON architecture implementations and proof-of-concept EON experiments have recently been reported in [1, 7, 8]. To meet the new requirements of flexible spectrum allocation in EON, the International Telecommunication Union Telecommunication Standards Sector (ITU-T) has revised Recommendation G.694.1 to include the definition of a flexible WDM grid [9]. At the same time, standardization activities concerning extensions to signaling protocols are ongoing within the Internet Engineering Task Force
46
(IETF) Common Control and Measurement Plane Working Group.
Cloud-Ready Elastic Optical Networks EON architectures are considered one of the technological pillars for building effective and cost-efficient cloud- and anycast-ready transport networks due to their elastic and ondemand bandwidth connectivity, which is essential for the new service context [6]. Indeed, the use of advanced modulation formats and techniques in software-defined BV-Ts [10] and the operation within flexible frequency grids allows for adaptive bandwidth provisioning in response to dynamic traffic variations — resulting from virtualization and anycasting — in both the time and geographical domains. Apart from that, the adaptation of modulation levels according to transmission path characteristics may bring significant savings in terms of spectrum utilization. Since the transmission on shorter paths can be performed with higher modulation levels, thus requiring less spectrum, the aggregated anycast traffic may be directed toward nearer data centers, thus allocating less spectrum resources to lightpath connections. Also, the high bandwidth scalability of EON technologies meets the requirements of ever growing traffic demands.
Case Studies In order to examine the potential advantages of EONs for provisioning cloud computing traffic, we show below a case study. Real-world networks and service models are developed and used in this study. The optical network architectures discussed in a previous section are compared in two representative network topologies: a pan-European network (called Euro) and a U.S. long-haul network (called US). Service traffic is modeled according to the forecast reports “Cisco Visual Networking Index” and “Cisco Global Cloud Index.” All assumptions of our simulations are made according to close estimates of real requirements of national and international operators, and in reference to data provided in the literature. To run the simulations, we use our own simulation system developed in C++. As the optimization method, we apply the Adaptive Frequency Assignment (AFA) heuristic algorithm proposed in [11].
Optical Transport Networks We analyze four alternative optical transport network scenarios: • WSON-MLR — a wavelength switched optical network allowing for mixed-line-rate transmission with fixed 10 Gb/s, 40 Gb/s, and 100 Gb/s WDM transponders ,and transmission distance limits equal to 3200 km, 2300 km, and 2100 km, respectively [12]. • WSON-OFDM-MMF — a WSON with the transponders implementing the polarization-division multiplex (PDM)OFDM technology with multiple modulation formats selected adaptively between binary PSK (BPSK), quadrature PSK (QPSK), and m-QAM, where m belongs to {8, 16, 32, 64}. Here, the spectral efficiency is equal to 1, 2, …, 6 [b/s/Hz], respectively, for these modulation formats; PDM allows the spectral efficiency to be doubled. • EON-OFDM-SMF — an elastic optical network with BV-Ts implementing the PDM-OFDM technology (as in the WSON-OFDM-MMF scenario) and the QPSK (single) modulation format. • EON-OFDM-MMF — an elastic optical network with BVTs implementing the PDM-OFDM technology and multiple modulation formats (as in WSON-OFDM-MMF). WSON operates within the fixed 50 GHz ITU-T, grid while EON implements a flexible ITU-T grid of 6.25 GHz granulari-
IEEE Network • November/December 2013
KLINKOWSKI_LAYOUT_Layout 1 11/22/13 12:31 PM Page 47
ty. Moreover, both WSON-OFDMMMF and EON scenarios use three types of BV-Ts, each characterized by different capacity limits: 40 Gb/s, 100 Gb/s, and 400 Gb/s, respectively. The BV-Ts allow for bit rate adaptability with 10 Gb/s granularity. The 100 Gb/s capacity limit in WSON-MLR comes from the assumption of the use of currently available PDM-QPSK transponders and the fixed ITU-T frequency grid. The same 50 GHz limit per channel is present in WSON-OFDM-MMF; however, the use of PDM-OFDM transponders and higher modulation levels allows the signal to fit in the channel. When applying the PDM-OFDM technology, we make use of the transmission model presented in [13], which estimates the transmission distance in a function of the selected modulation level and transported bit rate. We introduce a 12.5GHz guard band between neighboring connections. In all scenarios, we assume that the transmission reach is extended by means of regenerators, which are applied whenever necessary.
Oslo
Glasgow
Stockholm
Copenhagen
Hamburg
Dublin
Berlin
Amsterdam
Warsaw
London Brussels
Paris
Frankfurt
Strasbourg
Prague
Munich
Vienna Budapest
Zurich Lyon
Zagreb
Milan
Bordeaux
Belgrade
Rome
Barcelona Madrid
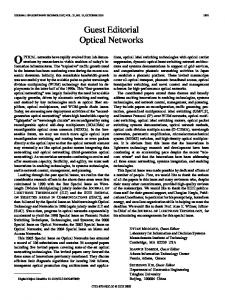
Network Topology The Euro network includes 28 nodes and 82 directed links, while the US network consists of 26 nodes and 84 directed links (Fig. 1). In the case of the Euro network, the nodes are located mostly in capital cities or other large cities. In the case of the US network, the nodes represent the largest metropolitan areas. By default, we assume that there are seven data center nodes in each network; however, scenarios with five and nine data centers were tested as well. Moreover, each network has three interconnection points to other networks (e.g., locations for submarine cable landing stations) used to carry international traffic. The location of data center nodes and interconnection points was made according to data available at http://www.datacentermap.com/.
Service Demands
Athens
(a)
Seattle Minneapolis Chicago SaltLakeCity Denver SanFrancisco LasVegas
Indianapolis Kansas City StLouis Tulsa
LosAngeles ElPaso
Dallas
Albany Boston
Detroit Cleveland
New York Washington DC
Nashville
Charlotte Atlanta
Houston NewOrleans
Miami (b)
A model of service demands is creatFigure 1. Topology and location of data centers and interconnection points for: a) Euro; b) ed for period 2012–2020 under the US networks. forecast of Cisco in their “Cisco Visual Networking Index” and “Cisco Global Cloud Index” reports. The • International (IN) traffic — All traffic leaving/entering the traffic matrix in each network includes A–Z service demands particular network IS calculated as a percentage of all netof four types (Table 1): work traffic. • City-city (CC) traffic represents all non-data-center traffic As in [14], the CC demands are created using a multivaricalculated with CAGR 18 percent. able gravity model. In more detail, total CC traffic (shown in • City-data center (CD) traffic represents all data center to Table 1) is divided to each city pair m and n proportional to user traffic calculated with CAGR 31 percent. the product of their population (Pm × Pn) and inversely pro• Data center–data center (DD) traffic is calculated with CAGR 32 percent. portional to the distance between the cities (dmn). It should be
IEEE Network • November/December 2013
47
KLINKOWSKI_LAYOUT_Layout 1 11/22/13 12:31 PM Page 48
noted that the population Pm reflects not the particular city population but the population of the region that the city covers (e.g., country or state). The data center traffic is generated not only by individual users but also by business parties, so its volume depends on both network user number (population) and economy level, expressed here by gross domestic product (GDP) value. Therefore, in the case of the CD traffic, the total CD traffic is shared among all cities proportional to the product of city population and GDP (P m × G m ). The GDP parameter G m represents the economy level of a country (Euro network) or state (US network). Then the CD traffic of each city is
Euro network Traffic volume (Tb/s) Year City–city
City–data center
Data center– data center
International
2012
2.0
10.0
4.0
4.0
2014
2.9
17.1
6.9
6.7
2016
4.1
29.3
12.0
11.3
2018
5.6
50.3
20.9
19.2
2020
7.9
86.3
36.5
32.7
US network Traffic volume (Tb/s) Year
assigned to each data center inversely proportional to the value (dmn)0.5, where dmn denotes the distance between considered nodes. Notice that the distance is adjusted by an exponential factor e = 0.5 to reflect the fact that data center traffic to a smaller extent is locally oriented; hence, in the calculations, in place of distance d mn a smaller value (d mn ) 0.5 is applied, and thus the impact of the distance is decreased. The assignment of CD traffic described above directly determines the load of each data center, denoted as DDm. To generate the DD demands, again we apply a multivariable gravity model. However, in that case, the traffic between data centers m and n is proportional to the product of their load (DDm × DDn) and inversely proportional to the distance between the nodes (dmn), again adjusted by an exponential factor e = 0.5. The volume of the international traffic is set as a percentage of all network traffic. We assume that in the case of the Euro network the proportion of IN traffic was 20 percent, while the correTotal sponding parameter for the US network was 10 percent. The total IN traffic is first spread to each city m proportional to the product of popu20.0 lation and GDP (P m × G m). Next, the traffic of each city is equally divided to each interconnec33.6 tion point. The initial volume of traffic in 2012 is set to 20 56.7 Tb/s for the Euro network and 30 Tb/s for the US network. The proportions of traffic types in 96.1 2012 are based on Cisco reports. The traffic values for subsequent years (i.e., 2014, 2016, 2018, 163.3 and 2020) are generated according to the CAGR of each traffic type. The basic bandwidth unit is set to 10 Gb/s, and all bandwidth demands were rounded up to a multiple of 10. Demands that exceeded particular transponder capacity limits of a given scenario were split proportionately into smaller demands. Total
City_city
City–data center
Data center– data Ccenter
International
2012
3.5
16.8
6.7
3.0
30.0
2014
4.9
28.8
11.6
5.0
50.4
2016
6.8
49.5
20.3
8.5
85.1
2018
9.5
84.9
35.3
14.4
144.1
2020
13.3
145.6
61.5
24.5
244.9
Service Routing
Table 1. Summary of network traffic for Euro and US networks in 2012–2020.
Relative cost
Power consumption (W)
10 Gb/s WDM transponder/regenerator
1
47
40 Gb/s WDM/O-OFDM transponder/ regenerator
2.5
125
100 Gb/s WDM/O-OFDM transponder/ regenerator
3.75
215
400 Gb/s O-OFDM transponder/regenerator
5.5
330
Table 2. Cost and power consumption of transponders/regenerators.
48
The aggregated traffic demands are served in the optical transport network according to the following assumptions. For each demand, the transponder with the lowest capacity limit, but exceeding the demand volume, is selected. Additionally, in EON the modulation level for which a given performance metric was minimized is selected. As performance metrics we use: •Network cost •Power consumption •Optical spectrum resource usage In our evaluation, the cost includes the capital expenditure (CAPEX) cost of equipment (transponders, regenerators) and annual operating expenditure (OPEX) cost related to fiber leasing. All costs are presented in Euros at the current prices. The future cost predictions do not include the inflation rate. The power consumption is calculated according to a sum of all transponders’ and regenerators’ energy requirements. Finally, the frequency usage denotes the width of spectrum in terahertz required in the network to serve all demands. We report the maximum spectrum usage defined as the maximum required spectrum over all network links and the average spectrum usage calculated as the average required spectrum in network links. We make similar cost and power consumption
IEEE Network • November/December 2013
KLINKOWSKI_LAYOUT_Layout 1 11/22/13 12:31 PM Page 49
600 500
20
400
15
300
10
200
5
100
0
0 2012
2014
2016
2018
2020
WSON-MLR cost WSON-MLR power
50 45 40 35 30 25 20 15 10 5 0
1000 900 800 700 600 500 400 300 200 100 0 2012
2014
(a)
2016
2018
Power consumption (kW)
30 25
WSON-OFDM-MMF cost WSON-OFDM-MMF power Cost per 1 year (min EURO)
EON-OFDM-SMF cost EON-OFDM-SMF power Power consumption (kW)
Cost per 1 year (min EURO)
EON-OFDM-MMF cost EON-OFDM-MMF power
2020
(b)
Figure 2. Comparison of EON-OFDM-MMF, EON-OFDM-SMF, WSON-OFDM-MMF, WSON-MLR in a) Euro; b) US networks — cost and power consumption.
EON-OFDM-SMF maximum EON-OFDM-SMF average
WSON-OFDM-MMF maximum WSON-OFDM-MMF average
15
18
12
15
Spectrum (THz)
Spectrum (THz)
EON-OFDM-MMF maximum EON-OFDM-MMF average
9 6 3 0
WSON-MLR maximum WSON-MLR average
12 9 6 3 0
2012
2014
2016
2018
2020
(a)
2012
2014
2016
2018
2020
(b)
Figure 3. Comparison of EON-OFDM-MMF, EON-OFDM-SMF, WSON-OFDM-MMF, WSON-MLR in: a) Euro; b) US networks — spectrum usage. assumptions as in [12, 15]; see the details in Table 2. In particular, the costs are expressed relative to the cost of the WDM 10 Gb transponder, which is estimated to be equal to €2000 [12]. According to [15], the figures for WDM and O-OFDM transponders, as well as for regenerators and transponders, are considered to be comparable. The fiber leasing cost is assumed to be equal to €2000/km for a 20-year period (as in the methodology used in [12]). Accordingly, the relative cost of a “dark” 50 GHz channel is equal to €0.625/km/year. For each node (city) pair, a set of 10 candidate paths is generated using the k-shortest path algorithm. Next, for each demand defined as a node pair and bandwidth requirement, one of the candidate paths is selected in order to minimize the particular objective. For instance, in the case of the cost in EON, for each candidate path all possible modulation formats are analyzed taking into account path distance range, demand bandwidth, and the cost of required transponders and regenerators. Similar processing is applied in the context of energy consumption and frequency usage. The frequency (slot) assignment is made according to the AFA algorithm adopted for anycast routing [11].
EON vs. WSON First, we focus on comparison of WSON and EON scenarios. In Fig. 2, we present the network cost and power consumption for the analyzed years, 2012–2020. In the case of the cost objective, both tested topologies in general provide similar trends. Particularly, in 2012, the cost of implementing WSON and EON approaches are comparable; however, over time the EON technology appears to be more advantageous. Indeed, in 2020, WSON has significantly larger provision costs compared to the EON-OFDM-MMF scenario, especially in the case of the
IEEE Network • November/December 2013
WSON-MLR scenario of about 47 and 54 percent for EURO and US networks, respectively. For the WSON-OFDM-MMF scenario the corresponding gaps are 27 and 38 percent, respectively. Moreover, at the beginning the EON-OFDM-SMF network scenario is the most expensive; however, in subsequent years it outperforms WSON scenarios and reveals slightly higher cost overheads than EON-OFDM-MMF (EON-OFDMMMF provides the flexibility of selecting the less costly modulation format, while EON-OFDM-SMF does not). In the case of power consumption, the tendency is a little bit different. In 2012, WSON-MLR requires less power than other approaches. The advantage of EON-OFDM-MMF is observed starting from 2018 and 2014 for the EURO and US networks, respectively. In 2020, EON-OFDM-MMF considerably outperforms WSON scenarios; for instance the WSON-MLR approach requires 36 and 49 percent more power, respectively, in the EURO and US networks. The gap in energy requirements between EON-OFDM-SMF and EON-OFDM-MMF remains stable (about 10 percent) over the whole analyzed period. In Fig. 3, we show the spectrum usage for both tested topologies. In all analyzed periods, EON-OFDM-MMF outperforms WSON scenarios in terms of the maximum and average spectrum utilization. Moreover, the gap between these approaches increases in subsequent periods, and in 2020 WSON-MLR needs more than twice the spectrum resources required for EON-OFDM-MMF. Also the difference between EON-OFDM-MMF and EON-OFDM-SMF grows in the following years. Recalling that traffic demands grow in time, the observed trends show that EON-OFDM-MMF is able to serve the traffic with higher spectral efficiency than WSON-MLR. The performance of WSON-OFDM-MMF is between that of the EON-OFDM-MMF and WSON-MLR scenarios.
49
KLINKOWSKI_LAYOUT_Layout 1 11/22/13 12:31 PM Page 50
Cost
Energy
Maximum spectrum
35%
60%
30%
50% Anycast gain
Anycast gain
25% 20% 15% 10%
Average spectrum
40% 30% 20% 10%
5% 0%
0% 5 DCs
7 DCs
9 DCs
5 DCs
7 DCs
(a)
9 DCs
(b)
Figure 4. Anycast gain in 2020 for EON-OFDM-MMF in: a) Euro; b) US networks.
Advantages of Anycasting
Future Challenges
As pointed out above, one of the main advantages of virtualization techniques in the context of cloud computing is the capability to easily migrate the workloads between data centers. In more detail, a VM is hardware independent and can be run on various physical infrastructures. Thus, it is relatively easy to use any data center for workloads. As a result, anycasting can be applied to establish the traffic between users and data centers (CD traffic). Currently, this type of traffic is related to VMs, and customers are served by one of many data centers to realize their workloads, which is equivalent to the idea of anycasting defined as a one-to-one-of-many transmission. To evaluate potential benefits of anycasting, we make the following simulations. We assume that all CD demands are anycast, that is, they can be assigned to any data center available in the network. All traffic matrixes examined in previous simulations are also analyzed in the case when anycasting is available. To evaluate the potential advantages from anycasting, we use an anycast gain parameter defined as the percentage difference between results (cost, energy, spectrum) obtained for the classical (unicast) approach used in the previous section and results (cost, energy, spectrum) obtained for the anycast approach. For instance, if for a particular network topology and demand pattern in the case of unicast approach the obtained cost is €10 million and in the case of anycast approach the obtained cost is €8 million, the corresponding value of anycast gain of the network cost is calculated as (10 – 8)/8 = 25 percent. In Fig. 4, we report the anycast gain for all examined metrics (i.e., cost, power consumption, and spectrum usage) and topology scenarios. The results correspond to EON-OFDM-MMF approach, 2020, and to three scenarios with different numbers of data centers (five, seven, and nine). We can easily notice that in each case the use of anycasting brings an improvement. The anycast gain grows in subsequent years with the increase of traffic demands; and, since the traffic is higher is the US network than in the EURO network, in 2020 the anycast gain is also higher in the US network. Moreover, if more data centers are present in the network, the anycast gain grows for all performance metrics. Results presented in Fig. 4 confirm that anycasting can significantly improve network performance comparrd to the classical unicast approach. However, the main challenge in the application of anycasting in a transport network to support cloud computing traffic is that usually the data centers and network operators operate independently as separate business parties. Therefore, a multilayer oriented network management and cross-strata capabilities are indispensable to make anycasting efficient in cloud computing scenarios.
We can discern several potential research challenges that arise within the area of EONs and cloud computing. Most of these challenges are currently under investigation and include: Network design: A new optimization problem, routing and spectrum allocation (RSA), emerges in planning and operation of EONs. The RSA problem concerns finding a routing path and a contiguous fraction of frequency spectrum for a connection request subject to the constraint of no frequency overlapping (with optical paths of other connections) in network links. The RSA problem is much more difficult than the routing and wavelength assignment (RWA) problem encountered in WDM networks due to the spectrum contiguity constraint and the possibility of using various modulation formats. Additionally, cloud computing generates new traffic patterns with the anycasting option, which further complicates the network design. Network survivability: EONs, like the preceding WDM networks, must be provided with protection and restoration mechanisms. This is a consequence of the fact that currently network survivability, which is defined as the capability to deliver services in the presence of failures, is one of the most important requirements of computer networks. Survivability mechanisms and approaches deployed for previous optical technologies must be adapted to answer new requirements and capabilities following from EONs and cloud computing. In particular, such features as anycasting or squeezed protection, which allows for partial bandwidth restoration in EON, introduce additional flexibility which can be explored by survivability mechanisms. Cross-stratum approach: Currently cloud computing systems and transport networks are managed independently; also, the two environments are agnostic to each other. To improve the performance of cloud-ready transport networks, it is highly required to develop new solutions enabling cooperation between these two environments, including aspects such as coordinated network design, cooperation between workload scheduling in data center and network routing with anycasting capabilities, network-aware load balancing mechanisms, server consolidation for energy efficiency, and appropriate extensions to the control plane. Some data transfers between data centers may be scheduled for night hours when the network load is lower. Also, dynamic and short-lasting connections can be established in EON for workload migration between data centers. Finally, for large data transfers, the connection bit rate may be set up (e.g., by allocating an adequate number of subcarriers in an O-OFDM transponder) taking into account
50
IEEE Network • November/December 2013
KLINKOWSKI_LAYOUT_Layout 1 11/22/13 12:31 PM Page 51
both spectrum resource availability in EON and time requirements for realizing the data transfer.
Conclusions We have examined the main advantages of optical transport networks, implementing elastic optical network technology for provisioning of cloud computing traffic. First, we have described the EON concept in the context of cloud computing requirements. We have presented a typical EON architecture that can be deployed for transport networks with both cloud data centers and traditional data centers. Next, using both realistic data traffic models built on Cisco traffic predictions and two representative network topologies, we have run a range of simulations. We have compared a conventional WDM and two EON-based cloud-ready optical transport network scenarios. In order to reflect the general trend of the growth of overall and cloud network traffic demands and its impact on network capacity requirements, we have analyzed the period from 2012 to 2020. We have shown that the use of EON architectures significantly improves the most important performance metrics (i.e., cost, power consumption, and spectrum resource usage) of optical transport networks compared to the conventional WDM approach. Moreover, with subsequent years the advantage of the EON approach quickly grows. In addition, we have shown the benefits of using the anycasting approach to support data center traffic carried over a transport network. Besides potential challenges related to the difficulty of multilayer-oriented network management, which should involve independent business parties, anycasting seems to be an attractive solution enabling significant improvement of network performance metrics at relatively low costs. Based on the obtained results, we can expect that cloud computing will become the killer application of the elastic optical network concept.
Acknowledgments The work was supported by the Polish National Science Centre (NCN) under Grant DEC-2012/07/B/ST7/01215. In addition, the work of Mirosław Klinkowski was supported in part by NCN under Grant DEC-2011/01/D/ST7/05884 and by the European Commission (EC) under the 7th Framework Programme (FP7) project IDEALIST, Grant Agreement Number 317999, while the work of Krzysztof Walkowiak was supported in part by EC under FP7, Coordination and Support Action, Grant Agreement Number 316097, ENGINE — European Research Centre of Network Intelligence for Innovation Enhancement (http:// engine.pwr.wroc.pl/).
IEEE Network • November/December 2013
References [1] M. Jinno et al., “Spectrum-Efficient and Scalable Elastic Optical Path Network: Architecture, Benefits, and Enabling Technologies,” IEEE Commun. Mag., vol. 47, no. 11, 2009, pp. 66–73. [2] O. Gerstel, M. Jinno, and A. Lord, “Elastic Optical Networking: A New Dawn for the Optical Layer?,” IEEE Commun. Mag. , vol. 50, no. 2, 2012, pp. 12–20. [3] W. Venters and E. A. Whitley, “A Critical Review of Cloud Computing: Researching Desires and Realities,” J. Info. Tech., vol. 27, no. 3, 2012, pp. 179–97. [4] C. Develder et al. , “Optical Networks for Grid and Cloud Computing Applications,” Proc. IEEE, vol. 100, no. 5, 2012, pp. 1149–67. [5] Q. Zhang, L. Cheng, and R. Boutaba, “Cloud Computing: State-of-the-Art and Research Challenges,” J. Internet Services and Applications, vol. 1, no. 1, 2010, pp. 7–18. [6] L. M. Contreras et al., “Toward Cloud-Ready Transport Networks,” IEEE Commun. Mag., vol. 50, no. 9, 2012, pp. 48–55. [7] R. Casellas et al., “GMPLS/PCE Vontrol of Flexi-Grid DWDM Optical Networks Using CO-OFDM Transmission,” IEEE/OSA J. Opt. Commun. and Net., vol. 4, no. 11, 2012, pp. B1–B10. [8] F. Cugini et al. , “Demonstration of Flexible Optical Network Based on Path Computation Element,” IEEE/OSA J. Lightwave Tech., vol. 30, no. 5, 2012, pp. 727–33. [9] ITU-T Rec. G.694.1 (ed. 2.0), “Spectral Grids for WDM Applications: DWDM Frequency Grid,” Feb. 2012. [10] B. T. Teipen, H. Griesser, and M. H. Eiselt, “Flexible Bandwidth and BitRate Programmability in Future Optical Networks,” Proc. IEEE ICTON , Coventry, England, 2012. [11] K. Walkowiak and M. Klinkowski, “Joint Anycast and Unicast Routing for Elastic Optical Networks: Modeling and Optimization,” Proc. IEEE ICC, Budapest, Hungary, 2013. [12] E. Palkopoulou et al., “Quantifying Spectrum, Cost, and Energy Efficiency in Fixed-Grid and Flex-Grid Networks,” IEEE/OSA J. Opt. Commun. and Net., vol. 4, no. 11, 2012, pp. B42–B51. [13] C. Politi et al. , “Dynamic Operation of Flexi-Grid OFDM-Based Networks,” Proc. OFC, Los Angeles, CA, 2012. [14] A. Deore et al., “Total Cost of Ownership of WDM and Switching Architectures for Next-Generation 100 Gb/s Networks,” IEEE Commun. Mag., vol. 50, no. 11, 2012, pp. 179–87. [15] A. Klekamp, U. Gebhard, and F. Ilchmann, “Efficiency of Adaptive and Mixed-Line-Rate IP Over DWDM Networks Regarding CAPEX and Power Consumption,” IEEE/OSA J. Opt. Commun. and Net. , vol. 4, no. 11, 2012, pp. B11–B16.
Biographies MIROSŁAW KLINKOWSKI (
[email protected]) is an assistant professor at the Department of Transmission and Optical Technologies at the National Institute of Telecommunications in Warsaw, Poland. He received his M.Sc. degree (1999) from Warsaw University of Technology, Poland, and his Ph.D. degree (2008) from Universitat Politecnica de Catalunya, Spain. He has co-authored several book chapters and more than 90 scientific papers in leading journals and international conferences. His research interests concentrate on algorithm design, modeling, and optimization in communication networks. KRZYSZTOF WALKOWIAK (
[email protected]) received his Ph.D. and D.Sc. (habilitation) degrees in computer science from Wroclaw University of Technology, Poland, in 2000 and 2008, respectively. Currently, he serves as an associate professor at the Department of Systems and Computer Networks, Wroclaw University of Technology. He received the Best Paper Award from the International Workshop on Design of Reliable Communication Networks 2009. He has published more than 160 scientific papers in international conferences and journals.
51


![Optical Networks [Book Reviews] - IEEE ... - IEEE Xplore](https://m.moam.info/img/260x300/optical-networks-book-reviews-ieee-ieee-xplore_59dba1291723dd46dfe54bf8.jpg)