JULY 2008
KIRK-DAVIDOFF AND KEITH
2215
On the Climate Impact of Surface Roughness Anomalies DANIEL B. KIRK-DAVIDOFF University of Maryland, College Park, College Park, Maryland
DAVID W. KEITH University of Calgary, Calgary, Alberta, Canada (Manuscript received 2 May 2007, in final form 12 December 2007) ABSTRACT Large-scale deployment of wind power may alter climate through alteration of surface roughness. Previous research using GCMs has shown large-scale impacts of surface roughness perturbations but failed to elucidate the dynamic mechanisms that drove the observed responses in surface temperature. Using the NCAR Community Atmosphere Model in both its standard and aquaplanet forms, the authors have explored the impact of isolated surface roughness anomalies on the model climate. A consistent Rossby wave response in the mean winds to roughness anomalies across a range of model implementations is found. This response generates appreciable wind, temperature, and cloudiness anomalies. The interrelationship of these responses is discussed, and it is shown that the magnitude of the responses scales with the horizontal length scale of the roughened region, as well as with the magnitude of the roughness anomaly. These results are further elucidated through comparison with results of a series of shallow-water model experiments.
1. Introduction The impact of topography on synoptic- and planetary-scale atmospheric motions has been studied carefully in a variety of modeling contexts (e.g., Hoskins 1983; Cook and Held 1992; Schär and Smith 1993; Grubišic´ et al. 1995; Richter and Mechoso 2004). However, the effect of isolated roughness anomalies at the earth’s surface has received far less attention. The subject has attracted interest recently because of the very rapid expansion of wind turbine power generation. Wind turbines convert atmospheric kinetic energy into electrical energy. Since the total kinetic energy dissipation in the atmosphere is less than 1 PW, and the total human demand for electrical power is projected to be over 20 TW by 2100, it is not unreasonable that heavy use of wind-generated electricity might influence atmospheric motions on large scales (Keith et al. 2004, hereafter KEA04). Lange et al. (2003) and Rooijmans (2004) performed micro- and mesoscale modeling simu-
Corresponding author address: Daniel B. Kirk-Davidoff, 3423 Computer and Space Sciences, Department of Meteorology, University of Maryland, Colellege Park, College Park, MD 20742. E-mail:
[email protected] DOI: 10.1175/2007JAS2509.1 © 2008 American Meteorological Society
lations of the impacts of offshore wind farms, respectively, while Roy et al. (2004) reported mesoscale modeling of a continental wind farm. Christiansen and Hasager (2005) were able to measure the reduction in wind downwind of a real offshore wind farm using satellite synthetic aperture radar. In addition, other human activities (deforestation, urbanization) and natural phenomena (climate shifts) have resulted in large changes in surface roughness characteristics, and so the question of how a regional change in surface roughness might influence atmospheric circulation patterns is of some general interest. Eliminating a gigaton of carbon per year of emissions, a seventh of the emission cuts needed to stabilized emissions over the next 50 yr, or one “stabilization wedge” (Pacala and Socolow 2004), requires a wind capacity of about 3 TW, an amount consistent with the upper end of current projections of wind power deployment (European Wind Energy Association 2005). If wind was to provide more than one-seventh of emissions mitigation, or if we look more than 50 yr ahead, more wind power would be needed. The average additional kinetic energy dissipation from wind power would be 2.3 TW, given a deployment of 3 TW of wind power capacity assuming an atmospheric efficiency of
2216
JOURNAL OF THE ATMOSPHERIC SCIENCES
0.4 and a capacity factor of 0.3, where “atmospheric efficiency” is the ratio of added large-scale energy dissipation to electric generation (KEA04) and capacity factor is the ratio of average-to-peak electricity production. This additional dissipation is more than 1% of the climatological kinetic energy dissipation in the boundary layer over land. Given the climate impacts of a 1% change in radiative forcing due to CO2, it seems reasonable to investigate the impacts that might arise from perturbations to surface roughness. KEA04 simulated the effect of large-scale wind power consumption in a set of general circulation model (GCM) experiments. They accomplished this by increasing the surface roughness length (z0) over large regions of North America, Europe, and Asia in two GCMs. They found changes in surface temperature of up to 1 K, and changes in surface winds of several meters per second. The changes were remarkably nonlocal. Intuitively, it might be expected that the primary result of an increase in surface roughness would be a local reduction of the temperature difference between the surface and the air just above, so that surface temperature would decrease and the surface air temperature would increase. In fact, model results showed that, although significant changes in temperature on the order of 1°C were sometimes found in the regions where roughness was increased, equally large changes were observed over regions thousands of kilometers from the perturbed regions. Temperature changes varied in sign and magnitude depending on the model, the season, and the details of the spatial distribution of perturbed roughness. In this paper, our goal is to make clear the mechanisms by which these patterns arise and lead to the climate impacts discussed by KEA04. The strongly nonlocal effects found in that work indicated that the roughness changes were causing change in the atmosphere’s general circulation, leading to changes in heat and moisture fluxes. Our approach will be to first perform experiments with isolated high–surface roughness regions in the simplified contexts of a shallow-water model, and a modified aquaplanet GCM, and then to use these results to aid our interpretation of the model runs using a more realistic representation of land, sea, and surface topography. We will show that the climate anomalies resulting from surface roughness anomalies can best be understood as a stationary Rossby wave response to the roughness anomaly. The dependence of the climate changes on the size and distribution of the roughened regions is consistent with this understanding. We turn first to the shallow-water model results, which we use to develop intuition about the factors
VOLUME 65
controlling the response of a geophysical fluid to an isolated roughness anomaly.
2. Shallow-water model results To better frame our discussion of general circulation model results, it is helpful first to simulate the impact of a region of isolated roughness on shallow-water flow. We use a modified version of the Matlab code topo_wave_1.m included in Holton (2004) that integrates the shallow-water vorticity equation:
冉
冊
冉
⭸⬘g ⭸⬘g ⭸2 ⭸⬘g ⭸2u ⫹ ⫹ 共u ⫹ u⬘g兲 ⫹ 2 ⫹ 共 ⫹ ⬘g兲 ⫺ ⭸t ⭸x ⭸x ⭸y ⭸y2 ⫽ ⫺r⬘g ⫺
⭸共r ⬘兲 ⭸共r ⬘u兲 ⫹ , ⭸x ⭸y
冊
共1兲
where u and are the background wind components; ⬘g is the perturbation geostrophic vorticity; u⬘g and ⬘g are the perturbation geostrophic wind components and are diagnosed by integrating the vorticity while assuming zero perturbation wind at the boundaries; r is the vorticity damping rate, 4 ⫻ 10⫺6 s⫺1; and r ⬘ is a spatially varying vorticity damping term added to represent the additional drag of a surface roughness anomaly. Periodic boundary conditions are used at the east and west boundaries, while no-slip walls are imposed for the perturbation velocities on the north and south boundaries. The variable r ⬘ is set to zero everywhere, except for a region within a distance Lm of the origin, where it is set to a fixed value, 4 ⫻ 10⫺6 s⫺1, unless otherwise indicated. Because of the rigid lid and the lack of surface topography the flow is always nondivergent. In all cases, the model equilibrates within several days of model time, and the results discussed below are all steady-equilibrium solutions. The background and anomaly damping rates imposed in the model are large compared to values in the real atmosphere [plotting wind stress against mean tropospheric winds from the Community Atmosphere Model, version 3.1 (CAM3.1) model data and using an atmospheric mass of 104 kg m⫺2 gives a damping rate of about 1.5 ⫻ 10⫺6 s⫺1]. Of course the damping rate in the shallow-water model must also account for radiative damping, but in any case, shallow-water results are intended only to illustrate the scale and spatial dependence of the most conceptually simple Rossby wave response to a damping anomaly, rather than to make a quantitative prediction of the magnitude of the response. Figure 1 shows contours of the meridional wind component for four different boundary conditions, after the model has been run to equilibrium. In Fig. 1a, the back-
JULY 2008
KIRK-DAVIDOFF AND KEITH
2217
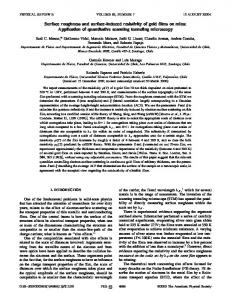
FIG. 1. Equilibrium meridional () wind component for rigid-lid, shallow-water model simulations of flow over an isolated rough patch. In each figure, the region within 1000 km of the origin (outlined in red) has an elevated damping rate. Here x and y distances are noted on the axes in thousands of kilometers. Positive contours are thick, negative contours are fine, with a contour interval of 0.2 m s⫺1, starting at 0.1 m s⫺1. (a) Constant background zonal flow (10 m s⫺1) on an f plane. (b) Constant background zonal flow on a  plane. (c) Background zonal wind varies sinusoidally in y with a maximum (10 m s⫺1) at y ⫽ 0, and a wavelength of 12 000 km, shown plotted against y, with the magnitude in m s⫺1 on the x axis. (d) As in (c), but the background wind is shifted to have U0 ⫽ 0 at y ⫽ 2000 km.
ground wind is held constant at u ⫽ 10 m s⫺1 and ⫽ 0 while , the gradient of the Coriolis parameter, is set to zero. The resulting wind pattern shows strong meridional divergence over the region of enhanced damping at the origin, due to the deceleration and convergence of the u wind component over the region of anomalous damping. Mass conservation requires a return flow toward the centerline; this is accomplished over a broader region of smaller meridional velocities downstream of the damping anomaly. In Fig. 1b,  has been set to 1.62 ⫻ 10⫺11 s⫺1, its value at 45°N, so that the fluid now supports the propagation of Rossby waves. Now parcels that initially move north from the centerline must experience a decrease in their relative vorticity to compensate for their increasing planetary vorticity. Thus we see a stationary pattern of positive and negative meridional velocity anomalies that radiate downstream and away from the east–westrunning centerline of the domain. In Figs. 1c,d, the background wind u varies sinusoidally from ⫺10 to 10 m s⫺1 in the meridional direction with a wavelength of 12 000 km. This simulates the variations of mean tropospheric winds from easterlies in the tropics to west-
erlies in the midlatitudes to easterlies in the polar regions. In Fig. 1c, u has a maximum at y ⫽ 0, so that the damping anomaly is centered within the westerlies. In Fig. 1d, u ⫽ 0 at y ⫽ 0 and has a maximum at y ⫽ 3000 km, so the damping anomaly straddles a node of the mean zonal wind. In each case, the meridional velocity response to the damping anomaly is confined to the region of positive u winds. In Fig. 1c, the response of meridional velocity remains symmetric, but it is confined to one strong downstream maximum, and one weaker minimum downstream of the first, with the signs reversed on either side of the east–west centerline. In Fig. 1d, the response becomes asymmetric, since stationary waves are only possible in the region of positive u, and although mean meridional velocity is zero, the largest negative meridional velocity anomaly is ⫺0.55 m s⫺1, 71% larger than the largest positive anomaly of 0.32 m s⫺1. Figure 2 shows the dependence of the meridional velocity on the diameter of the region of enhanced damping, for two values of (spatially constant) u. In the upper panel, the maximum meridional velocity is shown for u ⫽ 10 m s⫺1 and u ⫽ 20 m s⫺1. In either
2218
JOURNAL OF THE ATMOSPHERIC SCIENCES
VOLUME 65
FIG. 2. Dependence of meridional wind anomaly on the horizontal scale of the damping anomaly. (a) Maximum meridional wind anomaly. One-third of a stationary Rossby wavelength for each background wind speed is indicated with text and arrows. (b) Fractional area of domain with meridional wind greater than 0.25 m s⫺1.
case, meridional velocities increase approximately linearly with the scale of the damping region until a peak is reached, at a scale that depends on u. This dependence of the peak scale on u arises because the wavelength of a stationary Rossby wave scales as L ⫽ 2公u/. That is, the magnitude of the response to the damping anomaly increases as the horizontal scale of the roughened region increases, until the upstream and the first downstream meridional velocity anomalies of the opposite sign are separated by approximately L/2. For u ⫽ 10 m s⫺1, L/2 ⫽ 2470 km, while for u ⫽ 20 m s⫺1, L/2 ⫽ 3490 km; the peak of the scale dependence of the maximum meridional velocity occurs when the separation of the upstream and downstream anomaly exceed these values by about 500 km. As noted in the upper panel, a good rule of thumb is that the maximum response occurs at an anomaly radius equal to L/3. The lower panel shows the fractional area of the domain with meridional velocities greater than 0.25 m s⫺1. For u ⫽ 10 m s⫺1, this area increases monotonically with the diameter of the damping anomaly, while for u ⫽ 20 m s⫺1, the area decreases beyond the peak in maximum velocity. Thus, our shallow-water model experiments suggest that the response to a large region of enhanced surface roughness should scale with the size of the roughness anomaly, until a saturation size is reached at a length scale that depends on the mean wind. They show that in the presence of a meridionally varying background
zonal wind, the response to the roughness anomaly should remain confined to the region of positive zonal winds, and that this constraint also limits the downstream extent of the anomaly. The Rossby wave response also results in a stronger anomaly downstream of the roughened region than upstream. We will show that these results are reflected in results from more complex models of the atmosphere.
3. General circulation model runs The model experiments discussed below were run on the National Center for Atmospheric Research (NCAR) CAM3.1, a freestanding component of the Community Climate System Model (Collins et al. 2006). Simplified geometry runs were performed in aquaplanet mode.
a. Aquaplanet runs The aquaplanet runs allow us to explore the physical mechanisms discerned from the results of the shallowwater model at an intermediate level of realism. In particular, we wished to identify the characteristic pattern of climate changes for a single roughness anomaly, preventing the influence of one roughness anomaly on the flow approaching the next roughness anomaly downstream, and avoiding zonal asymmetries in the flow. In CAM3.1’s aquaplanet mode, the globe is covered with a fixed-temperature ocean. The temperature distribu-
JULY 2008
KIRK-DAVIDOFF AND KEITH
tion is zonally uniform, and varies in latitude from a maximum of 297.5 K at the equator to a minimum of 270.8 K at the poles. The aquaplanet experiments were performed in perpetual spring mode, so the solar inclination at noon stays fixed in time. In the standard aquaplanet mode supplied by CAM3.1 surface roughness is controlled by the Charnock relation, so that Cdn ⫽ 0.0027/U10 ⫹ 0.000142 ⫹ 0.0000764U10, where Cdn is the aerodynamic drag coefficient for neutral conditions, and U10 is the magnitude of the wind at 10 m above the surface (m s⫺1). Since Cdn ⫽ k2/[ln(z/z0)]2, where k ⫽ 0.4 is the von Kármán constant, z ⫽ 10 m is the reference height, and z0 is the surface roughness length, z0 ⫽ 共10 m兲 exp
冉冑
⫻ ⫺
冊
k2 . 0.0027ⲐU10 ⫹ 0.000142 ⫹ 0.0000764U10 共2兲
In our runs, we eliminated the connection between wind speed and the aerodynamic drag coefficient. Instead, a constant value of 10 m s⫺2 was substituted for U10 in the CAM3.1 subroutine flxoce, except for an isolated circular region of enhanced roughness, where U10 was set to 80 m s⫺1. These values of U10 correspond to z0 values of 86 m and 6.4 cm, respectively, and Cdn values of 0.0012 and 0.0063, respectively. We ran three experiments: case A has a rough patch with a radius of 20° of latitude and longitude, centered at 40°N and 180°W; case B has a rough patch with a radius of 10° centered at 40°N and 180°W; case C has a rough patch with a radius of 10° centered at 30°N and 180°W. In addition, for all runs, the meridional band from 0° to 10°E was slightly roughened, using a wind speed of 20 m s⫺1 for the Charnock relation, producing a surface roughness of 0.81 mm in that band. This is done so that the roughened circular patch will not be the only feature breaking the symmetry of the planet. All runs are integrated for 16 yr.
b. Full-model runs KEA04 performed simulations using both the CAM2.0 and the Geophysical Fluid Dynamics Laboratory (GFDL) atmospheric model, using two representations of the wind turbine drag: by increasing the surface roughness length, or by adding an explicit drag term into the boundary layer momentum equations. The results were generally similar for both forms of forcing, and in both models, so we will confine our discussion to the CAM2.0 runs using surface roughness changes, which are most directly comparable with the
2219
CAM3.1 aquaplanet runs. They included runs in which the surface roughness in a number of regions representing high population density and energy consumption was increased to represent increasing usage of wind turbines. The roughness enhancement was designed to be of comparable magnitude to that which would result if the present global electrical demand were met entirely with wind power. Of course, this is a much higher fraction than anyone anticipates, but if wind power were to supply 25% of carbon dioxide mitigation by the end of the century, it would be generating the equivalent of our present total consumption (Pacala and Socolow 2004). In addition, runs were performed in which all land regions were roughened. In all these runs, land surface temperatures were allowed to vary, while sea surface temperatures were held fixed. Here we consider runs in which there are three regions of enhanced surface roughness length. All runs enhance roughness in the same regions (over central North America, western Europe, and eastern Asia), but with varying roughness lengths. There are seven enhanced roughness runs, each 15 yr long. There are four control runs, each also 15 yr long. Enhanced roughness runs and control runs are separately averaged together; the differences of the two ensembles are presented below.
4. Results and discussion a. Aquaplanet runs Figures 3–10 show the results of the aquaplanet simulations. The aquaplanet model differs from the shallowwater model in several obvious ways: there is no rigid lid, and the flow is compressible, so divergence and vertical motions are possible; evaporation of water vapor and release of latent heat in the atmosphere are possible; radiation can damp temperature anomalies; and surface fluxes include sensible and latent heating, as well as momentum damping. Nevertheless, as we will show, the results of experiments with regions of enhanced surface roughness are qualitatively quite similar to the results for the shallow-water model. In the difference panels, significance is indicated by crosshatching, and determined by breaking the data into three equal time blocks, taking the standard deviation over the three chunks for each grid square, and requiring, for significance, that the differences at a given latitude be larger than the maximum standard deviation for that latitude. That is, at each crosshatched point, the difference between the experiment and the control run is larger than the variability of this difference at any point at that latitude. The background state,
2220
JOURNAL OF THE ATMOSPHERIC SCIENCES
VOLUME 65
FIG. 3. Aquaplanet 2-m zonal wind. (a) Results from the control run; (b) results for a 20°-wide circular area of high roughness centered at 40°N; (c) results for a 10°-wide rough area centered at 40°; (d) results for 10° centered at 30°N.
shown in the top panel of Fig. 3, is simple, with bands of east and west zonal winds at the surface. The zonal wind bands correspond to bands of equatorward and poleward meridional winds forced by surface friction (not shown). The lower panels of Fig. 3 show a clear reduction in the magnitude of the zonal flow in the (circled) regions of enhanced surface roughness. Taking the differences between the control case and the three cases with enhanced roughness, we see this strong reduction in surface winds confirmed in Fig. 4. Maximum reductions in surface zonal winds are 5.5 m s⫺1 for case A, 4.5 m s⫺1 for case B, and 4.9 m s⫺1 for case C, from control values of 9.4 m s⫺1 in heart of the zonal wind belt. Zonal winds to the north and south of
the roughened patches appear enhanced in Fig. 4, but it should be noted that these represent reductions in wind speed in regions where the surface winds were easterly in the control case. The magnitude of the meridional component of the surface wind (Fig. 5) is also reduced in the region of enhanced roughness, but to a lesser degree than the zonal wind, so that the angle of the wind direction in the southern half of the roughened region, where winds are southwesterly, increases from 198° to 205°. This represents the expected increase in the cross-isobar component of the wind as friction increases. As for the shallow-water model results above, these reductions in wind speed in the region of enhanced
JULY 2008
KIRK-DAVIDOFF AND KEITH
2221
FIG. 4. Aquaplanet 2-m zonal wind anomalies. (a) Difference between the run with a 20°-wide circular area of high roughness centered at 40°N and the control run; (b) difference for a 10°-wide rough area centered at 40°; (c) difference for 10° centered at 30°N. Crosshatching shows points where changes are significant, according to the standard explained in the text.
surface roughness require changes in both meridional and vertical wind speeds outside the roughened region to satisfy mass conservation and momentum balance. In each case, inspection of the region immediately southwest of the rough patch shows convergence in the zonal wind and divergence in the meridional wind. At the eastern edge of the rough patch, the zonal wind is divergent and the meridional wind is convergent. Thus, there are anomalously southerly winds to the northwest and southeast of rough patches, and anomalously northerly winds to the southwest and northeast of the rough patches. As in the shallow-water simulations, the
meridional velocity anomalies are not symmetric, but rather extend farther to the east of the rough patches than to the west. Further, the strongest meridional anomalies occur within the belt of westerly mean winds. The different results for cases A and B confirm the shallow-water model prediction that meridional velocities scale in both size and magnitude with the length scale of the rough patch, so that a larger rough patch results in both spatially larger and more intense meridional and zonal wind anomalies. To test whether results shown here can be fully attributed to the stationary wave response, we can examine the stationary and tran-
2222
JOURNAL OF THE ATMOSPHERIC SCIENCES
VOLUME 65
FIG. 5. Aquaplanet 2-m meridional wind anomalies. (a) Difference between the run with a 20°-wide circular area of high roughness centered at 40°N and the control run; (b) difference for a 10°-wide rough area centered at 40°; (c) difference for 10° centered at 30°N.
sient eddy components of the anomaly in meridional flux of zonal momentum, u and ⬘u⬘. These fluxes are shown for the lowest-model-level winds in Fig. 6. The stationary wave component of the momentum flux anomaly is larger than the transient component by an order of magnitude. Similar results are found at different model levels and for fluxes of sensible heat (not shown). Because sea surface temperatures are held fixed in the aquaplanet runs, air temperature changes are smaller and, presumably, of different geographic distribution than they would be in a fully coupled model. Figure 7 shows the surface air temperature anomaly.
The warm anomaly in the roughened patch is a straightforward consequence of the increased roughness length, which results in a 5-times-larger heat flux transfer coefficient, and thus substantially larger sensible heat fluxes from sea to atmosphere even for reduced winds. The temperature anomalies outside the rough patch are clearly correlated with the meridional wind anomalies via temperature advection: northerly wind anomalies yield cold surface air temperature anomalies, while southerly meridional wind anomalies yield warm surface air temperature anomalies. Both the meridional wind and the surface air temperature anomalies scale with the size of the roughened
JULY 2008
KIRK-DAVIDOFF AND KEITH
2223
FIG. 6. Aquaplanet lowest-model-level momentum fluxes. (a) Stationary wave flux. (b) Transient eddy flux.
region. Thus, for case A, the largest meridional surface wind anomaly is ⫺2.1 m s⫺1, and the largest temperature anomaly outside the rough patch itself is ⫺0.4 K, while for cases B and C, where the roughened region is half the width of the roughened region in case A, the largest surface wind anomalies are ⫺1.2 and ⫺1.1 m s⫺1, respectively, while the largest temperature anomalies are ⫺0.2 K for both cases B and C. Thus the meridional wind and surface temperature anomalies (outside the roughened region) scale linearly with the length scale of the region for these experiments. Figure 8 shows anomalies of 850-hPa meridional (the vertical velocity in pressure coordinates, positive downward), cloud fraction, downward-directed solar radiative flux, and upward-directed infrared radiative flux for case A (the other cases show similar but weaker patterns). There is a consistent pattern of decreased cloud fraction on the northeast flank of the roughened region, with increased cloud fraction on the northwest flank and directly to the east. These changes are consistent with, though not directly proportional to, changes in vertical velocity, which in turn are related to temperature advection by the meridional wind anomalies. In addition, the positive (poleward) meridional surface wind anomaly to the south of the roughened region results in surface divergence that weakens upward vertical velocity in the aquaplanet ITCZ. This re-
sults in a sharp increase in the surface solar flux, and a significant increase in the surface IR cooling along a line just north of the equator, south of the roughness anomaly. Despite the strong radiative flux changes, cloud fraction in this band does not change noticeably. Rather, radiative changes result from reductions in cloud optical depth. Because, in general, increasing cloud fraction is related to both decreasing downward surface solar flux and decreasing upward infrared flux, of approximately equal magnitudes, the sum of infrared and solar flux is unrelated to cloud fraction. These relationships are shown as scatterplots in Fig. 9 for case A. Grid points within the roughened region are shown with a red circle around the data point. Correlations are somewhat different in the roughened region and outside that region. In particular, cloud fraction is positively correlated with poleward meridional wind speed outside the roughened region, but not within it, while upward IR and sensible and latent heat fluxes are negatively correlated with poleward wind speed outside the roughened region, but poorly correlated within it. This difference is due to the direct influence of the roughness changes on surface fluxes within the rough region, which overwhelms the secondary effect of wind changes. We conclude that in regions outside the roughened patch at least a third (r2 ⫽ 0.37) of the point-by-point change in temperature can be at-
2224
JOURNAL OF THE ATMOSPHERIC SCIENCES
VOLUME 65
FIG. 7. Aquaplanet 2-m air temperature anomalies. (a) Difference between the run with a 20°-wide circular area of high roughness centered at 40°N and the control run; (b) difference for a 10°-wide rough area centered at 40°; (c) difference for 10° centered at 30°N.
tributed to surface wind direction changes due to the roughness change. A small fraction of the variability is caused by climate noise (about 0.1 K). The remaining fraction of the variability must be caused by more subtle changes in the flow that lead to radiative forcing of the surface temperature. Note that cloud fraction anomaly is positively correlated with meridional wind anomaly, but that the impact on surface temperature is muted, since the cloud fraction increases are accompanied by approximately canceling reductions in downward solar flux and upward IR flux. Wind anomaly patterns for case A at 850- and 500hPa pressure surfaces (Fig. 10) are similar to those at the surface, except that the patterns become more sym-
metric as pressure decreases, and a clear global stationary wavenumber 5 pattern becomes apparent in the meridional wind anomaly at 500 hPa. The penetration of the wind anomaly to the middle troposphere is strongly dependent on horizontal scale. For case A, the ratio of the negative wind anomaly over the rough region at 500 hPa to the anomaly at the surface is 1.07, while for cases B and C (not shown) the ratios are 0.75 and 0.60. In summary, the imposition of a patch of increased surface roughness on an otherwise smooth world results in a slowing of winds directly over the roughened region. This deceleration forces a stationary wave response, trapped within the band of westerly zonal wind.
JULY 2008
KIRK-DAVIDOFF AND KEITH
2225
FIG. 8. (a) Difference in vertical wind in pressure coordinates between the run with a 20°-wide circular area of high roughness centered at 40°N and the control run; (b) difference in cloud fraction for the same run as in (a); (c) difference in downward surface solar radiative flux; (d) difference in upward surface infrared radiative flux.
This response is largely barotropic, extending through the troposphere, for a sufficiently large roughened region; the ratio of wind anomaly aloft to surface anomaly is smaller for a smaller roughened region. Vertical velocity anomalies are largely associated with temperature advection associated with the meridional wind anomalies. The meridional velocity anomalies are associated with advective temperature changes, while the vertical velocity anomalies are associated with changes in cloud fraction and precipitation (not shown). The cloud fraction changes result in surface solar and infrared flux changes that in this case almost perfectly can-
cel, but in principle could result in either heating or cooling, depending on the details of the mean cloud field.
b. Full-model runs As discussed in KEA04, the imposition of additional surface roughness in three large regions (North America, Europe, and eastern Asia) resulted in a number of statistically significant changes in climate. Global mean temperature change was very small, but local changes in temperature of up to 2 K were found in various locations (see Fig. 11). In this section we will
2226
JOURNAL OF THE ATMOSPHERIC SCIENCES
VOLUME 65
FIG. 9. Scatterplots of aquaplanet temperature and surface energy flux anomalies plotted against meridional surface wind anomalies for case A (rough region centered at 40°N, with a radius of 10° latitude and longitude). Red circled data points lie within the roughness anomaly, while blue crossed data points lie outside the roughness anomaly. Correlation coefficients for each set of points are indicated in the legends, and linear regression fit lines are shown for each subset of data points: (a) surface air temperature, (b) cloud fraction, (c) surface solar flux, (d) surface IR flux, (e) surface sensible heat flux, and (f) surface latent heat flux.
discuss the surface energy budget changes, in order to give a physical explanation for the changes in temperature. We also compare results for the full-model runs with three roughened regions with results from a set of runs with a single roughened region in North America of two different sizes. Inspection of Fig. 11 shows that 2-m air temperature anomalies are not related in a geometrically simple way
to the roughness forcing (note that SSTs were held fixed in these runs, so surface air temperatures do not change substantially over the oceans). Over North America, there is a region of strong warming centered on, but extending beyond on all sides, the region where surface roughness was increased. In Europe, there is a slight cooling in the region where roughness was increased, but there is strong cooling northeast of the
JULY 2008
KIRK-DAVIDOFF AND KEITH
FIG. 10. Aquaplanet tropospheric wind anomalies. (a) Difference in 850-hPa zonal wind between the run with a 20°-wide circular area of high roughness centered at 40°N and the control run; (b) 500-hPa zonal wind difference; (c) 850-hPa meridional wind difference; (d) 500-hPa meridional wind difference.
FIG. 11. Full-model 2-m air temperature anomalies. Grid points with the symbol * indicate locations of increased surface roughness intended to simulate wind turbine installations.
2227
2228
JOURNAL OF THE ATMOSPHERIC SCIENCES
VOLUME 65
FIG. 12. Full-model 2-m winds (m s⫺1). (a) Control zonal wind; (b) zonal wind anomaly; (c) control meridional wind; (d) meridional wind anomaly.
roughened region, and moderate warming south and east of the roughened region. In East Asia, there is again slight cooling where the roughness was increased, and again strong cooling to the north and east. Warming to the south and east is precluded since sea surface temperatures are held fixed. To understand the causes of this pattern of temperature change, we turn first to the wind anomalies. Figure 12 shows the surface zonal and meridional winds in the control runs, and the anomalies when the mean of the control runs is subtracted from the mean of the runs with wind turbines. As in the aquaplanet runs, the results are straightforward: slowing of the mean wind over the roughened regions, with accompanying patterns of divergence and convergence at the upstream
and downstream boundaries of the roughened regions. Figure 13 shows that, as in the aquaplanet experiments, the response is largely barotropic: wind anomalies at 850 and 500 hPa are similar in magnitude and distribution to those at the surface. As in the aquaplanet case, the zonally varying response to the roughness changes is dominated by the stationary wave response, with the transient eddy response negligible by comparison (not shown). The zonal mean temperature response shows a net cooling at high latitudes in both hemispheres of about 0.15 K, and calculations of the zonal mean meridional energy transport show slight, but statistically significant reductions of poleward meridional energy flux in both hemisphere of 0.02 PW. These small zonal mean reductions in meridional heat flux are equally
JULY 2008
KIRK-DAVIDOFF AND KEITH
2229
FIG. 13. Full-model tropospheric wind anomalies (m s⫺1). (a) 850-hPa zonal wind; (b) 500-hPa zonal wind; (c) 850-hPa meridional wind; (d) 500-hPa meridional wind.
distributed between transient and zonal mean eddy fluxes. We next examine changes in surface heat fluxes. Figure 14 shows changes in solar, infrared, sensible, and latent heat at the surface, due to increased surface roughness. Figure 15 shows changes in vertical pressure velocity (w), cloud fraction, and precipitation. We see that changes in individual components of the surface heat budget are somewhat more consistent from one roughened region to another than are changes in temperature. For example, North America and east Asia, despite having oppositely signed temperature anomalies, both show reductions in downward solar flux in the roughened regions, reductions in upward surface infrared radiative flux and sensible heat flux, while both
show increases in latent heat flux and in the meridional wind component. Thus, oppositely signed changes in surface air temperature over these regions must result from differing magnitudes of surface energy fluxes that are consistent in sign in each of the roughened regions. The surface roughness changes cause changes in the surface energy fluxes through several distinct mechanisms. First, an increase in surface roughness directly causes an increase in the aerodynamic drag coefficient. This means that for a given temperature difference between the surface and the 2-m reference height, the sensible and latent heat fluxes will be larger; over land regions where the surface energy budget must be in equilibrium over long time scales, this means that the 2-m temperature will be closer to the surface tempera-
2230
JOURNAL OF THE ATMOSPHERIC SCIENCES
VOLUME 65
FIG. 14. Full-model results for the surface energy budget (W m⫺2). (a) Downward surface solar radiative flux. (b) Upward surface IR radiative flux. (c) Upward sensible heat flux. (d) Upward latent heat flux.
ture (and thus generally cooler), so that the sensible and latent heat fluxes can remain in balance with the sum of solar and infrared radiative flux, whose change is relatively small. Second, a change in surface roughness may result in a change in surface wind, and in winds aloft, if these changes result in a change in temperature advection. If temperatures aloft are warmed, this will tend to reduce the net upwelling infrared radiative flux. Warm advection will also tend to reduce upward sensible and latent heat fluxes by reducing the temperature difference between the ground and the air. Finally, increasing surface roughness causes local changes in vertical velocity that partially compensate for divergence and convergence in the zonal wind,
while changes in meridional wind result in temperature advections that are also associated with vertical wind anomalies. These in turn cause cloud changes that cause changes in both the downwelling infrared radiance and the surface solar radiation flux. These relationships are shown in Fig. 16, where, as in Fig. 9, the relationship between meridional wind anomaly and surface air temperature, cloud fraction, and surface energy fluxes is shown. Grid points within the roughened regions are indicated by a red circle, land points (where surface temperatures are allowed to vary freely) outside the roughened region are shown as black dots, while ocean points (where SST is held fixed, as in the aquaplanet runs) are marked with blue
JULY 2008
KIRK-DAVIDOFF AND KEITH
2231
FIG. 15. Full-model results for vertical winds, clouds, and precipitation. (a) Vertical wind () (hPa s⫺1). (b) Cloud fraction. (c) Precipitation (m yr⫺1).
crosses. These plots are generally consistent with those in Fig. 9, although the correlations are generally weaker, especially over land. Weaker correlations over land are reasonable, since both the surface-to-air temperature difference and the surface fluxes can independently adjust to changes in temperature advection. Weaker correlations even over ocean regions may be due to the greater unforced variability in the full-model simulations. The meridional wind anomaly is, as for the aquaplanet results, positively correlated with the surface air temperature anomaly. This association occurs because of the increased advection of heat associated with poleward meridional wind anomalies and because of the enhanced downward infrared radiation flux associated with warm advection aloft. Cloud fraction increases with increasing meridional wind as well, but, as with the aquaplanet simulation, its global impact is small because of the cancellation of its impacts on the solar radiative flux (cooling) and the infrared radiative flux (warming). In contrast with the aquaplanet runs, the correlation of cloudiness and meridional wind holds only over the roughened regions themselves (where r ⫽ 0.51); the correlation is very small outside the roughened regions (r ⫽ 0.12). The difference may be due to
the relative smallness of the meridional wind anomalies outside the roughened regions, which prevents the cloud impacts from rising above the climate noise, while within the rough regions the meridional wind anomalies are larger, and the impact on clouds more significant. It is instructive to compare the results for multiple roughened regions and for a single roughened region. Again, the NCAR CAM3.1 model is used, with fixed sea surface temperatures. Figure 17 shows the zonal wind anomaly at three levels of the atmosphere for a single roughened region, either 10° of latitude and longitude on a side, or 20°. The roughened region is located over North America, and is indicated in the figures by a black square. As with the aquaplanet results, the penetration of the surface wind anomaly to the free troposphere depends strongly on the scale of the roughened region. The anomalies due to the smaller roughened region shown in the left-hand panels are only spottily significant at the 95% confidence level at a small fraction of grid points, indicating a lack of overall significance to the pattern, except for the reduction of lowest-model-level westerlies directly over the roughened region in Fig. 17a. For the larger roughened re-
2232
JOURNAL OF THE ATMOSPHERIC SCIENCES
VOLUME 65
FIG. 16. As in Fig. 9, but for full-model results. Temperature and surface energy flux anomalies plotted against meridional surface wind anomalies. Red circled data points lie within the roughness anomalies, black dotted data points are land data points lying outside the roughness anomalies, and blue crossed data denote ocean data points. Correlation coefficients for each set of points are indicated in the legends, and regression lines are plotted for each subset of data points.
gion simulated in Figs. 17b,d,f, the anomaly pattern shows coherent statistically significant results extending far downstream and penetrating upward through the 500-hPa level. The regional pattern of wind change confirms the broad pattern found in the other runs—reduction of winds over the roughened region and larger anomalies downstream than upstream—but it also reveals the
strong dependence of the details of these effects on the size and placement of the roughened region. The strong increase in the westerly wind component over the Atlantic in Figs. 17b,d,f, but not seen in the KEA04 simulations, shows a strong dependence of the results on the exact location of the roughened region: in the single large roughened region case, its eastern boundary extends to 84°W, while in the KEA04 results, the North
JULY 2008
KIRK-DAVIDOFF AND KEITH
2233
FIG. 17. Full-model results for a single rough patch (roughened region is indicated with a square). Zonal wind anomalies are shown at the model sigma coordinate levels equivalent to approximately (a), (b) 992; (c), (d) 867; and (e), (f) 511 hPa. In (a), (c), and (e) results are shown for a relatively small (⬇10° longitude and latitude) rough region, while in (b), (d), and (f) results are for a relatively large (⬇20°) rough region.
American roughened region extends only to 92°W. Comparing wind changes over Scandinavia, we see that a single North American rough region causes a strong reduction in winds, while the addition of a European roughened region shifts the region of negative zonal wind anomalies down over the roughened region (see Fig. 13), and causes a weak positive anomaly over Scandinavia. These results show that the stationary wave response to changes in surface roughness is strongly modulated by the details of the background flow (thus the differences between the aquaplanet results and single North American rough region results), but suggest that the response of the flow to multiple wind farms may be understood as a linear superposition of the response to individual rough regions. Further ex-
periments will be needed to convincingly demonstrate this linearity.
5. Conclusions The results of our model experiments demonstrate that the addition of surface roughness anomalies can have a noticeable impact on model surface climate. This impact occurs as a consequence of changes in the surface and tropospheric wind fields. Slowing of the zonal wind over the roughened region yields stationary wave patterns of divergence and convergence that are associated with meridional and vertical wind anomalies that in turn affect temperature advection and cloud
2234
JOURNAL OF THE ATMOSPHERIC SCIENCES
fraction. These changes in turn affect the surface heat budget, resulting in the observed temperature anomalies. In addition to these explanatory findings, we have also shown that the climate impact of the roughness anomalies scales with their horizontal extent as well as with their roughness. This scaling occurs both because the amplitude of the barotropic response scales with the horizontal scale of the wind farm, and because the penetration of the wind anomaly from the surface increases with horizontal scale. Our results demonstrate the temperature changes pointed out by KEA04 are the result of straightforward physical processes that are likely, at the level of individual components of the surface energy budget, to be replicated in any GCM. Thus we can have some confidence that the predicted changes in these individual terms would actually occur were such synoptic-scale roughness anomalies ever to be created via wind turbine construction. However the net surface temperature changes are the result of delicate balances among these energy budget changes, and so may be expected to depend on details of model parameterizations, especially of cloud processes. In ongoing work, we are performing simulations with a slab ocean model, which allows a larger temperature response to the circulation changes over the ocean, and may be expected to alter the spatial pattern of both wind and temperatures. In addition, we are exploring the impact of time-varying changes of roughness, including the implications for weather modification on the synoptic scale. Acknowledgments. This research was made possible through support from the Center for Integrated Study of the Human Dimensions of Global Change. This Center has been created through a cooperative agreement between the National Science Foundation (SBR9521914) and Carnegie Mellon University. Additional support was provided via National Science Foundation Grant ATM-0457515. We thank two anonymous reviewers for helpful criticisms and suggestions.
VOLUME 65
REFERENCES Christiansen, M. B., and C. B. Hasager, 2005: Wake effects of large offshore wind farms identified from satellite SAR. Remote Sens. Environ., 98, 251–268, doi:10.1016/j.rse.2005.07.009. Collins, W. D., and Coauthors, 2006: The formulation and atmospheric simulation of the Community Atmosphere Model version 3 (CAM3). J. Climate, 19, 2144–2161. Cook, K. H., and I. M. Held, 1992: The stationary response to large-scale orography in a general circulation model and a linear model. J. Atmos. Sci., 49, 525–539. European Wind Energy Association, 2005: Wind Force 12: A blueprint to achieve 12% of the world’s electricity from wind power by 2020. European Wind Energy Association Rep., 52 pp. [Available online at http://www.ewea.org/fileadmin/ ewea_documents/documents/publications/WF12/wf12-2005. pdf.] Grubišic´ , V., R. B. Smith, and C. Schär, 1995: The effect of bottom friction on shallow-water flow past an isolated obstacle. J. Atmos. Sci., 52, 1985–2005. Holton, J. R., 2004: An Introduction to Dynamic Meteorology. Academic Press, 535 pp. Hoskins, B. J., 1983: Dynamical processes in the atmosphere and the use of models. Quart. J. Roy. Meteor. Soc., 109, 1–21. Keith, D. W., J. F. DeCarolis, D. C. Denkenberger, D. H. Lenschow, S. L. Malyshev, S. Pacala, and P. J. Rasch, 2004: The influence of large-scale wind-power on global climate. Proc. Natl. Acad. Sci. USA, 101, 16 115–16 120, doi:10.1073/pnas. 0406930101. Lange, B., H.-P. Waldl, R. Barthelmie, A. G. Guerrero, and D. Heinemann, 2003: Modelling of offshore wind turbine wakes with the wind farm program FLaP. Wind Energy, 6, 87–104. Pacala, S., and R. Socolow, 2004: Stabilization wedges: Solving the climate problem for the next 50 years with current technologies. Science, 305, 968–972, doi:10.1126/science.1100103. Richter, I., and C. R. Mechoso, 2004: Orographic influences on the annual cycle of Namibian stratocumulus clouds. Geophys. Res. Lett., 31, L24108, doi:10.1029/2004GL020814. Rooijmans, P., 2004: Impact of a large-scale offshore wind farm on meteorology: Numerical simulations with a mesoscale circulation model. M.S. thesis, Department of Physics and Astronomy, Utrecht University, 41 pp. Roy, S. B., S. Pacala, and R. L. Walko, 2004: Can large wind farms affect local meteorology? J. Geophys. Res., 109, D19101, doi:10.1029/2004JD004763. Schär, C., and R. B. Smith, 1993: Shallow-water flow past isolated topography. Part I: Vorticity production and wake formation. J. Atmos. Sci., 50, 1373–1400.