Expression, Linkage, and Polymorphism of MHC-Related Genes in Rainbow Trout, Oncorhynchus mykiss1,2 John D. Hansen,3* Pamela Strassburger,* Gary H. Thorgaard,†‡ William P. Young,4† and Louis Du Pasquier* The architecture of the MHC in teleost fish, which display a lack of linkage between class I and II genes, differs from all other vertebrates. Because rainbow trout have been examined for a variety of immunologically relevant genes, they present a good teleost model for examining both the expression and organization of MHC-related genes. Full-length cDNA and partial gDNA clones for proteasome d, low molecular mass polypeptide (LMP) 2, TAP1, TAP2A, TAP2B, class Ia, and class IIB were isolated for this study. Aside from the expected polymorphisms associated with class I genes, LMP2 and TAP2 are polygenic. More specifically, we found a unique lineage of LMP2 (LMP2/d) that shares identity to both LMP2 and d but is expressed like the standard LMP2. Additionally, two very different TAP2 loci were found, one of which encodes polymorphic alleles. In general, the class I pathway genes are expressed in most tissues, with highest levels in lymphoid tissue. We then analyzed the basic genomic organization of the trout MHC in an isogenic backcross. The main class Ia region does not cosegregate with the class IIB locus, but LMP2, LMP2/d, TAP1A, and TAP2B are linked to the class Ia locus. Interestingly, TAP2A (second TAP2 locus) is a unique lineage in sequence composition that appears not to be linked to this cluster or to class IIB. These results support and extend the recent findings of nonlinkage between class I and II in a different teleost order (cyprinids), suggesting that this unique arrangement is common to all teleosts. The Journal of Immunology, 1999, 163: 774 –786.
I
n mammalian immune systems, the essential function of Ag presentation is achieved by a complex process involving different molecules and different pathways. The final result is the presentation of peptides by the MHC-encoded class I and II molecules to cytotoxic (CD8) and helper (CD4) T cell subsets (1, 2). Class I genes can be divided into two categories (classical or nonclassical), based upon structural, functional, and expression criteria (3, 4). Classical class I H chains (Ia) are broadly polymorphic, are expressed on most cell types and tissues, and present endogenously derived peptides to cytotoxic T cells. In contrast, nonclassical class I genes (1b) display limited polymorphism and are restricted in expression with a function that is beginning to be resolved (5, 6). Class I molecules are heterodimers composed of a variable membrane spanning glycosylated H chain that is noncovalently associated with b2-microglobulin (b2m) for the presentation of endogenously derived peptides. The assembly and loading of class I heterodimers with processed peptide is achieved by several other molecules, some encoded within the MHC and some not, in an overall sequence commonly referred to as the class I pathway. *
Basel Institute for Immunology, Basel, Switzerland; and Departments of †Zoology, Genetics, and Cell Biology, Washington State University, Pulman, WA
‡
Received for publication January 7, 1999. Accepted for publication April 13, 1999. The costs of publication of this article were defrayed in part by the payment of page charges. This article must therefore be hereby marked advertisement in accordance with 18 U.S.C. Section 1734 solely to indicate this fact. 1 The Basel Institute for Immunology was founded and is supported by F. Hoffman-La Roche, AG, Basel, Switzerland. 2 Sequences described in this report have been deposited in GenBank under the following accession numbers: AF002171–2180, AF115518 –28, AF115533, and AF115536 –5541. 3
Address correspondence and reprint requests to Dr. John D. Hansen, Basel Institute for Immunology, 487 Grenzacherstrasse, CH-4005 Basel, Switzerland. E-mail address:
[email protected] 4 Current address: Department of Biological Sciences, Northern Arizona University, Flagstaff, AZ.
Copyright © 1999 by The American Association of Immunologists
One of the main locations for peptide generation is the cytoplasm, which contains soluble proteases and the multicatalytic proteasome complex (7). Upon IFN-g induction, the proteasome housekeeping subunits d, e, and MC14 are replaced by low molecular mass polypeptide (LMP)5 2 and LMP7, which are encoded within the mammalian class II region (8), as well as by MECL1, which is located outside of the MHC (9 –12). This reciprocal exchange influences the proteasome’s ability for processing proteins into peptides suitable for class I presentation (13, 14). The processed peptides are then transported from the cytosol into the lumen of the endoplasmic reticulum (ER) by the ATP-dependent heterodimeric TAP1 and TAP2 proteins, which are encoded within the mammalian class II region, intermingled with the LMP genes (15–17). Once transported into the lumen, the peptides are held by the TAPs for delivery to the trimolecular b2m-calreticulin-class I complex (18). Recent studies have also demonstrated that two categories (permissive or restrictive) of TAP2 present in mammals directly influence the types of peptides that are transported and subsequently loaded onto specific class I molecules (19). After a peptide is properly loaded, the class I-b2m-peptide complex is brought to the surface for peptide presentation to CD81 cytotoxic T cells (1, 20). In mammals the majority of these molecules are encoded within a single genetic region, the MHC, the organization of which can vary considerably from one order to another, making it difficult to distinguish the essential from the accessory (21). Genes can vary in number and position, and the functional meaning of linkage within the MHC is poorly understood. Chickens offer a variation on the theme by displaying what has been called a minimal MHC, 5 Abbreviations used in this paper: LMP, low molecular mass polypeptide; SSCP, single strand conformational polymorphism; LRPCR, long range PCR; PCR-RSA, PCR restriction site analysis; PFGE, pulse field gel electrophoresis; UAA, UBA, and UCA, teleost class I lineages; DAB, class IIB; gDNA, genomic DNA; b2m, b2microglobulin; UTR, untranslated region; ORF, open reading frame; ER, endoplasmic reticulum; OSU, Oregon State University: clonal line-142; HC, Hot Creek: clonal line-E1B.
0022-1767/99/$02.00
The Journal of Immunology
775
Table I. Locus-specific primers utilized within this study Locus (accession no.)
TAP1A*01 (AF115536) TAP2A*01 (AF002171) TAP2B*01 (AF115538) LMP2 (AF115541)
LMP2/d (AF115540)
Proteasome-d (AF115539) MHCI UAA*KD6 (AF115521)
MHCIIB DAB*K12 (AF115534)
a
Sequence
59-ATGCCGAAAATGAACTTCTCT-39 59-TGGTAAGAAGAGAAGGGACGTA-39 59-ATGCCCAGAGAAGGCTGATGT-39 59-ATGGCTCATTTAAAAACATATGG-39 59-GTGTCTGGTTTGCAGTAT-39 59-CACCAGACCCAGGTCGTTGGCAGT-39 59-ATGGCTGTAGGTCTATGCAT-39 59-TAGAAGATGAGGACTCTCATG-39 59-TATGAGTCGAGATGGTTCCAG-39 59-GTGAATCACCCAAAGACACAG-39 59-GGACCACCATCATTGCTATT-39 59-ATAGACGTAGGAGCTTCCAGA-39 59-CCTGGCTATGGGCAGAGACA-39 59-GTGAATAGTTAGGCCTATGA-39 59-GCACCACCATCATGGCAGT-39 59-GTAACCGTAGATGTATGTGCT-39 59-CTGTCCCTGGCTATGGAGAG-39 59-CTGAAGGGCTTTAGAAACTC-39 59-TCCCTGAAGTATTTCTACAC-39 59-TTTGGTTAAAACGCTGCTTTA-39 59-GGTGTGCACATTGTCCAGAAG-39 59-AGAGTGCTCTTCCCATAGTC-39 59-CAGTGTCTCTGCTCCAGAAGG-39 59-TCAGAACCTCGATGAAGTCCTT-39 59-TCTCTGGAACAGATGGATATTT-39 59-CGCCTGCTCTTGACCCAGGAT-39 59-CATGTCAGACTGAGCTCAGTG-39 59-GTGATACATCATGGGCTCAGT-39
Direction
Genbank Position
Usagea
S1 A1 A2 S1 A1 A2 S1 A1 S1 A1 S2 A2 S1 A1 S2 A2 S1 A1 Sa1 Aa1 Sa2 Aa2 Sa3 Aa3 Sb1 Ab1 Sb2 Ab2
(138–158) (507–528) (385–405) (90–112) (530–547) (363–386) (98–117) (517–537) (643–663) (1023–1043) (156–175) (542–562) (592–611) (817–836) (105–123) (503–523) (549–568) (727–746) (108–127) (340–360) (366–386) (615–634) (655–675) (897–918) (53–74) (299–319) (346–366) (595–615)
Southern/Northern Southern-L/Northern Southern SSCP/Southern SSCP Southern SSCP/Southern SSCP/Southern SSCP SSCP Southern Southern PCR-RSA PCR-RSA Southern/Northern Southern/Northern SSCP/Southern/Northern SSCP/Southern/Northern SSCP/PCR-RSA/Northern SSCP/PCR-RSA/Northern Southern/Northern Southern/Northern Southern/Northern Southern/Northern SSCP SSCP PCR-RSA/Northern PCR-RSA/Northern
Southern-L designates the TAP1 reverse primer utilized for generating the segregation analysis probe.
where a reduced number of elements can be found (22). Some species of Xenopus demonstrate that the physical linkage of LMP2 to the MHC is not necessary for class I expression (23). Now, teleost fish offer yet another chaotic variation on the MHC architectural design since, so far in the species reported, zebrafish class I and II are not linked (24). Whether the teleost situation reflects an evolutionary accident or simply an intermediate step will require studies in more primitive fish, such as the elasmobranchs (cartilaginous), but also within other teleosts, to see whether important intraspecific order variation can be observed like what is found in mammals. If found in another teleost category such as salmonids (trout and salmon), which last shared a common ancestor with the cyprinid order (zebrafish, carp, etc.) over 120 million years ago (25), it will be important to examine the functional consequences if any from this architecture. Reactions typically associated to the MHC and T cell receptors are found in teleosts, including efficient allograft rejection and MLR reactions to allogenic Ags (26). In addition, genes (MHC and TCR) relevant to this process have been cloned and characterized in several species of teleosts (27). We have chosen the rainbow trout as our immunological model for studying the MHC, based upon characterizations of TCRA/B, class Ia and Ib loci, b2m, and class IIB genes in this fish (28 –32). Additionally, a recent genetic map, comprising 31 major linkage groups, that correlates well with a haploid range of 30 –32n has been reported, and isogenic clonal lines of trout are available for asking a broad range of biological questions (33, 34). Accordingly, identification of loci associated with disease resistance is of major relevance for the maintenance and preservation of this species, which is plagued by a variety of pathogens. Previously we cloned and characterized the first MHC class Ia gene (UAA-C32) from trout (30). Here we extend our investigations to include other members of the class I pathway (TAP/LMP) and the class IIB loci in this teleost to investigate several questions: a) Are these alleles/loci polymormphic? b) What are their
expression patterns? and c) What is the degree of linkage between these multiple loci and can these results tells us something about the origin and evolution of MHC architectural arrangements?
Materials and Methods Animals Rainbow trout (Oncorhynchus mykiss, ARO-F2, Idaho origin, 2 females crossed with 1 male) were obtained from Aquatic Research Organisms (Hampton, NH) and maintained in 14°C water at the Basel Institute for Immunology. Killing was accomplished using 100 mg/ml MS-222 (Novartis, Basel, Switzerland) supplemented with 150 mg/ml sodium bicarbonate. The generation and crossing of diploid OSU and HC isogenic trout have been previously described (33). Male hybrids between the OSU line and HC clonal lines were backcrossed to females from the OSU line for use in linkage studies.
PCR amplification of trout TAP2, LMP2, and proteasome d cDNA probes A portion of TAP2, LMP2, and proteasome d was amplified using sets of degenerate primers based on alignments of available TAP and LMP2/proteasome d sequences. Briefly, 100 pg (1 ml) of pronephric or thymic cDNA was added to 24 ml of 13 PCR buffer (GeneAmp, Hoffman-La Roche, Basel, Switzerland) supplemented with 2 mM MgCl2, 200 mM dNTPs, 100 –150 pmols of each degenerate primer (TAP2 sense, 59-GCIGCIGM RAARGTNTTY-39, and antisense, 59-CARGARCCIGTIYTNTTY-39; and LMP2 and/or d sense, 59-GGIACIACIATHATGGCNGT-39, and antisense, 59-GCITCIACRTANCCRTADAT-39), and 1 U of Amplitaq (Hoffman-LaRoche). The PCR profile was 94°C for 15 s, 45°C for 30 s, and 72°C for 30 s for three cycles, followed by 35 cycles of 94°C for 15 s, 48°C for 30 s (plus 0.15°C per cycle step increment), and 72°C for 30 s, with an additional extension time of 10 min. PCR products were cloned into the pCRII vector according to the manufacturer’s suggestions (TA cloning kit, Invitrogen, San Diego, CA). Forty random clones were sequenced from each amplification and used in a BLASTX search to identify clones containing TAP2, LMP2, and proteasome d. These clones were diluted, reamplified, and purified using Qiaquick PCR columns (Qiagen, Basel, Switzerland), randomly primed (Life Technologies, Gaithersburg, MD) with [32P]dCTP (Amersham, Arlington Heights, IL) and then used as homologous probes to screen thymocyte and pronephric cDNA libraries.
776
MHC-RELATED GENES IN TROUT
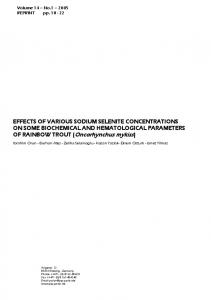
PCR amplification of MHCI and -IIB The polymorphism for class Ia a1 and -a2 and class IIBb1 and -2 was analyzed by PCR, using cDNA libraries and first strand thymic, spleen, and pronephric cDNAs as templates. For the class I analysis, an anchored a3 reverse primer (59-ACTCCACTGGGGTAGAAACC-39) was used in conjunction with a T3 universal primer for the initial amplification of the 59UTR, leader, a1, a2, and a portion of a3 from a peripheral blood cDNA library. Two different leader sequences were identified and used for this study (L1c, 59-ATGAAGGGTATTATCTTGCTG-39, and L2u, 59-AT GAAGTCTTTCATCATTTTGCTC-39). To amplify the b1 and b2 domains of OSU and HC class IIB, a reverse primer (32) (59-TCTCAGC CTCAGGCAGGGA-39) residing in the connecting peptide/transmembrane region, coupled with a common b1 forward primer, was used to amplify the b1 domain through the TM region from splenic cDNA. For the PCR polymorphism studies, PFU polymerase (Stratagene, La Jolla, CA) was used to minimize mistakes. OSU and HC parental class I cDNAs (UAA*OSU-01 and *HC-01) were amplified from splenic first strand cDNA using the L1c and a common 39 UTR primer (59-GTGTTATGT TCTTGAGAAGTT-39) in conjunction with PFU. All resulting products (class I and IIB) were cloned into pBlunt (Invitrogen) and sequenced. FIGURE 1. Phylogenetic relationships among the TAP sequences across vertebrate classes. Amino acid sequences were aligned (Clustal W), and the unrooted neighbor-joining tree was constructed using TreeViewPPC. Overall the tree demonstrates higher conservation for TAP1 than for TAP2, which could be related to coevolution of TAP2 alleles with class Ia in each species (45). Accession numbers were as follows for TAP1: human (Q03518), mouse (U60020), rat (P36370), gorilla (L76468), Atantic salmon (Z83327), and shark (AF10835). For TAP2: human (M74447), gorilla (L49034), mouse (M90459), rat (X63854), Xenopus (AF062387), Atlantic salmon (Z83328), and shark (Af108386). Scale bar refers to percentage divergence.
cDNA library screening The production of rainbow trout thymocyte and pronephros ZAP Express cDNA libraries has been previously described (35). Approximately 1 3 106 PFUs from each amplified library were lifted in duplicate onto BA-85S filters (Schleicher & Schuell, Keene, NH) and hybridized under stringent conditions (43 SSC, 1% SDS, 0.5% sodium pyrophosphate, 0.5% nonfat milk, and 10% dextran sulfate at 65°C), using either the putative TAP2, LMP2, or proteasome d PCR probes. Filters were then washed (0.53 SSC/ 0.5% SDS at 65°C) and exposed to x-ray film for 2 days at 280°C. Positive plaques were cored and subjected to in vivo excision with the Exassist helper phage to release pBluescript phagemids containing putative fulllength TAP2, LMP2, and proteasome d cDNAs. For the isolation of trout TAP1A, TAP2B, and the authentic LMP2, new primer sets were synthesized for probe production. A region (180 bp) displaying similarity to both TAP1 and TAP2 in other species was amplified from OnmyTAP2A*01 by PCR (1501–1521 sense, 59-GGAAACTTGCTTTCTACCATG-39; and 1683–1701 antisense, 59-GCTGTCCATCCAACAGCAC-39) and used as a cross-hybridization probe to screen the pronephros library under moderate stringency (56°C). The second set of LMP2 degenerate primers was as follows: LMP2 sense, 59-ACIATHATGGCIGTNGARTT-39, and nested sense, 59-AARAAYATHTCITAYAARTA-39 and antisense 59-GCRTCIA CRAAICCRTADAT-39. The final product after nested PCR (;170 bp) was used to screen the pronephric library for the full-length LMP2. Fulllength class Ia cDNAs (UAA*KD6 and UBA*SP3) were isolated by screening the pronephric cDNA library with an a2 (UAA-HC*01, AF1155519) probe.
blots were washed at a final stringency of 0.53 SSC/0.5% SDS at 65°C. The trout EfTu-I probe has been previously described (36).
SSCP, PCR-RSA, and LR-PCR linkage assays Before SSCP or PCR-RSA analyses, regions of the various loci were amplified from parental gDNA, cloned, and sequenced for detecting polymorphism(s) between the OSU and HC founders. These clones served as reference for SSCP analyses, while also indicating unique restriction sites for PCR-RSA assays. For SSCP analyses, 200 ng of gDNA was amplified with [g-33P]ATP end-labeled loci-specific primers (Table I) in 15 ml of 13 Geneamp buffer (supplemented with 1.5 mM MgCl2, 200 mM dNPTs, 2 pmols end-labeled sense primer, 8 pmols of “cold” sense primer, 10 pmols of “cold” antisense primer, and 0.35 U amplitaq) by PCR using the following profile: 94° for 2 min, followed by 35 cycles of PCR using 94°C for 20 s, 58 – 63°C for 30 s (depending on the primer set), and 72°C for 30 s. Reactions were mixed 1:1 with SSCP loading buffer (95% formamide, xylene cyanol, and bromophenol blue), heated to 90°C for 3 min, and placed on ice. The samples (1 ml) were then loaded onto 8 or 10% acrylamide gels and electrophoresed at 4 W constant power for 3– 4 h at 10°C.
Southern and Northern blot analysis For standard Southern blotting, 15 mg of gDNA was digested overnight with the indicated restriction enzymes, electrophoresed, transferred to nylon, and hybridized with the appropriate radiolabeled probes (Table I) as previously described (35). RNA preparation and Northern blotting were performed as previously described (36). Before tissue excision, fish were bled out to remove residual blood from tissues. All Southern and Northern
Table II. Homology of trout TAP2 residues potentially involved in the permissive and/or restrictive peptide transport phenotypes found in the rat TAP2a and -2b allelesa Residue Position
Human Rat Rat Mouse Trout Trout
2 2a 2b 2 2A 2B
167
168
217
218
262
265
266
352
374
376
380
424
455
464
509
526
527
631
632
T M – – – M p
L F – – F F p
T A – – S A &
M E – – L I &
N Q R R R R &
P S – – A A &
L – F F – – &
V – – – Q A %
A S E D – – %
Y – – – H – %
R Q – – R/K – %
Q – R R K R %
S N K Q E T p
L – V – – – p
K – – – – – $
Q – K – – E p
V L – L – I p
D – – – – – 1
E – – – – – 1
a The alignment (Clustal W) was made to highlight residues putatively involved in peptide contact and transport (adapted from Elliot (40)). Residue positions refer to the human TAP2 sequence. Residues specific for rat TAP2a or b (p), peptide binding and/or viral inhibition (%), ATP binding ($), and 21 Mg cofactor association (1) are indicated below the alignment (40, 46, 47, 50). –, Identity to human sequence.
The Journal of Immunology
777
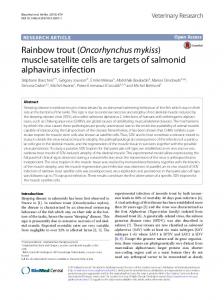
FIGURE 2. Southern blot analysis of trout TAP1A, -2A, and -2B in four individuals. A, The TAP1A probe detects a variety of polymorphic fragments for each enzyme and individual. Arrows indicate bands that overlap with TAP2B. Two to three strong hybridizing bands are evident, suggesting that a second TAP1 locus may be present. B, RFLPs are evident for the TAP2A locus where 1–2 bands per individual are observed, most likely the result of allelic polymorphism. C, The TAP2B-specific probe identifies two basic polymorphic patterns for EcoRI, EcoRV (4,3, and 2-two bands; 1-single band), and HindIII. All probes correspond to exon I of the respective genes, and none of these single domain probes contained internal restriction sites for EcoRI, EcoRV, or HindIII.
DNA fragment conformers were visualized by standard autoradiography. For the class Ia, IIB, and LMP2/d loci, gDNAs were amplified and digested with parental specific restriction enzymes as indicated for PCR-restriction site analysis (RSA). x2 values were determined for the linkage analysis using no linkage between loci as the testing criterion: UAA and DAB 5 2.08 (accept, 15 recombinants, n 5 39); UAA and LMP2 or LMP2/d or TAP2B 5 19 ( p , 0.001, reject, no recombinants, n 5 19); UAA and TAP1 5 10.3 ( p , 0.005, reject, 1 recombinant, n 5 14); UAA and TAP2A 5 0.54 (accept, 17 recombinants, n 5 30); and TAP2A and DAB 5 0.13 (accept, 16 recombinants, n 5 30). LR-PCR was initiated using various combinations of LMP2 and LMP2/d forward and reverse primers on gDNA in conjunction with the Elongase system (Life Technologies). The LMP2 exon 1 reverse 104 –125 (59-GCTCTAATGAT TCATCTAACAT-39) and LMP2/d exon 6 forward 592– 611 (59-CCTG GCTATGGGCAGAGACA-39) primer combination resulted in successful amplification of the intervening region between LMP2-LMP2/d. Products were cloned (pBlunt) and sequenced.
Sequencing, alignments, phylogenies, and modeling cDNA and gDNA clones were sequenced by dideoxy chain termination chemistry using universal and gene-specific infrared primers (MWG-Biotec, Ebersberg, Germany) in conjunction with the Thermo Sequenase kit (Amersham). Sequences were processed via an automated sequencer (LI-COR 4000L; MWG). Database searches, alignments, and phylogenies were conducted as previously described (35). Tree drawing was performed with TreeView (http://evolution.genetics.washington.edu) (37), and bootstrapping was accomplished with PHYLIP V3.572 (http://evolution. genetics.washington.edu) (38). For structural analyses, Swiss PDB (version 3.0 for Power Macintosh) was used to compare putative trout class Ia sequences with the crystal structures of HLA.A28 via the internet server, and models were visualized by RASMOL (R. Sayle; http://expasy. heuge.ch/). Overall, the trout class Ia sequences fold almost identically with the HLA.A28 template, whereas the trout class Ib (31) sequences present a structure with a distorted b sheet floor.
Results and Discussion Analysis of trout TAP2A, TAP2B, and TAP1A cDNAs An alignment of available TAP2 sequences was used to identify regions suited for constructing degenerate primers for the amplification of trout TAP2. By using these primers, a portion (357 bp) of trout TAP2 was amplified by PCR from thymic cDNA. This sequence was most similar (e-131) to other TAP2 sequences. The fragment was then labeled and used as a homologous probe to
screen a trout thymic cDNA library for a full-length cDNA clone. Four clones were selected for restriction analysis and sequencing. One clone, OnmyTAP2A*01 (AF002180), is full-length (3325 bp) including 90 bp of 59 untranslated region (UTR) (single TATA and CAAT motif), 713 aa open reading frame (ORF), and 39 UTR with a polyadenylation signal and tail. Interestingly, exon 1 (135 aa) showed little similarity to the other vertebrate TAP2 sequences (below 20%). By using a portion of TAP2A*01 that shares identity with the Atlantic salmon and mammalian TAP1 and -2 sequences, two additional TAP2 cDNAs and a single form of TAP1 were isolated by cross-hybridization from a pronephros (anterior kidney) cDNA library (one individual). One of the TAP2 clones appears to be the allele of TAP2A*01, for it is 98.5% and 97% identical in its nucleotide and amino acid composition within the coding region and thus will be designated OnmyTAP2A*02 (AF115537). Overall, TAP2A*02 contains an ORF of 713 aa, which displays 39 nucleotide differences in the coding region, in comparison with 2A*01, which resulted in 12 aa replacements including a 6-bp insertion. The 39 UTR for both TAP2A genes was 95% identical, and each possessed a single AG9 microsatellite repeat at the same location. In addition, a second locus for trout TAP2 was found (OnmyTAP2B*01, AF115538), which is most certainly the homologue of the Atlantic salmon SasaTAP2A locus (39). TAP2B*01 (2, 631 bp) consists of 60 bp 59 UTR (TATA motif), 724 aa ORF, and 389 bp of 39 UTR (AG motif not found), including a single polyadenylation site and subsequent tail. TAP2B is 91% identical to the SasaTAP2A sequence whereas OnmyTAP2A was only 60% similar to the Sasa clone. The two putative trout TAP2 loci (A and B) are 61% similar to each other. Overall, TAP2A demonstrates 55% similarity to nonmammalian and 51% to mammalian TAP2 sequences whereas TAP2B shows a higher average similarity (74% and 58%, respectively). Finally, the full-length OnmyTAP1A*01 (AF115536) cDNA clone (2820 bp) includes 134 bp of 59 UTR (2 TATA motifs), 739 aa ORF, and 39 UTR (463 bp) with a single polyadenylation site
778
MHC-RELATED GENES IN TROUT
FIGURE 3. Alignment and phylogenetic analysis of the trout LMP2 and d and of the unique LMP2/d amino acid sequences with other vertebrate LMP2 and d sequences. A, Numbers to the left of the alignment (Clustal W) refer to positions found in the mature sequences. Identity is indicated by dots (z), and gaps used to maximize the alignment are show by dashes (-). Positions specific for LMP2 (@) and d ($) are shown. Accession numbers are as follows for d: human (D29012), mouse (U13393), rat (P28073), Xenopus (D87689), zebrafish (AF032392), and lamprey (D87690). For LMP2: human (U01025), mouse (U22919), rat (P28077), Xenopus (D87687), medaka (D89724), and yeast pre3 (P38624). B, Neighbor joining tree is based upon the LMP2 and d alignment. Node values represent bootstrap percentages (confidence levels) of 1000 replicants. The yeast pre3 sequence serves as the outgroup, and the lamprey d sequence was included since this class does not have an LMP2 homologue (23). The bottom scale refers to percentage divergence.
just before the poly(A) tail. OnmyTAP1A*01 is most similar (e159) to other TAP1 sequences (55% average similarity to mammalian and 82% to nonmammalian). The strongest homology was to Sasa-TAP1A, which is identical in length (ORF) and shares a striking 97% amino acid identity for the coding region. In addition, all trout TAP loci have at least 8 –10 predicted ER membranespanning domains and a conserved ATP binding region, as well as the highly conserved Walker A and B sites, all of which are consistent with mammalian TAP molecules (40). A phylogenetic analysis using full-length amino acid sequences was used to then display the relationships of the TAP sequences among various vertebrate classes. TAP1 and TAP2 sequences group into distinct branches for the mammalian and nonmammalian classes, where each clusters into its own clad (Fig. 1). Overall, the tree is consistent with the expected radiations of these various classes, and the fact that trout TAP2A branches away from the other teleost
TAP2 sequences may reflect its possible non-MHC-linked status (see linkage). Comparison of permissive and restrictive residues in vertebrate TAP2s In mammals, a functional TAP (TAP1 and -2) heterodimer is essential for efficient class Ia peptide presentation to cytotoxic CD81 T cells (40 – 42). TAPs generally transport short peptides (8 –11 mers) from the cytosol to the ER lumen for loading onto recently assembled class I molecules, but recent observations demonstrate that some TAP alleles have the ability to transport large peptides (43, 44). Additionally, functional polymorphism has been described for the two rat TAP2 alleles, a and b, which results in permissive or restricted peptide transport (45). The two alleles differ by 25 aa, and some of these residues (217, 218, 262, 265, and 266), which are thought to interact with peptide in the cytoplasm,
The Journal of Immunology
779
FIGURE 4. Trout LMP2 and LMP2/d show RFLPs. Probes (62% identity to each other) spanning exons 2– 6 for LMP2 (A) and LMP2/d (B) were used for Southern blot analysis of four nonclonal individuals. Arrows indicate fragments that overlap between the two blots.
are directly involved in the two TAP functional phenotypes (46, 47). In the permissive situation (rat 2a and human), a broad range of peptides can be efficiently transported and loaded, which can satisfy the fundamental peptide requirements of most class I molecules. On the opposite side, restrictive TAP alleles (rat 2b and mouse) preferentially resist the transport and loading of peptides carrying a polar or charged C-terminal anchor (i.e., R). In rats, TAP2a and -b are linked specifically to the two different class I H chain groups (RT1-A) such that TAP2b can fulfill the needs of RT1-A molecules possessing a minimally charged F pocket (19), thus suggesting coevolution of specific TAP2s with certain types of class I H chains. In one study, mutation of human TAP2 position 374 (A to D) resulted in a switch from permissive to restrictive transport (48). We then aligned TAP2 sequences from rat (a/b), human, mice, and the two trout loci (2A and 2B) to highlight those residues thought to be involved in the two phenotypic classes (Table II). Each of the trout genes contain residues (e.g., 217, 218, 262, 265, 266, 374, and 376) found at positions implicated in the permissive and restrictive mammalian alleles, suggesting that trout are most likely not restricted in peptide transport and loading, although functional studies are needed to validate this assumption. Interestingly, the putative TAP2A alleles (*01/ *02) show 7 of the 12 coding polymorphisms between the predicted 6th-7th and 8th-9th transmembrane domains and within the ATP-binding region, all of which are predicted to reside in the cytoplasm. The functional significance of these polymorphic residues is currently being addressed. Identification of trout TAP RFLPs We next conducted Southern blot analysis on four individuals using the first exon of each gene to estimate the copy number and to identify potential RFLPs. As shown in Fig. 2A, all enzymes gave different polymorphic patterns for all individuals using a TAP1 probe. In most cases, three bands were detected, suggesting the presence of an alternative allelic form of TAP1. Nonidentical banding patterns for TAP2A and TAP2B (Fig. 2, B and C) support
the notion that these are indeed distinct loci and that each individual contains both loci as well as possible alleles. A rough estimation of the genomic organization for TAP2A*01 was then obtained by using a set of primers based at the beginning of exon 1 and within exon 3, in conjunction with PCR using gDNA. A single product was amplified, sequenced, and compared with the cDNA clone TAP2A*01 to determine the exon-intron boundaries (data not shown). Both intron positions and splice categories for the first (183 bp, type I) and second (151 bp, type II) intron exist in TAP2A, as is found in mammals and the recently reported Atlantic salmon (Sasa) TAP2 gene (39). Using the same primer combination, we isolated this unique TAP2A region and confirmed the exon-intron structure in two other salmonids, the Chinook and Coho salmon. These two species, which diverged from trout 10 –20 million years ago, possessed the unique TAP2A exon (data not shown, 95% identity) and shared the same genomic structure of trout, thus demonstrating its presence in other salmonids. In summary, as in rats and Atlantic salmon, there are polymorphic alleles and loci (salmon) for TAP2 (39, 49). Secondly, a unique form of TAP2 (TAP2A) was found, in which the first exon is quite different (20% similarity) from that of all other reports describing TAP2 sequences, suggestive of a separate ancient lineage. Considering possible allelic variants at all trout TAP loci (heterozygosity), a total of eight different heterodimers could be formed, which no doubt would influence the peptide repertoire selected for efficient transport and subsequent loading onto recently synthesized class I molecules. Moreover, possession of a variety of TAP alleles and loci, as in trout and Atlantic salmon (39), may be beneficial for disease resistance to certain viral pathogens in which TAP function can be specifically inhibited by virally encoded molecules, as found in mammalian studies (50 –52). Characterization of LMP2, LMP2/d, and d in trout Degenerate PCR primers, designed using available LMP2 and d sequences (human, mouse, rat, and Xenopus), were used to amplify segments from pronephric and thymic first strand cDNAs. A single
780
MHC-RELATED GENES IN TROUT
FIGURE 5. Class I sequences from trout. A, A broad range of putative trout class I sequences are polymorphic and display clusters of substitutions. b sheets (b), turns (T), loops (L), and a helices (a) were based upon molecular modeling. Positions putatively involved in N- and C-termini peptide binding for the A and F class Ia pockets are indicated (N or C) above the alignments. B, Predicted amino acid sequences of four putative class Ia genes from trout aligned with the trout class Ib (Onmy-UAA*OK-1b, L63542) and human (HLA-A.28, P01891) class Ia sequences. Dots (z) represent identical residues, and dashes (-) define gaps. Residues believed to form salt bridges (p), bind peptides (#), b2m contact sites (&), or possible CD8 contact sites ( 5 ) are indicated.
The Journal of Immunology
Figure 5 continued Additionally, critical structural residues ($), the Nlinked glycosylation site (CHO) and putative phosphorylation sites (P) are marked. Numbers above the alignment refer to UAA*HC-01 residues, and exon boundaries (T182/V183, exons 3– 4; P276/D277, exons 4 –5; K311/G312, exons 5– 6; and S317/T318, exons 6 –7) were based upon the genomic sequence of UAA*HC-01 (AF115520). C, Southern blot analysis of class I as detected by a3 RFLPs. An a3 (UAA*KD6) domain-specific probe was used to demonstrate the presense of multiple polymorphic class I loci in individual trout. Circles and diamonds (solid/strong and open/moderateweak signals) refer to fragments that also hybridize with UAA*KD1.5 (AF115523) and UCA*KD2.11 (AF115524) a1a2 probes (62% identity to each other), respectively. Both of these probes hybridized with other sites on the blot.
product of ;460 bp was amplified, cloned, and sequenced. Two distinct sequences emerged from this screening, which displayed 64% identity to each other. Surprisingly, both sequences were most similar to proteasome d (e-65), followed closely by LMP2 (e-53) cDNA sequences. The two fragments were then used as homologous probes to screen a trout thymocyte cDNA library. Upon restriction analysis of the phagemids, two clones were chosen for further sequence analysis. One, Onmy-d (819 bp, AF115539), begins with a 671-bp ORF and 145 bp of 39 UTR, including three polyadenylation sites and a poly(A) tail. This clone might not be full-length, though, for, if the first methionine is legitimate, there would be only a short 12-aa leader segment, followed by the mature d sequence after proteolytic cleavage of the leader. The second clone, Onmy-LMP2/d (AF115540), was a bit more difficult to classify as LMP2 or d, for it contains residues specific for both. In addition, it contains a unique tyrosine insertion at position 26 within the putative mature protein, which is not found in either LMP2 or d. A motif recognition program failed to identify the LMP2/d gene as a member of the B proteasome family, but, when the extra tyrosine is removed, the motif is restored. This clone is full-length (1039 bp total), for the ORF begins with a single methionine initiation codon, which is flanked 59 by 58 bp containing stop codons in all three reading frames. It encodes 216 aa, followed by two consecutive stop codons and 327 bp of 39 UTR, including an alternative polyadenylation site (agtaaa) and poly(A) tail. Finally, the coding region of LMP2/d is polymorphic, for an allelic variant was found that was 94% identical to LMP2/d (data not shown).
781
FIGURE 6. Northern blot analysis of trout Ag processing and presentation genes. Gene-specific probes for class I domains (UAA*KD6 a1, a2, and a3), TAP1 (exon 1), LMP2 (exons 2–5), LMP2/d (exons 2–5), DAB (b2), and proteasome d (exons 2–5) were hybridized with blots containing ;15 mg of total RNA (three pooled individuals) from indicated tissues: Ts, testis; Br, brain; m, muscle; Hr, heart; In, intestine; Lv, liver; Sp, spleen; Mn, mesonephros; Pn, pronephros; and Th, thymus. EfTu-1 probes demonstrated relative equivalency in loading (data not shown).
Since the trout LMP2/d gene appeared to be a distant member of the LMP2 or d lineages, we constructed new sets of degenerate primers specific for LMP2. A single product of the expected size (;170 bp) was obtained from thymic cDNA, which contained two sequences differing by only 8 noncoding bp. The fragment is most similar (e-220) to the two teleost (medaka and zebrafish, partial) LMP2 sequences, followed by other vertebrate LMP2 genes. This fragment was then used to screen a thymic cDNA library yielding the full-length form of LMP2 from trout. OnmyLMP2 (1090 bp, AF115541) contains a 654-bp ORF ending in a stop codon followed by 333 bp of 39 UTR, with a single polyadenylation site and tail. Overall, the three trout-coding regions (LMP2, 2/d, and d) share ;61% nucleotide and 64% amino acid identity with each other. The 39 UTRs show little similarity among the three genes. A high degree of conservation can be observed among vertebrate LMP2 and d, including absolute conservation of 62 residues, which increases to 71 if the LMP2/d sequence is not included (Fig. 3A). Overall, about 16 residues are specific for either LMP2 and/or d sequences. Interestingly, the LMP2/d sequence appears to be at a crossroads (Fig. 3B) between LMP2 and d, for it contains roughly an equivalent number of LMP2, d, and unique residues. Southern blot analysis of LMP2 and LMP2/d using probes spanning exons 2–5 (63% identity to each other) revealed a variety of polymorphic bands within the four individuals (Fig. 4). Additionally, several overlapping bands are found for the two genes among the different digests, suggesting a close physical linkage between LMP2 and LMP2/d. Finally, Southern blot analysis using single domain probes (exon 6 to 39 UTR) suggests the presence of additional loci (data not shown).
782
MHC-RELATED GENES IN TROUT
Analysis of trout class I H chain lineages Previously we characterized a trout class I H chain gene that by polymorphism, expression, and presence of specific residues appeared to encode an authentic class Ia allele (30). In an effort to identify other polymorphic alleles and to characterize the different class I loci, we used conserved trout class I primers for the isolation of new class I cDNA products. All class I cDNA clones have been classified according to convention, where Onmy defines the genus (Oncorhynchus) and species (mykiss), UAA (or UBA or UCA) defines class I H chains, and “*XX” (e.g., *KD6) refers to the clone itself (53). The tentative class I designations (e.g., UAA) refer to sequence lineages and not to whether these sequences are strictly classical or nonclassical in nature. UBA and UCA class I lineages are based upon the presence of specific features, including a unique leader (UBA), a distinct a2 domain (UCA), which is shared with cyprinid fish (30), or further differences found within the connecting peptide (e.g., UCA insertion) and cytoplasmic domains (e.g., UBA truncation). Overall, 12 different polymorphic class I sequences were obtained from two isogenic lines and four other individuals. To simplify matters, we present an alignment that represents the variety of genes with unique polymorphic a1 and -2 domains (Fig. 5A). Unique deletions, insertions, clusters of replacements, and invariant residues are scattered among the b sheets, turns/loops, and a helices. Thus, in contrast to most vertebrate class I genes where variation is typically limited to peptide-binding domains, the sequences presented here demonstrate variability within both structural and peptide-binding domains. Some of these sequences differ by as much as 50% within an individual for the a1 and -2 domains (e.g. UAA*KD1.5 (AF115523)/UBA*Spu3.1 (AF115526)). In addition, some deletions correspond to regions implicated in peptide binding; thus, these particular alleles may represent lineages similar to the nonclassical genes of mammals. How many class I genes are actually expressed within an individual? We assessed this important question initially by using the two different leader sequences found in UCA*KD2.11 (AF115524) and UBA*Spu3.1 (AF115526) as forward primers in conjunction with a conserved a3 reverse primer. Examination of four individuals for class I expression in the spleen and pronephros by RT-PCR indicates that all individuals express at least two different class I loci per individual, as indicated by the presence of three different sequences. It should be noted that all trout share a common tetraploid ancestor and that multivalents can be observed during meiosis (34, 54); thus, in situ hybridization is needed to clarify whether these different sequences are actually all alleles at a common locus or whether they belong to distinct loci. Three different full-length class I genes were then isolated from the pronephros library (one individual), including the previously identified UAA*C32 allele (now termed UCA*C32) and two different genes designated Onmy-UAA*KD6 (AF115521) (similar to UAA*HC-01 (AF115519)) and Onmy-UBA*SP3 (AF115522). Overall, all trout class I cDNAs (including Fig. 5A, but not UAA*OK-1b (31)) have retained residues (UAA*HC-01 numbering Y-7, Y-59, R-84, F-122, T-142, K-145, W-146, and Y-159) believed to be crucial for N- and C-termini peptide contact in class Ia molecules (27), as well as sites involved in salt bridge formations (H-3, D-28, H-92, and D-118) (Fig. 5B), the exception being UCA*C32, where the highly conserved W-146 is encoded by a L. In mammals, position 84 typically encodes a Y residue, but, in all nonmammalian class Ia H chains, an R is found instead. Positions 84, 142, and 146 are thought to form a hydrogen-bonding meshwork for enhanced binding of the C-terminal end of the peptide in mammals (27). The W to L substitution in C32 would probably not
FIGURE 7. Linkage analysis of the trout MHC. A, Cosegregation analysis of trout class Ia (UAA*OSU/HC-01), DAB, LMP2, LMP2/d, and the two TAP2 loci, A and B, were conducted using SSCP and PCR-RSA (OSU LMP2/d-specific HinfI site) on parental strain (OSU-O and Hot Creek-H) and F1 gDNA. B, Cosegregation analysis of TAP1, UAA*OSU/HC-01, and DAB. Parental strain (H and O) and F1 gDNA were digested with BamHI and hybridized with a TAP1 probe corresponding to exon 1 and 2 (bands ;13 kbp). UAA (OSU a1-specific KpnI site) and DAB (HC b2 AatIIspecific site) were typed by PCR-RSA.
alter this scheme since both possess nonpolar side chains. In addition, some residues (12/17) putatively involved in b2m contact in mammals are conserved in trout. These differences could reflect the fact that trout encode two classes of b2m per individual (31), which may have varying specificity for different trout H chains. An exposed loop containing a small stretch of acidic residues within the a3 domain of mammals facilitates binding with coreceptor
The Journal of Immunology
783
FIGURE 8. Schematic representation of the trout MHC genomic architecture. Methods for mapping are indicated. Distance between LMP2 and class Ia (approximately 285 kbp) was determined by PFGE (J. D. Hansen, P. Strassburger, and L. Du Pasquier, manuscript in preparation).
CD8, found on cytotoxic T cells (55). Within the alignment, three acidic residues (220-D/E, D-224, and E-226) within this region are well conserved from trout to man. Interestingly, the conserved D-224 is also thought to play a role in the association of the class Ia H chain with TAP and calreticulin (the conserved a1 N-linked glycosylation (CHO) site needed for the latter) (56). Finally, phosphorylation sites S-323 and S-326 are conserved (57). Overall, looking at the variety of polymorphic sequences there are roughly four to five groups for the a1 domain, four groups for the a2 domain, two different a3 groups (four sequences), and two to three unique connecting peptide/transmembrane/cytoplasmic domain groups, suggesting that a wide range of allelic combinations is possible. Recently, the evolutionary relationships of fish class I H chains have been reviewed, which suggests that the sequences presented within this study were likely derived from two distinct ancestral lineages (58, 59). It should also be noted that particular a1 domains are not restricted to specific a2 domains (Fig. 5A); thus, a broad repertoire of peptide-binding pockets is present in trout. To follow up further on the trout class I-associated polymorphisms, Southern blot analysis was performed. A UAA*KD6 a3 probe detects seven to eight bands on a typical Southern blot (Fig. 5C), supporting the presence of multiple class I loci. Most of these bands also cohybridize with a1 and -2 probes derived from two of these individuals, corresponding probably to other authentic class I loci. In addition, PFGE analysis suggests the presence of independent class I loci not linked to the main class I region (UAA*OSU-01/HC-01, see linkage) (J. D. Hansen, P. Strassburger, and L. Du Pasquier, manuscript in preparation). The differences observed among our trout class I cDNA sequences are similar to those found for the shark class I genes and other fish models. It has been postulated that gene conversion might be responsible for the small clusters of substitutions observed within the a1 and -2 domains. Our data tend to support that a similar situation occurs in salmonids. Reciprocal or nonreciprocal recombination mechanisms leading to these mosaic combinations would be a common way for diversifying the peptide-binding repertoire found in fish, as in other vertebrates (60 – 65). Tissue-specific mRNA expression Little is known regarding the expression of MHC-related genes in teleost fish. We previously demonstrated that the class I UAA*C32 gene is expressed in a ubiquitous manner similar to class Ia genes (30) in higher vertebrates. Northern blot and RT-PCR analyses were conducted on a variety of trout tissues using domain-specific probes and primers (Fig. 6). An a1 domain shared by several class I genes, including UAA*C32, -*KD6, -*HC-01, and -*OSU-01, is expressed in most tissues, with highest levels in the intestine followed by the other major lymphoid tissues, with weak expression in the muscle and liver. In this species, the thymus, kidney (pronephros), and possibly the spleen are the primary lymphoid tissues (36). Using this probe, two messages most likely corresponding to genes such as UAA*C32 and UAA*KD6 were detected, where the full length transcripts differ by ;500 bp. Since the UBA*SP3 aI
domain possesses both a unique leader and a 5-aa deletion corresponding to a peptide-binding site (Y-59), we examined its expression as well. Overall, individuals encoding this allele express it in a manner similar to UAA*KD6 and UCA*C32 (data not shown), suggesting that it is most likely a classical transcript. In the class I alignments (Fig. 5, A and B), three to four distinct a2 lineages are evident; we selected the a2 domain found in UAA*KD6 (UAA*HC-01 type) as an a2 probe since it was associated with a variety of a1 domains. Expression was strongest in the spleen, kidney, and thymus, followed by the intestine. Overall, UAA*KD6, UBA*SP3, and UCA*C32 are expressed in a parallel manner with trout b2m (31). TAP1A is expressed in all tissues, with highest levels in the spleen, kidney, thymus, intestine, heart, and testis. Surprisingly, a truncated message is apparent in the liver, which could be due to an alternative polyadenylation site, although none are present in TAP1A*01. Northern blot and RT-PCR analyses of TAP2A and -B demonstrate that TAP2B is expressed in all tissues at much higher levels than TAP2A (data not shown). We next examined the expression of the three proteasome-related loci: LMP2, LMP2/d, and d. Both LMP2 and LMP2/d are expressed in a nearly identical fashion, with highest expression in the trout lymphoid tissues, similar to the class I alleles, which is consistent with LMP expression in other model systems. As expected, d is expressed in a ubiquitous manner (although high in the testis, like TAP), agreeing with its general role as a housekeeping proteasome gene. Finally, we show that the trout class IIB genes are mainly expressed in lymphoid tissue, with highest expression in the spleen and intestine, followed by the thymus and kidney. The different transcripts most likely correspond to DAB alleles possessing long and short 39 UTRs (32). Looking at the expression patterns of UAA*KD6, UBA*SP3, and UCA*C32 (30), coupled with the presence of specific residues and polymorphic variants of each, these three genes appear to meet the general criteria of classical class I molecules. As a whole, members of the class I pathway (UAA, TAP, and LMP) and DAB are expressed in a similar manner, basically being limited to the major teleost lymphoid tissues, consistent with their biological roles. Linkage analysis of the trout MHC We employed several methods of linkage analysis to obtain an initial representation of the MHC architecture in trout. In the previous section, we outlined that trout possess a vast array of class I loci and alleles. We therefore used the major class Ia splenic transcripts (UAA*OSU-01 and -*HC-01, 91% nt coding region identity) of the OSU and HC parental strains (diploid, isogenic (33, 34)) as the class I reference makers for our segregation study. As a starting point, we analyzed the linkage of the class I (UAA) and IIB (DAB) loci using both SSCP and PCR-RSA cosegregation analysis from F1 gDNAs that were generated by a backcross (OSU female 3 OSU/HC male hybrid). As shown in Fig. 7A, cosegregation of Onmy-UAA*OSU/HC-01 and Onmy-DAB was not
784 found by using either SSCP or PCR-RSA analyses (.37% recombinants, n 5 39). As a control, Onmy-DAB b1 and b2 domains cosegregated for every individual as expected. We have not determined whether UAA*OSU-01 and -HC-01 compose a single locus (i.e., allelic partners in heterozygotes) or whether they represent distinct loci, which is a possibility. We were then able to demonstrate that LMP2 and LMP2/d do cosegregate with the class I region (Fig. 7A). Coupled with the observation of overlapping RFLPs (Fig. 4), it was quite possible that LMP2 and LMP2/d were physically linked to one another in relation to the class Ia region and that LMP2/d or LMP2 arose via a gene duplication event. Using LR-PCR, we determined that LMP2/d and LMP2 are ;1.5 kbp apart in the same transcriptional orientation, suggestive of an ancient, tandem duplication event. We then determined that TAP2B (Fig. 7A) is linked to the class Ia region and that TAP1A (Fig. 7B) is also part of this region. Interestingly, TAP2A is not closely linked to the class I region nor is Bf2 (J. O. Sunyer, J. D. Hansen., and J. D. Lambris, unpublished observations), a putative representative of the trout class III region (66). From linkage data alone, class I (UAA*OSU/HC-01), TAP2A (.50% recombinants to both UAA and DAB), and DAB could all be possibly located on different linkage groups. Finally, d is not linked to the class I or II regions, as determined by segregation (data not shown). A summary of the linkage analysis is shown in Fig. 8. From amphibians through mammals, the class I, II, and III regions are physically linked, forming the MHC proper. In mammals, the LMP and TAP loci are within the class II region (17) whereas, in Xenopus, analysis of F1 recombinants suggest that these genes are situated in closer proximity to the single class Ia locus than to class II (67). Recently, MHC mapping studies in the teleost Danio rerio (zebrafish) demonstrated that the zebrafish class I and II regions mapped to different linkage groups (24) and possibly to different chromosomes, although formal proof (in situ hybridization) of the latter has yet to be demonstrated. In addition, the zebrafish LMP2/7 and TAP2 genes were found to be linked to the class I region, in contrast to that which is found in mammals (68, 69). In medaka, LMP2 and -7 are closely linked, but not to Bf2, a class III member (70, 71). Combining the zebrafish, medaka, and, now, trout data, it appears that the LMP2/7 and TAP1/2 complex has been maintained as a linkage entity for more than 350 million years. Thus, there must be a selective advantage for expression and coevolution as a unit where the whole locus may be more transcriptionally active following induction (i.e., IFNs) during an infectious response (44). The close proximity of genes involved in the class I processing is conserved in teleost fish, anuran amphibians, and perhaps birds (23, 67, 68, 72–74). It makes better sense that components of the class I pathway segregate and coevolve as a physical unit, as is found in teleosts, Xenopus, and birds. This observation makes the mammalian gene organization look like an accident. Recently, we determined that the trout class I region is rather compact, since LMP2 and class I genes were found on a common 285 BssHII PFGE genomic fragment (J. D. Hansen, P. Strassburger, and L. Du Pasquier, manuscript in preparation). Thus, it appears that linkage of class I, LMP, and TAP was established before the divergence of teleosts from the later vertebrates. It will thus be very interesting to examine the degree of MHC linkage within the elasmobranchs since recently the class Ia, IIB, and IIA and TAP genes have all been identified (62– 64, 75, 76). Noteworthy is that the trout TAP2A locus is expressed at lower levels than TAP2B, which may be related in some way to the fact that it is not linked to either UAA or DAB. We have not determined whether this locus is part of a paralogous MHC region, as found in mammals (77). In Xe-
MHC-RELATED GENES IN TROUT nopus, one TAP2 gene is linked to the MHC, but a second nonlinked cross-hybridizing band was observed, suggesting that this species, like trout, may also possess a non-MHC-linked TAP (72). Fine mapping studies are underway to determine the exact linkage order and distances of the LMP and TAP loci to see whether this may answer evolutionary questions (78) regarding the duplication and subsequent inversion events of TAP and LMP, resulting in the mammalian LMP2/TAP1/LMP7/TAP2 arrangement, with LMP2 in opposite transcriptional orientation to the other three genes. In conclusion we have described several new immunologically relevant loci for the rainbow trout model, comprising new class I and IIB, TAP, and LMP2 cDNA and genomic clones. We have evaluated the overall polymorphism, expression, and linkage of these various genes including the following: a) two distinct polymorphic TAP2 loci are present in trout and one is linked (2B) and one is not linked (2A) to the class I region; b) a new LMP2-like gene suggests that an ancient duplication event from an ancestor with LMP2 and d characteristics gave rise to the modern LMP2 gene over 350 million years ago; c) trout possess a variety of putative class Ia alleles that differ in both structural and peptideassociated regions (including naturally selected positions); d) both class I pathway members and class IIB are expressed at highest levels within lymphoid tissues; and e) the linkage of LMP2/7, TAP1/2, and class Ia was assembled before the emergence of teleost fish. Hopefully, this investigation will serve as a foundation for future research looking at both the evolution of the MHC and the use of these loci as genetic markers associated with disease resistance in salmonid fish. Note added in proof. It came to our attention that two other teleosts display a lack of linkage between class I and IIb loci (79, 80)
Acknowledgments We thank Jean Pieters and Marco Colonna for their critical reviews of this manuscript.
References 1. Rammensee, H. G., K. Falk, and O. Rotzschke. 1993. Peptides naturally presented by MHC class I molecules. Annu. Rev. Immunol. 11:213. 2. Pieters, J. 1997. MHC class II restricted antigen presentation. Curr. Opin. Immunol. 9:89. 3. Klein, J., and C. O’Huigin. 1994. The conundrum of non-classical major histocompatibility complex genes. Proc. Natl. Acad. Sci. USA 91:6251. 4. Parham, P. 1994. The rise and fall of great class I genes. Semin. Immunol. 6:373. 5. Vance, R. E., J. R. Kraft, J. D. Altman, P. E. Jensen, and D. H. Raulet. 1998. Mouse CD94/NKG2A is a natural killer cell receptor for the nonclassical major histocompatibility complex (MHC) class I molecule Qa-1(b). J. Exp. Med. 188: 1841. 6. Braud, V. M., D. S. Allan, C. A. O’Callaghan, K. Soderstrom, A. D’Andrea, G. S. Ogg, S. Lazetic, N. T. Young, J. I. Bell, J. H. Phillips, L. L. Lanier, and A. J. McMichael. 1998. HLA-E binds to natural killer cell receptors CD94/ NKG2A, B and C. Nature 391:795. 7. Coux, O., K. Tanaka, and A. L. Goldberg. 1996. Structure and functions of the 20S and 26S proteasomes. Annu. Rev. Biochem. 65:801. 8. Monaco, J. J., and D. Nandi. 1995. The genetics of proteasomes and antigen processing. Ann. Rev. Genet. 29:729. 9. Hisamatsu, H., N. Shimbara, Y. Saito, P. Kristensen, K. B. Hendil, T. Fujiwara, E. Takahashi, N. Tanahashi, T. Tamura, A. Ichihara, and K. Tanaka. 1996. Newly identified pair of proteasomal subunits regulated reciprocally by interferon g. J. Exp. Med. 183:1807. 10. Kandil, E., K. Kohda, T. Ishibashi, K. Tanaka, and M. Kasahara. 1997. PA28 subunits of the mouse proteasome: primary structures and chromosomal localization of the genes. Immunogenetics 46:337. 11. Nandi, D., H. Jiang, and J. J. Monaco. 1996. Identification of MECL-1 (LMP-10) as the third IFN-g-inducible proteasome subunit. J. Immunol. 156:2361. 12. Groettrup, M., R. Kraft, S. Kostka, S. Standera, R. Stohwasser, and P. M. Kloetzel. 1996. A third interferon-g-induced subunit exchange in the 20S proteasome. Eur. J. Immunol. 26:863. 13. Boes, B., H. Hengel, T. Ruppert, G. Multhaup, U. H. Koszinowski, and P. M. Kloetzel. 1994. Interferon g stimulation modulates the proteolytic activity and cleavage site preference of 20S mouse proteasomes. J. Exp. Med. 179:901.
The Journal of Immunology 14. Kuckelkorn, U., S. Frentzel, R. Kraft, S. Kostka, M. Groettrup, and P. M. Kloetzel. 1995. Incorporation of major histocompatibility complex– encoded subunits LMP2 and LMP7 changes the quality of the 20S proteasome polypeptide processing products independent of interferon-gamma. Eur. J. Immunol. 25:2605. 15. Deverson, E. V., I. R. Gow, W. J. Coadwell, J. J. Monaco, G. W. Butcher, and J. C. Howard. 1990. MHC class II region encoding proteins related to the multidrug resistance family of transmembrane transporters. Nature 348:738. 16. Bahram, S., D. Arnold, M. Bresnahan, J. L. Strominger, and T. Spies. 1991. Two putative subunits of a peptide pump encoded in the human major histocompatibility complex class II region. Proc. Natl. Acad. Sci. USA 88:10094. 17. Beck, S., A. Kelly, E. Radley, F. Khurshid, R. P. Alderton, and J. Trowsdale. 1992. DNA sequence analysis of 66 kb of the human MHC class II region encoding a cluster of genes for antigen processing. J. Mol. Biol. 228:433. 18. Sadasivan, B., P. J. Lehner, B. Ortmann, T. Spies, and P. Cresswell. 1996. Roles for calreticulin and a novel glycoprotein, tapasin, in the interaction of MHC class I molecules with TAP. Immunity 5:103. 19. Joly, A. L., A. L. Le Rolle, A. L. Gonzalez, W. J. Mehling, W. J. Stevens, W. J. Coadwell, J. C. Hunig, J. C. Howard, and G. W. Butcher. 1998. Coevolution of rat TAP transporters and MHC class I RT1-A molecules. Curr. Biol. 8:169. 20. Monaco, J. J. 1992. A molecular model of MHC class-I-restricted antigen processing. Immunol. Today 13:173. 21. Klein, J. 1986. Natural History of the Major Histocompatibility Complex. WileyInterscience, New York, NY. 22. Kaufman, J., H. Volk, and H. J. Wallny. 1995. A “minimal essential Mhc” and an “unrecognized Mhc”: two extremes in selection for polymorphism. Immunol. Rev. 143:63. 23. Nonaka, M., C. Namikawa-Yamada, M. Sasaki, L. Salter-Cid, and M. F. Flajnik. 1997. Evolution of proteasome subunits delta and LMP2: complementary DNA cloning and linkage analysis with MHC in lower vertebrates. J. Immunol. 159: 734. 24. Bingulac-Popovic, J., F. Figueroa, A. Sato, W. S. Talbot, S. L. Johnson, M. Gates, J. H. Postlethwait, and J. Klein. 1997. Mapping of mhc class I and class II regions to different linkage groups in the zebrafish, Danio rerio. Immunogenetics 46:129. 25. Carroll, R. L. 1988. Vertebrate Paleontology and Evolution. Freeman, New York. 26. Vallejo, A. N., N. W. Miller, and W. L. Clem. 1992. Antigen processing and presentation in teleost immune response. Ann. Rev. Fish Dis. 73:605. 27. Du Pasquier, L., and M. Flajnik. 1998. Origin and evolution of the immune system. In Fundamental Immunology. W. E. Paul, ed. Lippincott-Raven, Philadelphia, p. 605. 28. Partula, S., A. de Guerra, J. S. Fellah, and J. Charlemagne. 1995. Structure and diversity of the T cell antigen receptor b-chain in a teleost fish. J. Immunol. 155:699. 29. Partula, S., A. de Guerra, J. S. Fellah, and J. Charlemagne. 1996. Structure and diversity of the TCR a-chain in a teleost fish. J. Immunol. 157:207. 30. Hansen, J. D., P. Strassburger, and L. Du Pasquier. 1996. Conservation of an a 2 domain within the teleostean world, MHC class I from the rainbow trout Oncorhynchus mykiss. Dev. Comp. Immunol. 20:417. 31. Shum, B. P., K. Azumi, S. Zhang, S. R. Kehrer, R. L. Raison, H. W. Detrich, and P. Parham. 1996. Unexpected b2-microglobulin sequence diversity in individual rainbow trout. Proc. Natl. Acad. Sci. USA 93:2779. 32. Glamann, J. 1995. Complete coding sequence of rainbow trout Mhc II b chain. Scand. J. Immunol. 41:365. 33. Young, W. P., P. A. Wheeler, R. D. Fields, and G. H. Thorgaard. 1996. DNA fingerprinting confirms isogenicity of androgenetically derived rainbow trout lines. J. Hered. 87:77. 34. Young, W. P., P. A. Wheeler, V. H. Coryell, P. Keim, and G. H. Thorgaard. 1998. A detailed linkage map of rainbow trout produced using doubled haploids. Genetics 148:839. 35. Hansen, J. D., P. Strassburger, and L. Du Pasquier. 1997. Conservation of a master hematopoietic switch gene during vertebrate evolution: isolation and characterization of Ikaros from teleost and amphibian species. Eur. J. Immunol. 27: 3049. 36. Hansen, J. D. 1997. Characterization of rainbow trout terminal deoxynucleotidyl transferase structure and expression: TdT and RAG1 co-expression define the trout primary lymphoid tissues. Immunogenetics 46:367. 37. Page, R. D. 1996. TreeView: an application to display phylogenetic trees on personal computers. Comput. Appl. Biosci. 12:357. 38. Felsentstein, J. 1993. PHYLIP (Phylogeny Inference Package)[computer program]. Version 3.5c. Seattle, Washington, Department of Genetics, University of Washington. 39. Grimholt, U. 1997. Transport-associated proteins in Atlantic salmon (Salmo salar). Immunogenetics 46:213. 40. Elliott, T. 1997. Transporter associated with antigen processing. Adv. Immunol. 65:47. 41. Spies, T., and R. DeMars. 1991. Restored expression of major histocompatibility class I molecules by gene transfer of a putative peptide transporter. Nature 351: 323. 42. Powis, S. J., A. R. Townsend, E. V. Deverson, J. Bastin, G. W. Butcher, and J. C. Howard. 1991. Restoration of antigen presentation to the mutant cell line RMA-S by an MHC-linked transporter. Nature 354:528. 43. Stevens, J., K. H. Wiesmuller, P. Walden, and E. Joly. 1998. Peptide length preferences for rat and mouse MHC class I molecules using random peptide libraries. Eur. J. Immunol. 28:1272.
785 44. Nandi, D., K. Marusina, and J. J. Monaco. 1998. How do endogenous proteins become peptides and reach the endoplasmic reticulum? Curr. Top. Microbiol. Immunol. 232:15. 45. Joly, E., and G. W. Butcher. 1998. Why are there two rat TAPs? Immunol. Today 19:580 . 46. Momburg, F., E. A. Armandola, M. Post, and G. J. Hammerling. 1996. Residues in TAP2 peptide transporters controlling substrate specificity. J. Immunol. 156: 1756. 47. Deverson, E. V., L. Leong, A. Seelig, W. J. Coadwell, E. M. Tredgett, G. W. Butcher, and J. C. Howard. 1998. Functional analysis by site-directed mutagenesis of the complex polymorphism in rat transporter associated with antigen processing. J. Immunol. 160:2767. 48. Armandola, E. A., F. Momburg, M. Nijenhuis, N. Bulbuc, K. Fruh, and G. J. Hammerling. 1996. A point mutation in the human transporter associated with antigen processing (TAP2) alters the peptide transport specificity. Eur. J. Immunol. 26:1748. 49. Joly, E., E. V. Deverson, J. W. Coadwell, E. Gunther, J. C. Howard, and G. W. Butcher. 1994. The distribution of Tap2 alleles among laboratory rat RT1 haplotypes. Immunogenetics 40:45. 50. Tomazin, R., A. B. Hill, P. Jugovic, I. York, P. van Endert, H. L. Ploegh, D. W. Andrews, and D. C. Johnson. 1996. Stable binding of the herpes simplex virus ICP47 protein to the peptide binding site of TAP. Embo J. 15:3256. 51. Hengel, H., J. O. Koopmann, T. Flohr, W. Muranyi, E. Goulmy, G. J. Hammerling, U. H. Koszinowski, and F. Momburg. 1997. A viral ERresident glycoprotein inactivates the MHC-encoded peptide transporter. Immunity 6:623. 52. Jugovic, P., A. M. Hill, R. Tomazin, H. Ploegh, and D. C. Johnson. 1998. Inhibition of major histocompatibility complex class I antigen presentation in pig and primate cells by herpes simplex virus type 1 and 2 ICP47. J Virol. 72:5076. 53. Klein, J., R. E. Bontrop, R. L. Dawkins, H. A. Erlich, U. B. Gyllensten, E. R. Heise, P. P. Jones, P. Parham, E. K. Wakeland, and D. I. Watkins. 1990. Nomenclature for the major histocompatibility complexes of different species: a proposal. Immunogenetics 31:217. 54. Ohno, S. 1970. The enormous diversity in genome sizes of fish as a reflection of nature’s extensive experiments with gene duplication. Trans. Am. Fish. Soc. 99: 120. 55. Kaufman, J., R. Andersen, D. Avila, J. Engberg, J. Lambris, J. Salomonsen, K. Welinder, and K. Skjodt. 1992. Different features of the MHC class I heterodimer have evolved at different rates: chicken B-F and b2-microglobulin sequences reveal invariant surface residues. J. Immunol. 148:1532. 56. Harris, M. R., Y. Y. Yu, C. S. Kindle, T. H. Hansen, and J. C. Solheim. 1998. Calreticulin and calnexin interact with different protein and glycan determinants during the assembly of MHC class I. J. Immunol. 160:5404. 57. Guild, B. C., and J. L. Strominger. 1984. Human and murine class I MHC antigens share conserved serine 335, the site of HLA phosphorylation in vivo. J. Biol. Chem. 259:9235. 58. Bartl, S. 1998. What sharks can tell us about the evolution of MHC genes. Immunol. Rev. 166:317. 59. Miller, K. M., and R. E. Withler. 1998. The salmonid class I MHC: limited diversity in a primitive teleost. Immunol. Rev. 166:279. 60. Hunt, H. D., G. T. Pharr, and L. D. Bacon. 1994. Molecular analysis reveals MHC class I intra-locus recombination in the chicken. Immunogenetics 40:370. 61. Kasahara, M., E. C. McKinney, M. F. Flajnik, and T. Ishibashi. 1993. The evolutionary origin of the major histocompatibility complex: polymorphism of class II a chain genes in the cartilaginous fish. Eur. J. Immunol. 23:2160. 62. Bartl, S., and I. L. Weissman. 1994. Isolation and characterization of major histocompatibility complex class IIB genes from the nurse shark. Proc. Natl. Acad. Sci. USA 91:262. 63. Okamura, K., M. Ototake, T. Nakanishi, Y. Kurosawa, and K. Hashimoto. 1997. The most primitive vertebrates with jaws possess highly polymorphic MHC class I genes comparable to those of humans. Immunity 7:777. 64. Bartl, S., M. A. Baish, M. F. Flajnik, and Y. Ohta. 1997. Identification of class I genes in cartilaginous fish, the most ancient group of vertebrates displaying an adaptive immune response. J. Immunol. 159:6097. 65. Parham, P., and T. Ohta. 1996. Population biology of antigen presentation by MHC class I molecules. Science 272:67. 66. Sunyer, J. O., I. Zarkadis, M. R. Sarrias, J. D. Hansen, and J. D. Lambris. 1998. Cloning, structure, and function of two rainbow trout Bf molecules. J. Immunol. 161:4106. 67. Nonaka, M., C. Namikawa, Y. Kato, M. Sasaki, L. Salter-Cid, and M. F. Flajnik. 1997. Major histocompatibility complex gene mapping in the amphibian Xenopus implies a primordial organization. Proc. Natl. Acad. Sci. USA 94:5789. 68. Takami, K., Z. Zaleska-Rutczynska, F. Figueroa, and J. Klein. 1997. Linkage of LMP, TAP, and RING3 with Mhc class I rather than class II genes in the zebrafish. J. Immunol. 159:6052. 69. Graser, R., V. Vincek, K. Takami, and J. Klein. 1998. Analysis of zebrafish Mhc using BAC clones. Immunogenetics 47:318. 70. Kuroda, N., H. Wada, K. Naruse, A. Simada, A. Shima, M. Sasaki, and
786
71.
72.
73.
74. 75.
M. Nonaka. 1996. Molecular cloning and linkage analysis of the Japanese medaka fish complement Bf/C2 gene. Immunogenetics 44:459. Namikawa-Yamada, C., K. Naruse, H. Wada, A. Shima, N. Kuroda, M. Nonaka, and M. Sasaki. 1997. Genetic linkage between the LMP2 and LMP7 genes in the medaka fish, a teleost. Immunogenetics 46:431. Ohta, Y., S. J. Powis, W. J. Coadwell, D. E. Haliniewski, Y. Liu, H. Li, and M. F. Flajnik. 1999. Identification and genetic mapping of Xenopus TAP2 genes. Immunogenetics 49:171. Namikawa, C., L. Salter-Cid, M. F. Flajnik, Y. Kato, M. Nonaka, and M. Sasaki. 1995. Isolation of Xenopus LMP-7 homologues: striking allelic diversity and linkage to MHC. J. Immunol. 155:1964. Kaufman, J., and H. J. Wallny. 1996. Chicken MHC molecules, disease resistance and the evolutionary origin of birds. Curr. Top. Microbiol. Immunol. 212:129. Kasahara, M., M. Vazquez, K. Sato, E. C. McKinney, and M. F. Flajnik. 1992. Evolution of the major histocompatibility complex: isolation of class II A cDNA clones from the cartilaginous fish. Proc. Natl. Acad. Sci. USA 89:6688.
MHC-RELATED GENES IN TROUT 76. Ohta, Y., D. E. Haliniewski, J. Hansen, and M. F. Flajnik. 1999. Isolation of transporter associated with antigen processing genes, TAP1 and TAP2, from the horned shark Heterodontus francisci. Immunogenetics. In press. 77. Kasahara, M., M. Hayashi, K. Tanaka, H. Inoko, K. Sugaya, T. Ikemura, and T. Ishibashi. 1996. Chromosomal localization of the proteasome Z subunit gene reveals an ancient chromosomal duplication involving the major histocompatibility complex. Proc. Natl. Acad. Sci. USA 93:9096. 78. Beck, S., S. Abdulla, R. P. Alderton, R. J. Glynne, I. G. Gut, L. K. Hosking, A. Jackson, A. Kelly, W. R. Newell, P. Sanseau, E. Radley, K. L. Thorpe, and J. Trowsdale. 1996. Evolutionary dynamics of non-coding sequences within the class II region of the human MHC. J. Mol. Biol. 255:1. 79. Wiegertjes, G. F., E. Egberts, and R. J. M. Stet. 1997. Segregation of MHC class I and class II genes in the common carp (Cyprinus carpio L.). Dev. Comp. Immunol. 21:105. 80. Stet, R. J. M., R. Johnstone, and P. Parham. 1997. The unMHC of teleostean fish: segregation analysis of common carp and Atlantic salmon. Hereditas 127:169.