Original Paper Received: September 10, 2013 Accepted: December 22, 2013 Published online: March 15, 2014
Blood Purif 2014;37:113–118 DOI: 10.1159/000358212
Online Kt/V Monitoring in Haemodialysis by UV Absorbance: Variations during Intra-Dialytic Meals Janina Müller-Deile a Ralf Lichtinghagen b Hermann Haller a Roland Schmitt a
a Division of Nephrology and Hypertension, Department of Medicine, and b Institute of Clinical Chemistry, Hannover Medical School, Hannover, Germany
Key Words Kt/V · Haemodialysis · UV absorbance · Intra-dialytic meals
Abstract Background/Aims: The aim of this study was to analyse if intra-dialytic food intake may lead to changes in online Kt/V. Methods: Forty patients were analysed using haemodialysis machines with integrated online Kt/V monitoring based on UV absorbance or ionic dialysance. Kt/V was monitored before, during and after food intake. Samples of dialysate were analysed for urea, uric acid, creatinine and glucose levels. Results: Food intake was associated with a significant decrease in relative Kt/V when determined by UV absorbance. The drop in Kt/V was independent of changes in blood pressure or body posture. No significant changes in online Kt/V were found using the ionic dialysance method. Dialysate samples showed a continuous clearance of urea, uric acid and creatinine during meals but a rapid increase in glucose. Conclusion: Our data suggest that the short meal-associated decrease in online Kt/V as measured by UV absorbance does not represent a true decline in Kt/V but might reflect an intermittent increase in UV-absorbing dialysed solutes. © 2014 S. Karger AG, Basel
© 2014 S. Karger AG, Basel 0253–5068/14/0372–0113$39.50/0 E-Mail
[email protected] www.karger.com/bpu
Introduction
Optimal dosing of haemodialysis (HD) treatment is important for end-stage renal disease patients [1]. Various indices for monitoring the HD dose have been described. The most commonly used equation for quantifying the dialysis dose is Kt/V, as calculated by estimation of urea clearance (K), treatment time (t) and urea distribution volume of the patient (V). Traditional monitoring of single-pool Kt/V requires blood sampling before and after HD in a tightly controlled manner since small variations in the sampling procedure can cause substantial problems in reliability [2]. Single-pool Kt/V measurements in blood samples are therefore logistically demanding, and the frequency of measurements is limited by extra cost and work. Different new methods have been introduced that are able to monitor Kt/V during dialysis treatment in a real-time manner. Some of these methods have been integrated into commercial systems offering the possibility to easily monitor Kt/V during each treatment. Methodologically, these systems either rely on ionic dialysance measurement, which is closely related to urea clearance, or they monitor solute concentrations in the spent dialysate [2]. An innovative optical method deRoland Schmitt, MD Hannover Medical School Carl-Neuberg-Strasse 1 DE–30625 Hannover (Germany) E-Mail schmitt.roland @ mh-hannover.de
Downloaded by: MHH-Bibliothek 193.174.105.74 - 4/26/2015 8:10:47 PM
Materials and Methods Patients Forty stable HD patients receiving maintenance HD thrice weekly were included in this observational analysis. All patients had been treated for at least 6 months, and none had symptomatic cardiovascular disease. Their mean age was 71 ± 14 years. All HD sessions were carried out according to the patients’ usual treatment protocols, including ultrafiltration rates prescribed to remove the previous inter-dialytic weight gain. The mean dialysate flow was 500 ml/min, and mean effective blood flow was 300 ml/min. All patients were dialysed via arterio-venous fistulas using a two-needle system. The inclusion criterion for study participation was stable dialysis, defined by stable blood pressure, absence of dyspnoea or physical weakness, and ability to rest in a 45–90° position during the entire dialysis session. Ethical approval was obtained from the Hannover Medical School Ethics Committee. Online Kt/V Monitoring Dialysis was performed using high-flux polysulfone dialysers and Dialog+ machines equipped with AdimeaTM (Braun AG, Germany) for monitoring online Kt/V or F4008 HD machines (Fresenius Medical Care, Germany) equipped with an online clearance monitoring (OCMTM) system. For the OCM system, where the value of V has to be provided, we used total body water values which were derived from standard multi-frequency bioelectrical impedance analysis which is performed quarterly in our patients 30 min after a midweek dialysis session, as previously described [9]. For each system, 20 patients were monitored during a routine HD session. Online Kt/V curves were recorded from integrated machine monitors.
114
Blood Purif 2014;37:113–118 DOI: 10.1159/000358212
Intra-Dialytic Meal Intra-dialytic food consisted of a routinely offered standard meal containing 2–3 slices of bread with cheese or marmalade and 200 ml of coffee, tea or apple juice. The meal was served around 120 min after the beginning of HD. As Kt/V measurements are performed at 25-min intervals by the OCMTM system, it was carefully ensured that a minimum of one Kt/V measurement occurred during food intake. Body positioning was not significantly different during the period of eating in comparison to the rest of the dialysis. During the analysis, patients did not take any drugs together with their intra-dialytic meal. Sampling Procedure Determination of concentrations of creatinine and glucose was performed in dialysate of patients on Dialog+ machines using an automated analyser (Beckman Analyzer, Beckman Instruments GmbH, Munich, Germany). Concentrations of uric acid and urea were analysed in the dialysate samples using UA plus and UREA/ BUN reagent on a modular automated analyser (P 800 module, Roche Diagnostics, Mannheim, Germany). Dialysate samples were taken at 15-min intervals from the effluent line. In 20 patients, samples were taken before, during and after food ingestion, and in 7 representative patients, samples were taken throughout the entire HD session. At the same time points, blood pressure was measured and patient body posture was registered. Sampling was not performed in the case of any machine alarms or during by-pass mode of the dialysis machine. Data Analysis All numerical values are presented as means ± SD. For sample normalization of Kt/V measured by OCM, creatinine, urea, uric acid and glucose, we used measurements from before meals that served as baseline values. Kt/V tracings from the Adimea system were processed by measuring time-dependent increments of Kt/V curves using standardized reference grids with 5-min intervals. Two-way analysis of variance with the Bonferroni post hoc test or unpaired t test was used to compare means between time points or groups. p < 0.05 was considered statistically significant.
Results
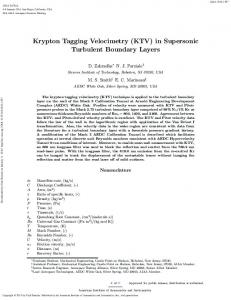
We found that intra-dialytic food intake had a direct and significant impact on online Kt/V as measured by the UV absorbance-based Adimea system. While the mean Kt/V change was 0.33 ± 0.02/h before food intake, it dropped within minutes after starting a meal to –0.01 ± 0.04/h (p < 0.001, corresponding to a relative decrease of 101.5 ± 50.4%). Within a time span of 1–5 min after finishing the meal, the change in Kt/V per hour increased back to almost the same level as before (0.32 ± 0.01/h; fig. 1a). This pattern was surprisingly uniform in all patients (fig. 1b). In order to further analyse these changes, we used a non-optical online clearance monitoring method which is based on measurements of ionic dialysance (OCM, FreMüller-Deile/Lichtinghagen/Haller/ Schmitt
Downloaded by: MHH-Bibliothek 193.174.105.74 - 4/26/2015 8:10:47 PM
termines the concentration of cleared waste solutes by measuring UV absorbance of the dialysate [3]. The close correlation between dialysate UV absorbance and the removal of urea allows continuous calculation of Kt/V values [4]. Several studies have validated this method, showing a close correlation of approximated Kt/V values to the laboratory-determined Kt/V value based on urea analyses in blood samples [4, 5]. A potential advantage of the optical online system is its continuous monitoring of Kt/V, which may help to immediately address intra-dialytic variations in dialysis adequacy as caused by needle displacement, recirculation, hypotension and clotting [6]. During routine use of this system in our chronic HD patient population, we often observed changes in the online Kt/V curve that occurred while patients were eating. A food-associated change in Kt/V has previously been described in patients with single-pool Kt/V analyses in blood samples [7, 8]. The goal of our observational study was to analyse the dynamic impact of intra-dialytic food intake on online Kt/V using a real-time UV absorbancebased monitoring system.
2.0
Kt/V
1.5 1.0 0.5 0
a
0
30
60
90
Glucose
120 Time (min)
150
180
210
240
Kt/V/h
140 120 100 Change (%)
80 60 40 20 0 –20 Before
During Intra-dialytic meal
After
Fig. 1. a Online Kt/V recording of a representative patient using the UV absorbance-based Adimea system. Food ingestion was started 120 min after beginning HD, as illustrated by the black bar. b Relative change in Kt/V per hour measured by Adimea, and par-
allel change in glucose concentrations measured in dialysate at 15min intervals before, during and after food intake (n = 20; concentrations are normalized to individual measurements before the meal).
senius Medical Care). Interestingly, we found no significant food-associated changes in online Kt/V values when OCM was used (deviation from pre-meal values: –0.25 ± 3.9%, p = 0.9). Importantly, blood pressure measurements showed no significant drop in our patients during food intake. Mean systolic and diastolic blood pressure were 128 ± 2.5/83 ± 1.7 mm Hg before and 126 ± 2.2/82 ± 1.44 mm Hg during food intake (p = 0.1 and 0.09, respectively). We could also exclude changes in patients’ posture as an influencing factor on the reduction in Kt/V as patients maintained a stable body and head position during meals and used the non-fistula arm for eating. We obtained longitudinal measurements for urea, uric acid, creatinine and glucose in dialysate samples. While
analyses for urea, uric acid and creatinine revealed a constant decrease throughout dialysis treatment (fig. 2a, b), we observed a significant and sharp increase in glucose levels during food intake (fig. 2b) which coincided with the decrease in Kt/V change per hour (fig. 1a).
Online Kt/V during Food Intake
Blood Purif 2014;37:113–118 DOI: 10.1159/000358212
Discussion
Kt/V is a widely used surrogate for the adequacy of HD. Kt/V is affected by the type and size of the dialyser membrane, the duration of dialysis sessions, the blood flow rate and the adequacy of vascular access. It has also been suggested that food intake might affect Kt/V. While Singri et al. [10] reported that a meal before dialysis had 115
Downloaded by: MHH-Bibliothek 193.174.105.74 - 4/26/2015 8:10:47 PM
b
Urea (mmol/l)
5 4
60 40
2
0
a
20
0
30
60
90
120 Time (min)
150
180
6.5
Glucose (mmol/l)
80
3
1 210
Glucose Creatinine
6.0
0 240 250 200 150
5.5 100 5.0 4.5
b
100
50
0
30
60
90
120 Time (min)
150
180
210
Uric acid (μmol/l)
Uric acid Urea
Creatinine (μmol/l)
6
0 240
Fig. 2. Mean concentrations of uric acid and urea (a) and creatinine and glucose (b) in dialysate samples of 7
no impact on Kt/V, two small studies found a slight but significant decrease in Kt/V when food was ingested during dialysis [7, 8]. In these studies, Kt/V was calculated by the Daugirdas formula using urea values from predialysis and postdialysis blood samples. The authors speculated that meal-related haemodynamic effects and a change in circulating blood volume might be responsible for the observed decrease in Kt/V [7]. Using the real-time UV absorbance-based Adimea system, we observed an almost immediate reduction in the slope of the Kt/V curve during food intake. This very uniform effect was not reproducible when online Kt/V was determined using an ionic dialysance-based system. For correct interpretation of this discrepancy, it is important to consider differences in the employed methodology. The Adimea system is based on the principle that urea levels in plasma and UV absorbance in dialysate are high at the beginning of dialysis. In the middle of dialysis, the volume of excreted substances is considerably reduced and less UV light is absorbed. At the end of HD, 116
Blood Purif 2014;37:113–118 DOI: 10.1159/000358212
few molecules remain in the dialysate and the UV absorbance is very low. The sudden drop in the relative Kt/V change per hour during meals indicates that the concentration of UV-absorbing solutes in the dialysate remains constant instead of further declining. As Adimea technology uses the longitudinal reduction of UV absorption in the dialysate for calculating online Kt/V, the observed drop during intra-dialytic food intake indicates a transient relative increase in the concentration of UV-absorbing solutes. There are several potential reasons that could account for the altered UV absorbance during meals. It is possible that there is a higher removal of uremic toxins due to increased mobilisation of small molecular substances from the second and third compartment during food intake. In this context, it is important to note that the described effect on Kt/V occurred rapidly while eating and diminished 5 min after the meal was finished at the latest. Circulatory changes due to digestion would be expected to extend longer into the postprandial phase. An alternative explanation could be that specific ingested Müller-Deile/Lichtinghagen/Haller/ Schmitt
Downloaded by: MHH-Bibliothek 193.174.105.74 - 4/26/2015 8:10:47 PM
representative patients. Samples were taken at 15-min intervals during entire HD treatments which were performed using Dialog+ machines (mean values ± SD; n = 7). Food ingestion is illustrated by a black bar.
food components are rapidly absorbed and dialysed. If these substances are UV absorbing they must contribute to altered total dialysate UV absorbance. The only molecule in our dialysate analysis showing a meal-related increase was glucose. As the Adimea system uses a wavelength of 280 nm, glucose cannot explain differences in UV absorbance given its absorbance maximum in the infrared spectrum. However, other rapidly absorbed molecules could account for the changes. Along these lines, several non-uremic solutes, drug metabolites and unidentified molecules that contribute significantly to the UV absorbance signal during dialysis have been found by chromatography in the spent dialysate [11]. One such molecule is uric acid, which has been identified as a major contributor to total dialysate UV absorbance [11]. Interestingly, Kanbay et al. [12] found a correlation between dietary fructose intake and elevated uric acid levels. However, uric acid levels showed a constant decrease during food intake in dialysate samples of our patients, making uric acid an unlikely candidate for the observed changes in UV absorbance. As our patients did not take any drugs with the intra-dialytic food we can also exclude an increase in drug metabolites as a potential cause for altered UV absorbance. We found that Kt/V values remained constant during meals when using the OCM device. OCM uses short pulsed variations in solute concentration to estimate sodium flux along the dialyser as a surrogate for urea clearance [13]. These conductivity-derived values are used together with the patient’s urea distribution volume to calculate Kt/V [2]. The resulting Kt/V shows a high correlation with single-pool Kt/V analyses in blood samples [14]. In contrast to enzymatic online urea measurement or compared to the Adimea system, OCM monitoring is a more indirect approximation which is not able to
detect changes in the amount of dialysed solutes [2]. The stable OCM-derived Kt/V during meals as opposed to the decreasing Adimea-derived Kt/V would therefore be compatible with a higher load of dialysed UV-absorbing solutes. On the other hand, if the apparent change in Kt/V was due to systemic changes, such as decreased circulating blood volume, hypotension or shunt recirculation, a similar change should have been found with the OCM system [2]. We have to point out that in contrast to Adimea, OCM measurements are performed at longer intervals (25 min), which makes the system less suitable to detect immediate changes in clearance performance. It has been noted that intra-dialytic hypotension might be associated with decreased removal of solutes. There is little doubt that intra-dialytic food intake can trigger hypotensive episodes in end-stage renal disease patients [15]. However, this response is far from being uniform in all patients and seems to depend on the amount of food ingested, on the volume status and on the rate of concomitant ultrafiltration [16]. Blood pressure in our patients showed no significant change during the period of eating, which argues against an important impact of such haemodynamic effects. In summary, this is the first report analysing the influence of intra-dialytic food intake on online calculated Kt/V. Our data indicate that the apparent food-associated drop in Kt/V as measured by the UV absorbance-based system represents a method-dependent effect. Our data suggest a relative increase in UV absorbance of the dialysate during meals which could be due to the liberation of solutes from extra-circulatory compartments or due to the occurrence of rapidly absorbed molecules that are dialysed. Taking these results into account will help to avoid misinterpretations of variations in clinical online Kt/V measurements.
References
Online Kt/V during Food Intake
4 Uhlin F, Fridolin I, Magnusson M, Lindberg LG: Dialysis dose (Kt/V) and clearance variation sensitivity using measurement of ultraviolet-absorbance (on-line), blood urea, dialysate urea and ionic dialysance. Nephrol Dial Transplant 2006; 21: 2225– 2231. 5 Castellarnau A, Werner M, Gunthner R, Jakob M: Real-time Kt/V determination by ultraviolet absorbance in spent dialysate: technique validation. Kidney Int 2010; 78: 920– 925.
6 Uhlin F, Fridolin I, Magnusson M, Lindberg LG: On line monitoring using ultraviolet absorption for surveillance of clinical events during hemodialysis (in German). J Ren Care 2006;32:141–146. 7 Kara B, Acikel CH: The effect of intradialytic food intake on the urea reduction ratio and single-pool Kt/V values in patients followedup at a hemodialysis center. Turk J Med Sci 2010;40:91–97. 8 San Juan Miguelsanz M, Pilar SM, Santos de Pablos MR: Reduction of Kt/V by food intake during haemodialysis. EDTNA ERCA J 2001; 27:150–152.
Blood Purif 2014;37:113–118 DOI: 10.1159/000358212
117
Downloaded by: MHH-Bibliothek 193.174.105.74 - 4/26/2015 8:10:47 PM
1 Held PJ, Port FK, Wolfe RA, Stannard DC, Carroll CE, Daugirdas JT, Bloembergen WE, Greer JW, Hakim RM: The dose of hemodialysis and patient mortality. Kidney Int 1996; 50:550–556. 2 Stiller S, Al-Bashir A, Mann H: On-line urea monitoring during hemodialysis: a review. Saudi J Kidney Dis Transpl 2001; 12: 364– 374. 3 Uhlin F, Fridolin I, Lindberg LG, Magnusson M: Estimation of delivered dialysis dose by on-line monitoring of the ultraviolet absorbance in the spent dialysate. Am J Kidney Dis 2003;41:1026–1036.
118
11 Arund J, Tanner R, Uhlin F, Fridolin I: Do only small uremic toxins, chromophores, contribute to the online dialysis dose monitoring by UV absorbance? Toxins 2012; 4: 849–861. 12 Kanbay M, Sánchez-Lozada LG, Franco M, Madero M, Solak Y, Rodriguez-Iturbe B, Covic A, Johnson RJ: Microvascular disease and its role in the brain and cardiovascular system: a potential role for uric acid as a cardiorenal toxin. Nephrol Dial Transplant 2011;26: 430–437. 13 Al Saran K, Sabry A, Abdulghafour M, Yehia A: Online conductivity monitoring of dialysis adequacy versus Kt/V derived from urea reduction ratio: a prospective study from a Saudi center. Ren Fail 2010;32:36–40.
Blood Purif 2014;37:113–118 DOI: 10.1159/000358212
14 Kuhlmann U, Goldau R, Samadi N, Graf T, Gross M, Orlandini G, Lange H: Accuracy and safety of online clearance monitoring based on conductivity variation. Nephrol Dial Transplant 2001;16:1053–1058. 15 Strong J, Burgett M, Buss ML, Carver M, Kwankin S, Walker D: Effects of calorie and fluid intake on adverse events during hemodialysis. J Ren Nutr 2001;11:97–100. 16 Benaroia M, Iliescu EA: Oral intake during hemodialysis: is there an association with intradialytic hypotension? Hemodial Int 2008; 12:62–65.
Müller-Deile/Lichtinghagen/Haller/ Schmitt
Downloaded by: MHH-Bibliothek 193.174.105.74 - 4/26/2015 8:10:47 PM
9 David S, Kumpers P, Eisenbach GM, Haller H, Kielstein JT: Prospective evaluation of an in-centre conversion from conventional haemodialysis to an intensified nocturnal strategy. Nephrol Dial Transplant 2009; 24: 2232– 2240. 10 Singri N, Johnstone D, Paparello J, Khosla N, Ahya SN, Ghossein C, Schlueter W, Rosa R, Batlle D, Levin ML: Effect of predialysis eating on measurement of urea reduction ratio and Kt/V. Adv Chronic Kidney Dis 2004;11:398– 403.