Opinion Mining of Spanish Customer Comments with Non-Expert. Annotations on Mechanical Turk. Bart Mellebeek, Francesc Benavent, Jens Grivolla,.
Opinion Mining of Spanish Customer Comments with Non-Expert Annotations on Mechanical Turk Bart Mellebeek, Francesc Benavent, Jens Grivolla, Joan Codina, Marta R. Costa-juss`a and Rafael Banchs Barcelona Media Innovation Center Av. Diagonal, 177, planta 9 08018 Barcelona, Spain {bart.mellebeek|francesc.benavent|jens.grivolla|joan.codina| marta.ruiz|rafael.banchs}@barcelonamedia.org
Abstract One of the major bottlenecks in the development of data-driven AI Systems is the cost of reliable human annotations. The recent advent of several crowdsourcing platforms such as Amazon’s Mechanical Turk, allowing requesters the access to affordable and rapid results of a global workforce, greatly facilitates the creation of massive training data. Most of the available studies on the effectiveness of crowdsourcing report on English data. We use Mechanical Turk annotations to train an Opinion Mining System to classify Spanish consumer comments. We design three different Human Intelligence Task (HIT) strategies and report high inter-annotator agreement between non-experts and expert annotators. We evaluate the advantages/drawbacks of each HIT design and show that, in our case, the use of non-expert annotations is a viable and costeffective alternative to expert annotations.
1
Introduction
Obtaining reliable human annotations to train datadriven AI systems is often an arduous and expensive process. For this reason, crowdsourcing platforms such as Amazon’s Mechanical Turk1 , Crowdflower2 and others have recently attracted a lot of attention from both companies and academia. Crowdsourcing enables requesters to tap from a global pool of non-experts to obtain rapid and affordable answers to simple Human Intelligence Tasks (HITs), which 1 2
https://www.mturk.com http://crowdflower.com/
can be subsequently used to train data-driven applications. A number of recent papers on this subject point out that non-expert annotations, if produced in a sufficient quantity, can rival and even surpass the quality of expert annotations, often at a much lower cost (Snow et al., 2008), (Su et al., 2007). However, this possible increase in quality depends on the task at hand and on an adequate HIT design (Kittur et al., 2008). In this paper, we evaluate the usefulness of MTurk annotations to train an Opinion Mining System to detect opinionated contents (Polarity Detection) in Spanish customer comments on car brands. Currently, a large majority of MTurk tasks is designed for English speakers. One of our reasons for participating in this shared task was to find out how easy it is to obtain annotated data for Spanish. In addition, we want to find out how useful these data are by comparing them to expert annotations and using them as training data of an Opinion Mining System for polarity detection. This paper is structured as follows. Section 2 contains an explanation of the task outline and our goals. Section 3 contains a description of three different HIT designs that we used in this task. In Section 4, we provide a detailed analysis of the retrieved HITs and focus on geographical information of the workers, the correlation between the different HIT designs, the quality of the retrieved answers and on the cost-effectiveness of the experiment. In Section 5, we evaluate the incidence of MTurk-generated annotations on a polarity classification task using two different experimental settings. Finally, we conclude
114 Proceedings of the NAACL HLT 2010 Workshop on Creating Speech and Language Data with Amazon’s Mechanical Turk, pages 114–121, c Los Angeles, California, June 2010. 2010 Association for Computational Linguistics
in Section 6.
2
Task Outline and Goals
We compare different HIT design strategies by evaluating the usefulness of resulting Mechanical Turk (MTurk) annotations to train an Opinion Mining System on Spanish consumer data. More specifically, we address the following research questions: (i) Annotation quality: how do the different MTurk annotations compare to expert annotations? (ii) Annotation applicability: how does the performance of an Opinion Mining classifier vary after training on different (sub)sets of MTurk and expert annotations? (iii) Return on Investment: how does the use of MTurk annotations compare economically against the use of expert annotations? (iv) Language barriers: currently, most MTurk tasks are designed for English speakers. How easy is it to obtain reliable MTurk results for Spanish?
3
HIT Design
We selected a dataset of 1000 sentences containing user opinions on cars from the automotive section of www.ciao.es (Spanish). This website was chosen because it contains a large and varied pool of Spanish customer comments suitable to train an Opinion Mining System and because opinions include simultaneously global numeric and specific ratings over particular attributes of the subject matter. Section 5.1 contains more detailed information about the selection of the dataset. An example of a sentence from the data set can be found in (1): (1)
‘No te lo pienses m´as, c´ompratelo!’ (= ‘Don’t think twice, buy it!’)
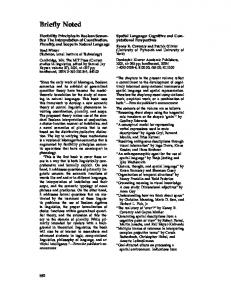
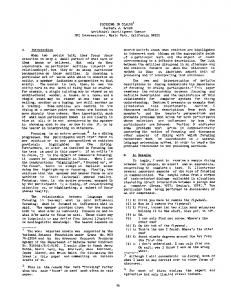
The sentences in the dataset were presented to the MTurk workers in three different HIT designs. Each HIT design contains a single sentence to be evaluated. HIT1 is a simple categorization scheme in which workers are asked to classify the sentence as being either positive, negative or neutral, as is shown in Figure 1b. HIT2 is a graded categorization template in which workers had to assign a score between -5 (negative) and +5 (positive) to the example sentence, as is shown in Figure 1c. Finally, HIT3 is a continuous triangular scoring template that allows 115
Figure 1: An example sentence (a) and the three HIT designs used in the experiments: (b) HIT1: a simple categorization scheme, (c) HIT2: a graded categorization scheme, and (d) HIT3: a continuous triangular scoring scheme containing both a horizontal positive-negative axis and a vertical subjective-objective axis.
workers to use both a horizontal positive-negative axis and a vertical subjective-objective axis by placing the example sentence anywhere inside the triangle. The subjective-objective axis expresses the degree to which the sentence contains opinionated content and was earlier used by (Esuli and Sebastiani, 2006). For example, the sentence ‘I think this is a wonderful car’ clearly marks an opinion and should be positioned towards the subjective end, while the sentence ‘The car has six cilinders’ should be located towards the objective end. Figure 1d contains an example of HIT3. In order not to burden the workers with overly complex instructions, we did not mention this subjective-objective axis but asked them instead to place ambiguous sentences towards the center of the horizontal positive-negative axis and more objective, non-opinionated sentences towards the lower neutral tip of the triangle.
For each of the three HIT designs, we specified the requirement of three different unique assignments per HIT, which led to a total amount of 3 × 3 × 1000 = 9000 HIT assignments being uploaded on MTurk. Mind that setting the requirement of unique assigments ensures a number of unique workers per individual HIT, but does not ensure a consistency of workers over a single batch of 1000 HITs. This is in the line with the philosophy of crowdsourcing, which allows many different people to participate in the same task.
4
Annotation Task Results and Analysis
After designing the HITs, we uploaded 30 random samples for testing purposes. These HITs were completed in a matter of seconds, mostly by workers in India. After a brief inspection of the results, it was obvious that most answers corresponded to random clicks. Therefore, we decided to include a small competence test to ensure that future workers would possess the necessary linguistic skills to perform the task. The test consists of six simple categorisation questions of the type of HIT1 that a skilled worker would be able to perform in under a minute. In order to discourage the use of automatic translation tools, a time limit of two minutes was imposed and most test sentences contain idiomatic constructions that are known to pose problems to Machine Translation Systems. 4.1
HIT Statistics
Table 1 contains statistics on the workers who completed our HITs. A total of 19 workers passed the competence test and submitted at least one HIT. Of those, four workers completed HITs belonging to two different designs and six submitted HITs in all three designs. Twelve workers are located in the US (64%), three in Spain (16%), one in Mexico (5%), Equador (5%), The Netherlands (5%) and an unknown location (5%). As to a comparison of completion times, it took a worker on average 11 seconds to complete an instance of HIT1, and 9 seconds to complete an instance of HIT2 and HIT3. At first sight, this result might seem surprising, since conceptually there is an increase in complexity when moving from HIT1 to HIT2 and from HIT2 to HIT3. These results might 116
ID 1 2 3 4 5 6 7 8 9 10 11 12 13 14 15 16 17 18 19
Overall C mx us nl us es ec us us us us us us es es us us us ? us
% 29.9 27.6 11.0 9.5 9.4 4.1 3.6 2.2 0.6 0.5 0.4 0.4 0.4 0.3 0.3 0.2 0.2 0.1 0.1
HIT1 # sec. 794 11.0 980 8.3 85 8.3 853 16.8 151 9.4 3 15.7 77 8.2 43 5.3 8 24.7 6 20 -
HIT2 # sec. 967 8.6 507 7.8 573 10.9 579 9.1 14 16.7 139 8.5 106 7.3 1 5 38 25.2 10 9.5 30 13.5 18 21.5 17 16.5 1 33
HIT3 # sec. 930 11.6 994 7.4 333 11.4 265 8.0 200 13.0 133 11.6 11 10.5 50 11.2 27 10.8 35 15.1 22 8.9 -
Table 1: Statistics on MTurk workers for all three HIT designs: (fictional) worker ID, country code, % of total number of HITs completed, number of HITs completed per design and average completion time.
suggest that users find it easier to classify items on a graded or continuous scale such as HIT2 and HIT3, which allows for a certain degree of flexibility, than on a stricter categorical template such as HIT1, where there is no room for error. 4.2
Annotation Distributions
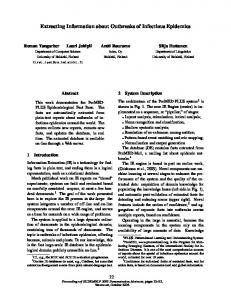
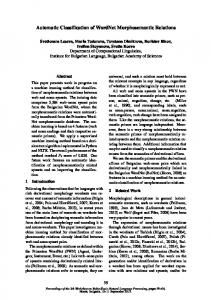
In order to get an overview of distribution of the results of each HIT, a histogram was plotted for each different task. Figure 2a shows a uniform distribution of the three categories used in the simple categorization scheme of HIT1, as could be expected from a balanced dataset. Figure 2b shows the distribution of the graded categorization template of HIT2. Compared to the distribution in 2a, two observations can be made: (i) the proportion of the zero values is almost identical to the proportion of the neutral category in Figure 2a, and (ii) the proportion of the sum of the positive values [+1,+5] and the proportion of the sum of the negative values [-5,-1] are equally similar to the proportion of the positive and negative categories in 2a. This suggests that in order to map the graded annotations of HIT2 to the categories of HIT1, an intuitive partitioning of the graded scale into three equal parts should be avoided. Instead, a more adequate alternative would consist of mapping [-5,-1] to negative, 0
Figure 2: Overview of HIT results: a) distribution of the three categories used in HIT1, b) distribution of results in the scaled format of HIT2, c) heat map of the distribution of results in the HIT3 triangle, d) distribution of projection of triangle data points onto the X-axis (positive/negative).
to neutral and [+1,+5] to positive. This means that even slightly positive/negative grades correspond to positive/negative categories. Figure 2c shows a heat map that plots the distribution of the annotations in the triangle of HIT3. It appears that worker annotations show a spontaneous tendency of clustering, despite the continuous nature of the design. This suggests that this HIT design, originally conceived as continuous, was transformed by the workers as a simpler categorization task using five labels: negative, ambiguous and positive at the top, neutral at the bottom, and other in the center. Figure 2d shows the distribution of all datapoints in the triangle of Figure 2c, projected onto the X-axis (positive/negative). Although similar to the graded scale in HIT2, the distribution shows a slightly higher polarization. These results suggest that, out of all three HIT designs, HIT2 is the one that contains the best balance between the amount of information that can be obtained and the simplicity of a one-dimensional annotation. 4.3
Annotation Quality
The annotation quality of MTurk workers can be measured by comparing them to expert annotations. 117
This is usually done by calculating inter-annotator agreement (ITA) scores. Note that, since a single HIT can contain more than one assignment and each assignment is typically performed by more than one annotator, we can only calculate ITA scores between batches of assignments, rather than between individual workers. Therefore, we describe the ITA scores in terms of batches. In Table 4.4, we present a comparison of standard kappa3 calculations (Eugenio and Glass, 2004) between batches of assignments in HIT1 and expert annotations. We found an inter-batch ITA score of 0.598, which indicates a moderate agreement due to fairly consistent annotations between workers. When comparing individual batches with expert annotations, we found similar ITA scores, in the range between 0.628 and 0.649. This increase with respect to the inter-batch score suggests a higher variability among MTurk workers than between workers and experts. In order to filter out noise in worker annotations, we applied a simple majority voting procedure in which we selected, for each sentence in HIT1, the most voted category. This results in an additional 3 In reality, we found that fixed and free margin Kappa values were almost identical, which reflects the balanced distribution of the dataset.
batch of annotations. This batch, refered in Table 4.4 as Majority, produced a considerably higher ITA score of 0.716, which confirms the validity of the majority voting scheme to obtain better annotations. In addition, we calculated ITA scores between three expert annotators on a separate, 500-sentence dataset, randomly selected from the same corpus as described at the start of Section 3. This collection was later used as test set in the experiments described in Section 5. The inter-expert ITA scores on this separate dataset contains values of 0.725 for κ1 and 0.729 for κ2 , only marginally higher than the Majority ITA scores. Although we are comparing results on different data sets, these results seem to indicate that multiple MTurk annotations are able to produce a similar quality to expert annotations. This might suggest that a further increase in the number of HIT assignments would outperform expert ITA scores, as was previously reported in (Snow et al., 2008).
do not take into account the costs of preparing the data and HIT templates, but it can be assumed that these costs will be marginal when large data sets are used. Moreover, most of this effort is equally needed for preparing data for in-house annotation.
4.4
This section intends to evaluate the incidence of MTurk-generated annotations on a polarity classification task. We present two different evaluations. In section 5.2, we compare the results of training a polarity classification system with noisy available metadata and with MTurk generated annotations of HIT1. In section 5.3, we compare the results of training several polarity classifiers using different training sets, comparing expert annotations to those obtained with MTurk.
Annotation Costs
As explained in Section 3, a total amount of 9000 assignments were uploaded on MTurk. At a reward of .02$ per assignment, a total sum of 225$ (180$ + 45$ Amazon fees) was spent on the task. Workers perceived an average hourly rate of 6.5$/hour for HIT1 and 8$/hour for HIT2 and HIT3. These figures suggest that, at least for assignments of type HIT2 and HIT3, a lower reward/assignment might have been considered. This would also be consistent with the recommendations of (Mason and Watts, 2009), who claim that lower rewards might have an effect on the speed at which the task will be completed - more workers will be competing for the task at any given moment - but not on the quality. Since we were not certain whether a large enough crowd existed with the necessary skills to perform our task, we explicitly decided not to try to offer the lowest possible price. An in-house expert annotator (working at approximately 70$/hour, including overhead) finished a batch of 1000 HIT assignments in approximately three hours, which leads to a total expert annotator cost of 210$. By comparing this figure to the cost of uploading 3 × 1000 HIT assignments (75$), we saved 210 − 75 = 135$, which constitutes almost 65% of the cost of an expert annotator. These figures 118
Inter-batch Batch 1 vs. Expert Batch 2 vs. Expert Batch 3 vs. Expert Majority vs. Expert Experts4
κ1 0.598 0.628 0.649 0.626 0.716 0.725
κ2 0.598 0.628 0.649 0.626 0.716 0.729
Table 2: Interannotation Agreement as a measure of quality of the annotations in HIT1. κ1 = Fixed Margin Kappa. κ2 = Free Margin Kappa.
5
Incidence of annotations on supervised polarity classification
5.1
Description of datasets
As was mentioned in Section 3, all sentences were extracted from a corpus of user opinions on cars from the automotive section of www.ciao.es (Spanish). For conducting the experimental evaluation, the following datasets were used: 1. Baseline: constitutes the dataset used for training the baseline or reference classifiers in Experiment 1. Automatic annotation for this dataset was obtained by using the following naive approach: those sentences extracted from comments with ratings5 equal to 5 were assigned to category ‘positive’, those extracted 5
The corpus at www.ciao.es contains consumer opinions marked with a score between 1 (negative) and 5 (positive).
from comments with ratings equal to 3 were assigned to ‘neutral’, and those extracted from comments with ratings equal to 1 were assigned to ‘negative’. This dataset contains a total of 5570 sentences, with a vocabulary coverage of 11797 words. 2. MTurk Annotated: constitutes the dataset that was manually annotated by MTurk workers in HIT1. This dataset is used for training the contrastive classifiers which are to be compared with the baseline system in Experiment 1. It is also used in various ways in Experiment 2. The three independent annotations generated by MTurk workers for each sentence within this dataset were consolidated into one unique annotation by majority voting: if the three provided annotations happened to be different6 , the sentence was assigned to category ‘neutral’; otherwise, the sentence was assigned to the category with at least two annotation agreements. This dataset contains a total of 1000 sentences, with a vocabulary coverage of 3022 words. 3. Expert Annotated: this dataset contains the same sentences as the MTurk Annotated one, but with annotations produced internally by known reliable annotators7 . Each sentence received one annotation, while the dataset was split between a total of five annotators. 4. Evaluation: constitutes the gold standard used for evaluating the performance of classifiers. This dataset was manually annotated by three experts in an independent manner. The gold standard annotation was consolidated by using the same criterion used in the case of the previous dataset8 . This dataset contains a total of 500 sentences, with a vocabulary coverage of 2004 words. 6
This kind of total disagreement among annotators occurred only in 13 sentences out of 1000. 7 While annotations of this kind are necessarily somewhat subjective, these annotations are guaranteed to have been produced in good faith by competent annotators with an excellent understanding of the Spanish language (native or near-native speakers) 8 In this case, annotator inter-agreement was above 80%, and total disagreement among annotators occurred only in 1 sentence out of 500
119
Positive Negative Neutral Totals
Baseline 1882 1876 1812 5570
Annotated 341 323 336 1000
Evaluation 200 137 161 500
Table 3: Sentence-per-category distributions for baseline, annotated and evaluation datasets.
These three datasets were constructed by randomly extracting sample sentences from an original corpus of over 25000 user comments containing more than 1000000 sentences in total. The sampling was conducted with the following constraints in mind: (i) the three resulting datasets should not overlap, (ii) only sentences containing more than 3 tokens are considered, and (iii) each resulting dataset must be balanced, as much as possible, in terms of the amount of sentences per category. Table 3 presents the distribution of sentences per category for each of the three considered datasets. 5.2
Experiment one: MTurk annotations vs. original Ciao annotations
A simple SVM-based supervised classification approach was considered for the polarity detection task under consideration. According to this, two different groups of classifiers were used: a baseline or reference group, and a contrastive group. Classifiers within these two groups were trained with data samples extracted from the baseline and annotated datasets, respectively. Within each group of classifiers, three different binary classification subtasks were considered: positive/not positive, negative/not negative and neutral/not neutral. All trained binary classifiers were evaluated by computing precision and recall for each considered category, as well as overall classification accuracy, over the evaluation dataset. A feature space model representation of the data was constructed by considering the standard bag-ofwords approach. In this way, a sparse vector was obtained for each sentence in the datasets. Stop-word removal was not conducted before computing vector models, and standard normalization and TF-IDF weighting schemes were used. Multiple-fold cross-validation was used in all conducted experiments to tackle with statistical vari-
classifier positive/not positive negative/not negative neutral/not neutral
baseline 59.63 (3.04) 60.09 (2.90) 51.27 (2.49)
annotated 69.53 (1.70) 63.73 (1.60) 62.57 (2.08)
Table 4: Mean accuracy over 20 independent simulations (with standard deviations provided in parenthesis) for each classification subtasks trained with either the baseline or the annotated dataset.
ability of the data. In this sense, twenty independent realizations were actually conducted for each experiment presented and, instead of individual output results, mean values and standard deviations of evaluation metrics are reported. Each binary classifier realization was trained with a random subsample set of 600 sentences extracted from the training dataset corresponding to the classifier group, i.e. baseline dataset for reference systems, and annotated dataset for contrastive systems. Training subsample sets were always balanced with respect to the original three categories: ‘positive’, ‘negative’ and ‘neutral’. Table 4 presents the resulting mean values of accuracy for each considered subtask in classifiers trained with either the baseline or the annotated dataset. As observed in the table, all subtasks benefit from using the annotated dataset for training the classifiers; however, it is important to mention that while similar absolute gains are observed for the ‘positive/not positive’ and ‘neutral/not neutral’ subtasks, this is not the case for the subtask ‘negative/not negative’, which actually gains much less than the other two subtasks. After considering all evaluation metrics, the benefit provided by human-annotated data availability for categories ‘neutral’ and ‘positive’ is evident. However, in the case of category ‘negative’, although some gain is also observed, the benefit of humanannotated data does not seem to be as much as for the two other categories. This, along with the fact that the ‘negative/not negative’ subtask is actually the best performing one (in terms of accuracy) when baseline training data is used, might suggest that low rating comments contains a better representation of sentences belonging to category ‘negative’ than medium and high rating comments do with respect to classes ‘neutral’ and ‘positive’. 120
In any case, this experimental work only verifies the feasibility of constructing training datasets for opinionated content analysis, as well as it provides an approximated idea of costs involved in the generation of this type of resources, by using MTurk. 5.3
Experiment two: MTurk annotations vs. expert annotations
In this section, we compare the results of training several polarity classifiers on six different training sets, each of them generated from the MTurk annotations of HIT1. The different training sets are: (i) the original dataset of 1000 sentences annotated by experts (Experts), (ii) the first set of 1000 MTurk results (Batch1), (iii) the second set of 1000 MTurk results (Batch2), (iv) the third set of 1000 MTurk results (Batch3), (v) the batch obtained by majority voting between Batch1, Batch2 and Batch3 (Majority), and (vi) a batch of 3000 training instances obtained by aggregating Batch1, Batch2 and Batch3 (All). We used classifiers as implemented in Mallet (McCallum, 2002) and Weka (Hall et al., 2009), based on a simple bag-of-words representation of the sentences. As the objective was not to obtain optimum performance but only to evaluate the differences between different sets of annotations, all classifiers were used with their default settings. Table 5 contains results of four different classifiers (Maxent, C45, Winnow and SVM), trained on these six different datasets and evaluated on the same 500-sentence test set as explained in Section 5.1. Classification using expert annotations usually outperforms classification using a single batch (one annotation per sentence) of annotations produced using MTurk. Using the tree annotations per sentence available from MTurk, all classifiers reach similar or better performance compared to the single set of expert annotations, at a much lower cost (as explained in section 4.4). It is interesting to note that most classifiers benefit from using the full 3000 training examples (1000 sentences with 3 annotations each), which intuitively makes sense as the unanimously labeled examples will have more weight in defining the model of the corresponding class, whereas ambiguous or unclear cases will have their impact reduced as their characteristics are attributed to various classes. On the contrary, Support Vector Machines show
Experts
Batch1
Batch2
Batch3
Majority
All
System Winnow SVM C45 Maxent
44.2 57.6 42.2 59.2
43.6 53.0 33.6 55.8
40.4 55.4 42.0 57.6
47.6 54.0 41.2 54.0
46.2 57.2 41.6 57.6
50.6 52.8 45.0 58.6
Table 5: Accuracy figures of four different classifiers (Winnow, SVM, C45 and Maxent) trained on six different datasets (see text for details).
an important drop in performance when using multiple annotations, but perform well when using the majority vote. As a first intuition, this may be due to the fact that SVMs focus on detecting class boundaries (and optimizing the margin between classes) rather than developing a model of each class. As such, having the same data point appear several times with the same label will not aid in finding appropriate support vectors, whereas having the same data point with conflicting labels may have a negative impact on the margin maximization. Having only evaluated each classifier (and training set) once on a static test set it is unfortunately not possible to reliably infer the significance of the performance differences (or determine confidence intervals, etc.). For a more in-depth analysis it might be interesting to use bootstrapping or similar techniques to evaluate the robustness of the results.
6
Conclusions
In this paper we have examined the usefulness of non-expert annotations on Amazon’s Mechanical Turk to annotate the polarity of Spanish consumer comments. We discussed the advantages/drawbacks of three different HIT designs, ranging from a simple categorization scheme to a continous scoring template. We report high inter-annotator agreement scores between non-experts and expert annotators and show that training an Opinion Mining System with non-expert MTurk annotations outperforms original noisy annotations and obtains competitive results when compared to expert annotations using a variety of classifiers. In conclusion, we found that, in our case, the use of non-expert anno121
tations through crowdsourcing is a viable and costeffective alternative to the use of expert annotations. In the classification experiments reported in this paper, we have relied exclusively on MTurk annotations from HIT1. Further work is needed to fully analyze the impact of each of the HIT designs for Opinion Mining tasks. We hope that the added richness of annotation of HIT2 and HIT3 will enable us to use more sophisticated classification methods.
References A. Esuli and F. Sebastiani. 2006. SentiWordNet: a publicly available lexical resource for opinion mining. In Proceedings of LREC, volume 6. B. D Eugenio and M. Glass. 2004. The kappa statistic: A second look. Computational linguistics, 30(1):95101. Mark Hall, Eibe Frank, Geoffrey Holmes, Bernhard Pfahringer, Peter Reutemann, and Ian H. Witten. 2009. The weka data mining software: an update. SIGKDD Explor. Newsl., 11(1):10–18. A. Kittur, E. H Chi, and B. Suh. 2008. Crowdsourcing user studies with mechanical turk. W. Mason and D. J Watts. 2009. Financial incentives and the performance of crowds. In Proceedings of the ACM SIGKDD Workshop on Human Computation, pages 77–85. A. K. McCallum. 2002. Mallet: A machine learning for language toolkit. http://mallet.cs.umass.edu. R. Snow, B. O’Connor, D. Jurafsky, and A. Y Ng. 2008. Cheap and fastbut is it good?: evaluating non-expert annotations for natural language tasks. In Proceedings of the Conference on Empirical Methods in Natural Language Processing, pages 254–263. Q. Su, D. Pavlov, J. H Chow, and W. C Baker. 2007. Internet-scale collection of human-reviewed data. In Proceedings of the 16th international conference on World Wide Web, pages 231–240.