Proceedings DIPAC 2003 – Mainz, Germany
OPTICAL FIBRE DOSIMETER FOR SASE FEL UNDULATORS H. Henschel, J. Kuhnhenn, Fraunhofer-INT, Euskirchen, Germany M. Körfer*, DESY, Hamburg, Germany F. Wulf, HMI, Berlin, Germany
ABSTRACT
OPTICAL FIBRE DOSIMETER
Single pass Free Electron Lasers (FELs) based on selfamplified spontaneous-emission (SASE) are developed for high-brightness and short wavelength user applications. These light sources are related to short undulator periods which can be realized with permanent magnet designs. Unfortunately, the material is radiation sensitive and the undulators require a protection system. To monitor particle losses directly inside the undulator gap and to guarantee full magnetic performance for a long time, an optical fiber dosimeter has been developed and operated at the TESLA Test Facility (TTF). The dosimeter system allows online dose monitoring and beam particle loss optimisation.
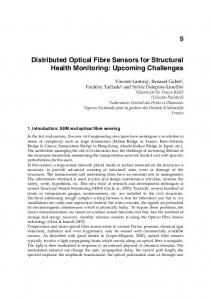
The most obvious effect of ionising radiation in optical fibres is an increase of light attenuation. The radiation penetrates the fibre and creates additional colour-centres which cause a wavelength-dependent attenuation that can be measured with an power-meter (Fig.1).
INTRODUCTION High gain single pass SASE FELs require high peak current (kA), ultra-short (100 µm) and low emittance (few mm mrad normalized) electron bunches. The TTF achieved long bunch trains with 1800 bunches per second, a bunch charge of 4 nC and a bunch spacing down to 444 ns. The average beam power was 1.8 kW. To realize safe beam operation a machine protection system was necessary. Due to the radiation sensitive permanent magnet material a protection of the undulator with an upstream collimator system was installed. The necessarily tight tolerance of the magnetic field integrals is ≤ 10 T mm2 (rms). Therefore, local particle losses and resulting doses inside the radiation sensitive permanent magnet undulator were recorded with an online dosimeter system. The fibre sensor should be as close as possible to the magnet surface inside the undulator gap. Since the gap between magnetic yoke and the flat vacuum chamber is less than 1 mm conventional online dosimeters do not fit in such a geometry. Moreover, the strong magnetic field environment is not compatible with electrical sensor cabling. The TESLA collaboration developed an optical fibre dosimeter for SASE FEL undulators. At TTF, the fibre optical power-meter system and an Optical Time Domain Reflectometer (OTDR) system [1] has been successfully operated, which allows one to obtain the accumulated dose continuously.
*
Radiation Effect on Optical Fibre The high purity of the modern fibre raw materials has reduced their radiation sensitivity. However, if the core material of Germanium (Ge)-doped Multi-Mode Gradient Index (MM-GI) fibres is co-doped with Phosphorus (P), their radiation-induced attenuation increases significantly so that these fibres are suitable for dosimeter purposes. A dedicated optical fibre for dosimeters shows (wavelengthdependent) a nearly linear increase of attenuation after irradiation. For the optical fibre used the calibration of dose D versus light attenuation A is valid up to 1000 Gy and independent of the dose-rate and source type. No systematic influence on the dose rate was observed between about 0.006 and 70 Gy/min.
General Layout A LED is connected with an optical fibre (Fig. 1). Light passing through the fibre will be continuously measured with the power-meter. Due to the irradiated fibre part, the light intensity suffers absorption leading to an attenuation step. The trace of attenuation increase versus time can be displayed at the accelerator control desk. PC
Optical Power Meter
Calibration Monitor
Senso Fiber
LED Source (~ 660
Attenuation Time
Figure 1: Scheme of an optical fibre dosimeter. The radiation produces absorbing "colour centres" in the sensor fibre. The light attenuation has been measured with an optical power-meter and allows one to determine the radiation dose.
corresponding author:
[email protected]
248
PT31
Posters Tuesday
Proceedings DIPAC 2003 – Mainz, Germany
Irradiated Optical Fibre Part
DOSIMETER OPERATION AT TTF 1 The system allows a sensitive dose measurement along the undulator. Figure 3 shows a diagram of the layout. Three undulators at TTF 1 were equipped with several turns of the sensor fibre around the beam pipe at different positions in the narrow gap. Due to the expected exponential dose distribution along the undulators the sensor positions were provided with different numbers of fibre turns.
The electron beam passing the undulator was in a vacuum chamber with an outer height of 12 mm and inner height of 9.5 mm. The dose profile generated around the chamber and directly at the permanent magnet surface was measured. Perpendicular to the beam propagation a sequence of Thermo Luminescence Dosimeters (TLDs) were installed in a line. The doses of each TLD set were measured several times. A representative measurement of dose versus TLD number is shown in Figure 2.
In
16
11
LED Source 660 nm
1 : 16 Splitter
9
9 11 13 15
Newport 8800 Optical Power Meter System
1 3 5 7
35 30
8 7 6
5
Reference
4
25
3 2
Ethernetbox 100
20
U N D U L A T O R 3
10 1
40
Dose [Gy]
12
Out
2 4 6 8 10 12 14 16
The light attenuation at the exit of the fibre depends on the total fibre length. For precise calculations of dose the exact length of the exposed fibre part is relevant. To ensure, that the forerun-fibres upstream and downstream deliver no parasitic radiation induced attenuation the fibre material was radiation hard and the cables are laid in shielded regions.
In
15
1
U N D U L A T O R 2
U N D U L A T O R 1
Out
10
Concrete Shielding
Beam
5 0
1
2
3
4
5
6
7
8
9
10
11
PC
Number of TLD's
Figure 2: Cross profile of particle losses in the undulator. A sequence of 11 TLD’s above the vacuum chamber, located perpendicular to the beam direction. Each TLD sensor with 6 mm length had a gap of 1 mm to the next one. The TLD sensors were 6 mm long and 1 mm apart. The resulting dose distribution was very narrow and can be approximated by a rectangle of the half height and equivalent area with a width of about 24 mm.Using this simplified assumption all irradiated fibre parts on top and bottom of the chamber were in addition assumed to be the same. Note, that the profile measurement could include different accelerator set ups, i.e. a combination of different profiles. The accuracy of this simple method was sufficient for our application. However, more precise dose calculations require measurements at each sensor position at all times.
Posters Tuesday
Switch
DESY Computer Centre
Webserver
Data transfer to the FhG-INT
Figure 3: Scheme of the fibre optical dosimeter arrangement at TTF1. LED light was subdivided onto different fibre sensors in the undulators. One splitter output was used as reference, for correcting drifts of the LED source. At the entrance of the undulator section 5 windings per sensor were chosen while at the end the sensors had 20 windings. The light of the LED was guided to a 1:16 splitter made of 50/125 µm GI fibre. One splitter output was used as a reference for corrections of the LED intensity drifts. Finally 12 residual outputs were connected to radiation sensitive sensors. Noise reduction was realized by an internal averaging routine of the power-meter as well as by the data evaluation program. The stability of the system was < 0.001 dB within a few hours. Such a high stability and accuracy can only be obtained with LED sources. The dynamic range was about 50 dB and covered the linear range of the dose
PT31
249
Proceedings DIPAC 2003 – Mainz, Germany calibration mentioned above. The resolution of the system was about 60 mGy (for 10 windings @ 660 nm).
(Figure 4) implies a higher dose rate and higher particle losses versus time. The total accumulated dose at each sensor position in a time period of 2 months is shown in Figure 5.
MEASUREMENT 600
Data were accumulated over a time period of six months. The dosimeter system behaved properly. The fibre sensors were replaced every two month before the accumulated dose had reached 1 kGy. As an example, ten days of the second measurement period from the end of January 2002 to March 2002 are shown in Figure 4. The accumulated dose at the five positions in the first undulator were selected. During accelerator shutdowns the fibre attenuation slightly annealed. To take this into account, only dose values corresponding to attenuation increases were summed up. This allows the determination of the accumulated dose independent of annealing.
500
Dose [Gy]
400 300 200 100 0
1
2
3
4
5
6
7
8
9
10
11
12
Number of sensors
Figure 5: Accumulated dose along the undulator at each sensor position. The number of sensors corresponds to the sensor location inside the undulators in Figure 3. Note, the fibre sensor has integrated the dose for different accelerator operation modes, such as SASE operation and CSR studies. Nevertheless, the expected exponential decrease of dose along the undulator generated by low energy photons escaping the absorber system of the collimator is included [2].
Figure 4: Representative plot of the accumulated dose at five positions in the first undulator. The distance between sensor positions is about 80 cm. The beam operation setups are strongly related to the accumulated dose. In the beginning, three days were set aside for accelerator access and beam operation for high order mode investigations in the super-conducting cavities. The first strong dose increase is related to the optimisation of SASE gain by tuning the optic twiss parameter in front of the undulator (i.e. transversal collimator). Continued optic studies for the beam transport through the collimator were completed in roughly 16 hours (two shifts). The procedure included the emittance measurements with quad scans at the collimator. The next step in the dose trace is probably due to beam energy jitter and resulting beta-function beat. Afterwards, between days six and nine two dose accumulations appear. These are related to Coherent Synchrotron Radiation (CSR) studies in the injector (i.e. bunch compressor BC2) and bunch length measurements with a streak camera downstream of the undulator. The first step is generated by changing beam parameters while the second one is caused by changing the phase of the acceleration module in front of BC2. The major slope
250
CONCLUSIONS A new online sensing system that measures the local origin of dose in SASE undulators was developed and operated during the TTF1 run. The advantages of an optical fibre power-meter dosimeter are: • • •
•
It enables the operator to control radiation emission in very lengthy objects. The dosimeter sensitivity can be adjusted to the dose by selection of fibre type, LED wavelength and spool windings. The dose can be measured in narrow slits, which are inaccessible for conventional online dosimeter systems. Bare (i.e. uncabled) fibres usually have a diameter of only 250 µm. Both radiation and beam loss in undulators can be tuned by an operator continuously.
REFERENCES [1] H. Henschel, M. Körfer, F. Wulf, Fibre Optical Radiation Sensing System for TESLA, DIPAC 2001 [2] H. Schlarb, Design and Performance of the TESLA Test Facility Collimator System, EPAC 2002
PT31
Posters Tuesday