1st International Conference on Sensing Technology November 21-23, 2005 Palmerston North, New Zealand
Optical Fibre Sensors for Vehicle Exhaust Gas Detection In the Ultra Violet Wavelength Range Gerard Dooley1, Eamonn Hawe1, Colin Fitzpatrick1, Elfed Lewis1,W.Z. Zhao2, T. Sun2, K.T.V. Grattan2, M. Degner3, H.Ewald3,S. Lochmann4, G. Bramman4, C. Wei5, D. Hitchen5, A. AlShamma’a5, E. Merlone-Borla 6, P Faraldi6, M.Pidria6 1 Optical Fibre Sensors Group, Dept. of Electronic and Computer Engineering, University of Limerick, IRELAND,2 School of Engineering and Mathematical Sciences, City University, Northampton Square, London EC1V 0HB, UK, 3Department of Electrical Engineering and Information Technology, Institute of General Electrical Engineering, Albert-Einstein-Str. 2, D-18051 Rostock, GERMANY, 4 Hochschule Wismar, Postfach 1210, Wismar 23952, GERMANY, 5Dept. of Electrical Engineering & Electronics, University of Liverpool, Liverpool, L69 3BX, UK. 6Emissions Aftertreatment Group, Advanced Process Technologies, Centro Ricerche Fiat, Strada Torino 50, 10043 Orbassano (TO), ITALY Contact:
[email protected]
Abstract. This paper describes an optical fibre sensor for the Detection of NOx (NO2 and NO) in the exhaust system of a road vehicle. The measurement is based on an a free path interaction zone which is interrogated using UV light guiding optical fibres and collimated lenses. Results are presented of the absorption spectra of the gases in the UV region and these demonstrate that using this method it is feasible to identify the individual NO and NO2 species as well as other gases in the exhaust system. Measurement of concentrations to the level of 10s parts per million (ppm) have been demonstrated.
Keywords: Optical Fibre Sensors, Gas Sensors, Ultraviolet Gas Absorption Spectroscopy and other gas sensing techniques. The increasing stringency of EC based legislation has meant that the latest standards (Euro IV) require that lower detection limits of typically tens of parts per million (ppm) are necessary for certain gases. The increase in the stringency of the legislation is best illustrated in the graphical representation of Fig.1
1. Introduction The requirement for detecting hazardous gases in a wide range of everyday applications is becoming increasingly important. Environmental concerns mean harmful emissions from industrial sources, vehicles, etc need to be accurately monitored. This has led to much work being performed in optical
Figure.1: Successive European Emission Standards on Gas Emissions from 1991 to date
42
1st International Conference on Sensing Technology November 21-23, 2005 Palmerston North, New Zealand
sensors an optical signal is transmitted through a gas sample which is located between the ends of two optical fibres. This offers the advantage of all light coming into contact with the gas sample along the full optical path between the fibres, which results in a greater amount of optical absorption resulting in an increase in sensitivity compared to the evanescent field sensor. A disadvantage of this type of sensor can be that in order to achieve optimum sensitivity the required path length can be long e.g. in the case of mid infra red sensors this can be metres or tens of metres to achieve 10s of ppm resolution. In the case of ultra violet based sensors the greater optical absorption of the lines for a given gas in this range (up to two orders of magnitude) means that interaction lengths can be reduced to the cm or 10s of cm range. A long path length is often difficult to achieve given that many applications require small non-intrusive sensors and results in significant optical signal power loss.
Optical fibre sensors are well suited to emissions monitoring because of their robust construction and low susceptibility to noise or interference. There are many exhaust gases of interest for monitoring in the automotive industry. The principal ones are Carbon Monoxide (CO), Nitrogen Dioxide (NO2), Nitrogen Monoxide (NO), Sulfur Dioxide (SO2), hydrocarbons as well as particulates. These gases are also emitted from a wide range of sources and a multitude of optical and non optical sensors have been developed to detect them [1-3]. This paper concentrates on the measurement of NO2 and NO both of which have absorption lines in the Ultraviolet Range. Within the domain of optical sensing a number of different approaches have been adopted in the including luminescence [1,3] and fluorescence [2-3] based sensors. These sensors can have long delay times, involve coatings whose maximum temperature is typically only 200 oC and are not therefore well suited to applications involving hot gases whose levels are rapidly fluctuating such as is the case in modern exhaust systems (temperatures can reach up to 700 oC in the upstream sections). Intrinsic fibre sensors using the evanescent field have also been investigated [4-5] but these sensors are also limited as only a small portion of the light (the evanescent field) comes into contact with the gas and this limits the interaction length of the gas with the sensor and thus limits its sensitivity. Some of the most results to date have come from extrinsic or “open-path” sensors [6-8]. In these
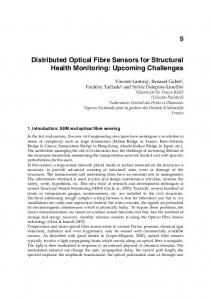
The work of this investigation has concentrated on the UV absorption lines of NO2 and NO which are not so far into the deep in the UV range such that commercial optical fibres, sources and detectors can be used (this means wavelengths between 210 nm and 400 nm). The absorption spectra for NO2 and NO are shown in Fig. 2.
NO2_298K_8 8.00E-19
no_298K_1
NO2
7.00E-19
7.00E-19
sigma [lg(cm^2)]
sigma [lg(cm^2)]
6.00E-19 5.00E-19 4.00E-19 3.00E-19
no_298K_1
6.00E-19 5.00E-19 4.00E-19 3.00E-19 2.00E-19 1.00E-19 0.00E+00
2.00E-19
200
205
210
215
Lambda [nm]
1.00E-19 0.00E+00 200
300
400
500
600
700
800
Lambda [nm]
(b) NO
(a) NO2
Figure 2: The absorption spectra of NO2 And NO (Source: Hitran Data base [9]
43
220
225
230
1st International Conference on Sensing Technology November 21-23, 2005 Palmerston North, New Zealand
length (60 cm). A similar analysis has shown a similar trend for NO. The absorption crossections indicated in Fig 2 show that the optical absorption magnitude of NO should be similar to that of NO2 but if the system has a reasonable spectral resolution (better than 10s of nm) it is possible to distinguish these two gas species. Most modern low cost spectrometers have resolutions better than 1nm.
2. Theory The absorption of light in a homogeneous gas medium is determined from the Beer-Lambert law:
I (λ , L ) = e (α ( λ ) nL ) Io
(1)
3. Experimental Measurement System
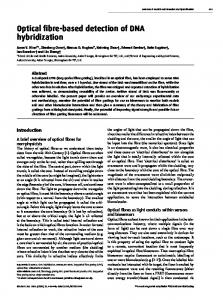
Where I(λ,L) is the transmitted intensity, Io is the incident intensity, L is the optical path length, n is the concentration and α(λ) is the absorption coefficient. From this simple representation it is possible to determine the transmitted intensity as a fraction or percentage at a given wavelength if the absorption characteristics of the gas are known (e.g. absorption cross section). These are readily available from the Hitran database for most molecular gases [9]. Using this the theoretical absorption of the gases was plotted against concentration over the range 10 to typically a few 100 ppm. The calculated NO2 absorption is shown over the range 0 to 140 ppm in Fig 3.
The experimental set-up is shown in Figure 4. Light was input to the transmitting fibre (Optran UVNS, Ultra Violet Non Solarising) a Deuterium – Halogen Lamp (DH-2000 from Ocean Optics) and detected at the end of the same type of optical fibre by an Ocean Optics S200 spectrometer. UV transmitting quartz lenses were located at the fibre ends in order to collimated and collect the light transmitted through the gas Gas was input into the cell via its inlet ports. Conventional piping was used to transport the gas to and from the gas test cell. The concentration of gas present was simultaneously monitored using a quintox gas analyser from Kane-May (KM9106). The light source has a range extending to 190 nm. The spectrometer has a range 200 to 1700 nm and its spectral resolution is 1 nm The Gas test cell is shown photographically in Fig 5
Fig 3 shows that over the limited range in question the absorption is highly linear. Although in practice there are other complicating factors such as scattering and temperature dependence, the calculations show that tit is possible to measure absorption of NO2 down to concentration levels below 20 ppm at this wavelength (380nm) and path
Percent Absorption Th e o r y Vs M e a su r e d R e su l t s
12
10
8
6
4
2
0 0
20
40
60
80
100
120
140
PPM
Concentration (ppm) Figure 3: Theoretical plot of Absorption of NO2 with concentration for a 60 cm path length
44
1st International Conference on Sensing Technology November 21-23, 2005 Palmerston North, New Zealand
Figure 4: Experimental Test Set Up for UV Measurement
Figure 5: Experimental Gas Test Cell such low concentration levels. The results of these tests are shown in Fig 7 which comprises the absorption measured at a wavelength of 390nm as the NO2 concentration was varied between 15 and 160 ppm.
4. Results and Analysis Results were recorded for individual NO and NO2 in air mixtures. The levels tested initially were up to 5000ppm of NO. Under these conditions some of the NO oxidizes and is converted to NO2. The results for this mixture is shown in Fig 6. The spectrum of figure 6 clearly shows a clearly defined peak at a wavelength of just over 225 nm as well as a broader peak centered on about 390 nm. The former corresponds to NO and the latter to NO2. Both these peaks correspond to the theoretical absorption spectra of Fig 2. The spectrum of Fig 5 shows that the optical signals for NO and NO2 are clearly separable by their spectral displacement. The Results of Fig 6 are for relatively large amounts of NO2 (5000 ppm) which are much higher than those experienced in the exhaust systems of modern road vehicles and well above the limits of detection required for the Euro IV standards (typically 10s of ppm). In order to demonstrate that this system is capable of detection at such low levels a specialist test facility located at .Wismar, Germany which allow accurate mixing of gases to
The results of Fig. 7 clearly show that as the concentration is reduced the absorption also reduces. It was possible to measure absorption to as low as 15 ppm NO2 using this system.
5. Conclusion The experimental results of this investigation have shown that using a UV based optical fibre sensor it is possible to detect both NO and NO2 independently and to a minimum level of 10s ppm in gaseous mixture flows. This means that the sensor can form the basis of a vehicle exhaust monitoring system for these gases. Initial recent measurements including SO2 in the flow have shown this causes little or no discernible effect on the absorption spectra of NO2. This may prove significant as existing electrochemical based NOx sensors suffer from not being able to separate NO and NO2 concentrations and can give unreliable
45
1st International Conference on Sensing Technology November 21-23, 2005 Palmerston North, New Zealand
European workshop on optical fibre sensors Proc. SPIE Vol. 5502. V.Weldon, J. O’Gorman, P. Phelan, J. Hegarty, T. Tanbun-Ek, “H2S and CO2 gas sensing using DFB laser diodes emitting at 1.57 um”, Sensors and Actuators B 29 1995 p 101-107 D.M. Sonnenfroh and M.G. Allen, “Observation of CO and CO2 absorption near 1.57 um with an external-cavity diode laser”, Applied Optics 1997 Vol. 36, 15 p 3298-3300 R.M. Mihalcea, D.S. Baer, R.K.Hanson, “Diode laser sensor for measurements of CO, CO2 and CH4 in combustion flows”, Applied Optics 1997 Vol. 36,33 p87458752. L.S. Rothmana, D. Jacquemarta, A. Barbeb, D.Chris Bennerc, M. Birkd, L.R. Browne, M.R. Carleerf, C. Chackerian, Jrg, K. Chancea, L.H. Couderth, V. Danai, V.M. Devic, J.-M. Flaudh, R.R. Gamachej, A. Goldmank, J.-M. Hartmannh, K.W. Jucksl, A.G. Makil, J.-Y. Mandini, S.T. Massien, J. Orphalh, A. Perrinh, C.P. Rinslando, M.A.H. Smitho, J. Tennysonp, R.N. Tolchenovp, R.A. Tothe, J. Vander Auweraf, P. Varanasiq, G. Wagnerd, “ The Hitran data base 2004 edition”, Journal of Quantitative Spectroscopy and Radiative Transfer 2005.
output in the presence of SO2 in the exhaust systems. [6]
Acknowledgement The authors would like to acknowledge the support of the EC for the FP6 project Opto-Emi-Sense (Contract number: FP6-PLT-506592) in providing funding for this work.
[7]
References
[8]
[2] [3] [4]
[5]
M.D. Marazeula, M.C. Moreno Bondi, G. Orellana, “Enhanced performance of a fibreoptic luminescence CO2 sensor using carbonic anhydrase”, Sensors and Actuators B 29 1995 p126-131. Otto S. Wolfbeis and Leonie J. Weis, “FibreOptic Flurosensor for oxygen and carbon dioxide”, Anal. Chem 1988 60 p2028-2030 J. Dakin and B. Culshaw, Optical Fibre Sensors Vol 1-4, Artech House Boston, 1988 to 1997. G. Stewart, W .Jin, B. Culshaw, “Prospects for fibre-optic evanescent field gas sensors using absorption in the near-infrared”, Sensors and Actuators B 38-39 1997 p42-47. U. Willer, C. Bohling, P. Geiser, W. Schade, “Infrared evanescent field fibre sensor for in-situ mapping of volcano gases”, Second
[9]
NO -attenuation, 1m Absorption length 4.5
NO 5000ppm
4 attenuation (Intensity air / gase
[1]
3.5 3 2.5 2 1.5 1 180
220
260
300
340
380
420
460
500
540
Lambda [nm]
Figure 6: Measured spectra of calibration Gas NO 5000ppm
46
580
1st International Conference on Sensing Technology November 21-23, 2005 Palmerston North, New Zealand
Absorption Due to NO2 3
2.5
Absorption (%)
2
1.5
1
0.5
0 0
20
40
60
80
100
120
140
PPM
Figure 7: Measured absorption at a wavelength of 390 nm due to varying NO2 concentration
47
160