synthesis of materials have provided ways to grow NCs and manipulate their size, shape, ... most of the magnetic ions hosted by the of Pb1-xMnxS NCs are in a ...
Chapter 4
Optical, Magnetic, and Structural Properties of Semiconductor and Semimagnetic Nanocrystals Ricardo Souza da Silva, Ernesto Soares de Freitas Neto and Noelio Oliveira Dantas Additional information is available at the end of the chapter http://dx.doi.org/10.5772/46037
1. Introduction Semiconductor and semimagnetic nanocrystals (NCs), grown in different host materials, have attracted considerable attention due to their unique properties which are caused by zero-dimensional quantum confinement effects. Several advances in controlled chemical synthesis of materials have provided ways to grow NCs and manipulate their size, shape, and composition using different methodologies [1-5]. The interesting properties of these nanoparticles can be explored in diverse technological applications, such as wavelength tunable lasers, light-emitting devices, solar cells, and spintronic devices among others [6-13]. A detailed and comprehensive understanding on the properties of these NCs should be achieved in order to target many of the possible technological applications.In this chapter, we will present our main results and discussions on the optical, magnetic, and structural properties of semiconductor and semimagnetic NCs that were successfully grown by the melting-nucleation approach or by the chemical precipitation method. Optical processes in PbS NCs were investigated by employing the following experimental techniques: optical absorption (OA), photoluminescence (PL) and atomic force microscopy (AFM). The OA and PL peaks of these PbS NC samples showed a separation of about 0.050.20 eV, confirming thus the large Stokes shift. A comprehensive understanding on this large Stokes shift was achieved by investigating the radiative and nonradiative processes in these nanoparticles [14]. We will report evidences to the induced migration of Mn2+ ions in Cd1-xMnxS NCs by selecting a specific thermal treatment to each NC sample. The characterization of these magnetic dots was investigated by the electronic paramagnetic resonance (EPR) technique. The comparison of experimental and simulation of EPR spectra confirms the incorporation of Mn2+ ions both in the core and at the dot surface regions. The thermal treatment to a magnetic sample, via selected annealing temperature and/or time, affects the fine and © 2012 da Silva et al., licensee InTech. This is an open access chapter distributed under the terms of the Creative Commons Attribution License (http://creativecommons.org/licenses/by/3.0), which permits unrestricted use, distribution, and reproduction in any medium, provided the original work is properly cited.
62 Nanocrystals – Synthesis, Characterization and Applications
hyperfine interaction constants which modifies the shape and the intensity of an EPR transition spectrum. The identification of these changes has allowed tracing the magnetic ion migration from core to surface regions of a dot as well as inferring on the local density of the magnetic impurity ions [15]. The properties of Pb1-xMnxS NCs embedded in a borosilicate glass matrix has been investigated by magnetic measurements. The data indicated that only a small fraction of the nominal Mn-doping was incorporated into the PbS NCs, in both 0.3% and 0.7% nominal doping ends. Moreover, low temperature magnetization and susceptibility data showed that most of the magnetic ions hosted by the of Pb1-xMnxS NCs are in a paramagnetic state[16, 25]. We also have employed the magnetic force microscopy (MFM) in order to study the magnetic moments of Mn-doped nanoparticles, namely: Cd1-xMnxS and Pb1-xMnxS NCs. In these measurements, the interaction between tip and NC magnetization induces the contrast observed in the MFM images. A dark area (light area) in this contrast is caused by attraction (repulsion) between tip and NC magnetization. Evidently, the magnetization in each NC is caused by the size-dependent sp-d exchange interactions, proving that Mn2+ ions are actually incorporated into the semimagnetic nanostructures. Therefore, all these results certainly demonstrate that MFM is a powerful technique that plays a very important role in order to investigate semimagnetic nanocrystals [4, 17]. Zn1-xMnxO NCs were successfully grown by the chemical precipitation method and their magnetic properties were effectively investigated by the EPR technique. Thus, we have confirmed the actual incorporation of Mn2+ ions into the hosting ZnO NCs, while the hexagonal wurtzite structure of these nanoparticles was preserved. The well known Mn2+ six hyperfine lines in the EPR spectra of the as-produced samples were clearly observed. In addition, as the Mn-concentration increases to a level of about 0.81% a broad EPR line is observed, thus confirming the onset of Mn-Mn exchange interaction [5]. The structural properties of these Zn1-xMnxO NCs were characterized by Raman spectroscopy and X-Ray Diffraction (XRD) measurements. The observed shift in the diffraction peaks toward lower angles, with increasing in the x-concentration, was attributed to incorporation of Mn2+ ions into the ZnO NCs. This analysis is strongly corroborated by results obtained by the Raman spectroscopy, where the data have also provided evidences of the replacement of zinc ions by manganese ions into the Zn1-xMnxO NCs. Besides the Raman features typical of the ZnO structure, the Zn1-xMnxO (x > 0) nanoparticles display an extra Raman peak at 659 cm-1. This finding is a strong evidence of the replacement of zinc ions by manganese ions [5, 18]. The results of this chapter confirm the high quality of the semiconductor and semimagnetic NCs that were successfully grown by the melting-nucleation approach or by the chemical precipitation method. The comprehensive discussions that were presented on the properties of nanoparticles certainly demonstrate the great potential of these systems for various technological applications. We believe that this chapter can motivate further investigations and applications of other systems containing NCs.
Optical, Magnetic, and Structural Properties of Semiconductor and Semimagnetic Nanocrystals 63
2. Synthesis of nanocrystals The development of nanocrystals (NCs) produced of controlled way for possible applications technologic, depends on the synthesis methodology adopted. We report the study of Pb1-xMnxS and Cd1-xMnxS NCs synthesized in borosilicate glass matrix template using the fusion method and Zn1-xMnxO NCs using the co-precipitation method.
2.1. Synthesis of Pb1-xMnxS nanocrystals Pb1-xMnxS NCs were produced by the fusion method in the glass matrix with the following nominal composition: 40SiO2•30Na2CO3•1Al2O3•25B2O3•4PbO (%mol), herein quoted as SNABP glass matrix. The nominal composition of the nanocomposite was achieved by adding 2S (%wt) plus xMn with respect the (1-x)Pb, with x = 0, 0.003 and 0.007. The samples were produced following two major preparation steps. In the first step the powder mixture was melted in an alumina crucible at 1200oC for 30 minutes, following a quick cooling of the crucible containing the melted mixture from 1200oC down to room-temperature. At the end of this step a first series of samples labeled SNABP: xMn were produced for further characterization. In the second step thermal annealing of the previously-melted glass matrix (SNABP: xMn samples) was carried out at 500oC for times different, with the purpose to enhance the diffusion of Pb2+, Mn2+, and S2- species within the hosting matrix. Due to the thermal annealing procedure Pb1-xMnxS NCs were formed within the glass template [7].
2.2. Synthesis of Cd1-xMnxS nanocrystals Cd1-xMnxS NCs were synthesized in a glass matrix (SNAB) with a nominal composition of 40SiO2 . 30Na2CO3 . 1Al2O3 . 29B2O3 (%mol) + 2[CdO + S] (%wt), and Mn-doping concentration (x) varying with respect to Cd-content from 0 to 10%. The first step of sample preparation consisted of melting powder mixtures in an alumina crucible at 1200oC for 30 minutes. Then, the crucible containing the melted mixture underwent quick cooling to room temperature. In the second step, thermal annealing of the previously melted glass matrix was carried out at 560oC for 02 and 20 hours in order to enhance the diffusion of Cd2+, Mn2+, and S2- species into the host matrix. As a result of the thermal annealing, CdS and Cd1-xMnxS (x>0) NCs were formed in the glass template, wich were denominated at two classes: i) SNAB: CdS NCs and ii) SNAB: Cd1-xMnxS NCs [7].
2.3. Synthesis of Zn1-xMnxO Nanocrystals Preparation of the Zn1-xMnxO NC samples is based on the transformation of the aqueous[Zn(NH3)4]2+ metal-complex in the presence of aqueous-Mn2+, sodium oleate and hydrazine sulfate at 80°C. The best chemical synthesis results were achieved by keeping the pH value of the reaction medium at 8.5 during the whole reaction process, which was adjusted by controlling the addition of 4 M sodium hydroxide aqueous solution. Briefly, a typical protocol used started by magnetically-stirring, at room-temperature and for ½-hour, 100 mL of 0.38 M zinc chlorite mixed with 100 mL of 1.6 M ammonia hydroxide in order to form the
64 Nanocrystals – Synthesis, Characterization and Applications
aqueous-[Zn(NH3)4]2+ complex. Then 1 mL of hydrazine sulfate and 0.08 g of sodium oleate were added into the previously-stirred solution. The obtained reaction medium was then heated at 80°C using water-bath in order to transform the aqueous-[Zn(NH3)4]2+ complex, while keeping the pH value fixed at 8.5. The chemical synthesis was carried out for 2 h, while ammonia was observed to be release out from the reaction medium as the chemical process proceeded. The resulting precipitates (Zn1-xMnxO; x≥0) were percolated and washed with distilled water and absolute ethanol for several times and further dried under at 500oC for 2h [5].
3. Optical properties of Nanocrystals The optical properties of PbS, Zn1-xMnxO and Cd1-xMnxS NCs, synthesized by methodology describe in section 2, were investigated by Optical Absorption (OA), and/or Photoluminescence (PL) spectroscopy techniques. The obtained results will be presented and discussed as follows.
3.1. Optical properties of PbS Nanocrystals 3.1.1. Optical Absorption and Photoluminescence Because of the large exciton Bohr radius (18 nm), PbS QD-doped glasses exhibit strong three-dimensional quantum-confinement effects at moderate nanocrystal size. This combined with small band gap energy (0.41 eV at room temperature) of PbS with different thermal annealing, which result in different average sizes of PbS nanocrystals [2,14]. Roomtemperature Photoluminescence and optical absorption spectra of PbS nanocrystals with different time annealing process are shown in Figure 1. The strong quantum confinement in these structures is clearly observed. The appearance of defined band peaks in both absorption and emission spectra demonstrates the high quality of our samples and relatively small size distribution of the PbS nanocrystals.
3.1.2. Size-dependent Stokes shift The dependence of the Stokes shift is closely linked to the size of the nanocrystals for schemes of strong quantum confinement the discrete levels of transition electron become more evident such that the difference between the position of peak absorption and emission increases with decreasing the size of the nanocrystals [14, 19]. With the absorption of a photon from of the valence band to the conduction band occurs the formation of electronhole pairs (exciton). The exciton, once formed after absorption, cannot decay to the top of the valence band by a direct dipole transition and hence is denominated of dark exciton [20]. In the process of deexcitation eventually takes place with the help of phonons, thus giving rise to red shifted photons, known with Stokes shift. The behavior of Stokes shift of PbS NCs of Figure 1 is represents in Figure 2. From the data presented is observed the decline in the Stokes shift with the increase of NCs size.
Optical, Magnetic, and Structural Properties of Semiconductor and Semimagnetic Nanocrystals 65
Energy (eV) 1.24
1.03
(a)
0.88
0.77 4,4
4.4 nm
4.1 nm
3.8 nm
Photoluminescence (a.u.)
Absorption (a. u.)
PbS NCs
1000
1200
1400
4,0
3,8
3,6
3,4
3.4 nm 800
(b)
4,2
Radius NCs (nm)
1.55
1600
o
500 C 2
Wavelength (nm)
3
4
5
6
7
8
Annealing Time (hours)
Figure 1. (a). Room-temperature optical absorption and photoluminescence of PbS NCs synthesized in SNABP glass matrix. (b) Behavior of average size of PbS NCs with annealing time at 500oC.
0,26
PbS NCs
0,24 0,22
Stokes Shift (eV)
0,20
(a)
0,18
Stokes(eV)
OA (eV)
PL (eV)
(a)
1.35
1.15
0.20
(b)
1.22
1.08
0.14
(c)
1.13
1.03
0.10
(d)
1.06
1.01
0.05
0,16 0,14
(b)
0,12 0,10
(c)
0,08 0,06 0,04
(d)
3,2 3,4 3,6 3,8 4,0 4,2 4,4 4,6 4,8 5,0 5,2
NCs size (nm)
Figure 2. Behavior of Stokes shift to of PbS NCs synthesized in glass matrix.
The Stokes shift is originated by process of radiative decay from electron-hole recombination and a nonradiative decay via trapped states involves electron-phonons. As
66 Nanocrystals – Synthesis, Characterization and Applications
the size of the nanocrystal increase, the surface to volume ratio decreases, and there is a reduction in the overlap of the electron and hole wave functions. This is coincident with a decreased wave function overlap with the nanocrystal surface, which leads to less surface trapping and the decrease of Stokes shift [14]. A schematic of levels energy involved the process of excitation and deexicitation is shows in Figure 3. The excitation occurs with the absorption of electrons of level 1Sh (fundamental state) to the excitation states 1Se (OA1) and 1Pe (OA2) and the deexcitation process is characterized by a nonradiative recombination of levels 1Se and 1Pe to the surface trapped states and a radiative recombination (PL) to the level 1Sh, clear observed in Figure 1(a) to PbS NCs.
1Pe 1Se
PL
OA1
OA2
∆Stokes Surface Trapped
1Sh 1Ph Figure 3. Model schematic used for explain the Stokes shift data difference between OA via radiative and nonradiative emission processes.
3.2. Optical properties of Zn1-xMnxO nanocrystals Optical absorption spectra provide strong evidences of the Mn2+ ions incorporation into the Zn1-xMnxO NCs different for the observed in samples with ZnO NCs. With the introduction of impurities magnetic in semiconductor NCs the optical properties are completely modify due the exchange interactions (sp-d) between electronic subsystem of NCs and electrons originated in the partially filled of the Mn2+ ions. This exchange interactions causes the blueshift of band gap observed in Zn1-xMnxO NCs in relationship to ZnO NCs that is proportional with the increase of x as show in Figure 4, for example, to x = 0 and 0.0081, being observed the blue-shift of band-gap of 3.33 eV (372 nm) to 3.41 eV (363 nm), respectively. This due the band gap of Zn1-xMnxO NCs semiconductor is between the ranges of 3.29 eV (gap ZnO bulk) at 4.2 eV (gap MnO bulk). The appearances of well-defined subband peaks in absorption spectra demonstrate the high quality of the synthesized samples and the relatively small size distribution of the NCs. Using this information with the energy of gap obtained by optical absorption spectra, the NCs size were determined by the effective mass model approximation of equation 01 [21]:
E Ebulk
2 2 1 1 2m m 2 eR e o mh mo
(1)
Optical, Magnetic, and Structural Properties of Semiconductor and Semimagnetic Nanocrystals 67
Where E is band gap of the nanocrystals, Ebulk is the band gap of the bulk material, R is the particle radius, me and mh are effective mass of the electrons and holes, respectively, and mo is the free electron mass. With the effective masses of electrons (me = 0.28 mo) and holes (mh = 0.59 mo), we obtain the diameter of 4.1 nm for the as-prepared Zn0.9919Mn0.0081 NCs.
Figure 4. Room-temperature optical absorption spectra of Zn1-xMnxO NCs for x = 0, 0.001, 0.0008 and 0.0081.
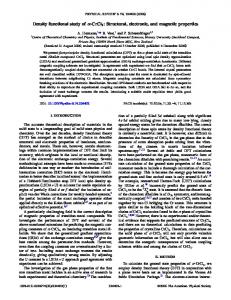
3.3. Optical properties of Cd1-xMnxS nanocrystals Figure 5 shows room-temperature OA spectra of the SNAB : Cd1−xMnxS set of samples with nominal concentrations x = 0, 0.001, 0.050, and 0.100. The quantum confinement can be clearly observed, and there are well-defined intersubband transition peaks in all OA spectra, which demonstrates the fairly good quality and narrow dot size distribution (~ 6%) in the samples. For a fixed doping concentration, an effective band gap reduction is observed, with the quantum confinement regime decreasing for increasing nanocrystal size, R. Analyzing these OA spectra and using a quantum confinement model based on effective-mass approximation, it is possible to estimate the average radius R of these dot samples using the expression [28] Econf = Eg + ħ2 π2/2μR2 − 1.8(e2/εR), where Eg is the energy band gap of the material (bulk), μ (ε) is the heavy-hole exciton reduced effective mass (dielectric constant), e is the elementary charge, and the last term is the electron–hole effective Coulomb interaction.
68 Nanocrystals – Synthesis, Characterization and Applications
Figure 5. Panel (a): Room-temperature OA spectra of Cd1−xMnxS NCs embedded in SNAB glass matrix with concentration x = 0, 0.001, 0.050, and 0.100. The well-defined sub-band peaks demonstrate quantum confinement regimes and the relatively narrow dot size distributions. The energy shift of the OA peaks indicates the Mn incorporation in the dots.
The estimated average radii were R = 2.14 and R = 2.234 nm, for the samples annealed for 2 and 20 h, respectively. Under low magnetic impurity density and annealing temperature conditions, the dot size remained almost unchanged during Mn-ion incorporation induced by thermal treatment. In Fig. 3, we show the blue shift in the OA peaks, a quantity proportional to the concentration of magnetic ions. This shift changes from 3.09 eV in pure CdS (x = 0) dots to 3.19 eV in doped SNAB : Cd 0.900Mn0.100S samples treated at 560 °C for 2 h. For samples treated for 20 h, the values are 3.05 eV for x = 0 (undoped) and 3.14 eV for x = 0.100 (doped) dots.
4. Magnetic properties of DMS nanocrystals The magnetic properties of DMS NCs are influenced by exchange interactions sp-d between the electronic subsystems of magnetic ions with the NCs, changing the configuration of confined electronic states. The Zn1-xMnxO and Cd1-xMnxS NCs were investigation by Electron Paramagnetic Resonance, Cd1-xMnxS and Pb1-xMnxS NCs investigation by Microscopy force Atomic (MFM) and Pb1-xMnxS NCs investigated by Magnetization measurements.
Optical, Magnetic, and Structural Properties of Semiconductor and Semimagnetic Nanocrystals 69
4.1. Evidencing the Zn1-xMnxO nanocrystal growth by Electron Paramagnetic Resonance The EPR spectra of the Zn1-xMnxO NC samples with x = 0, 0.0001, 0.0008 and 0.0081 are shown in Figure 6(a). We found ZnO NCs sample (x = 0) presenting a sharp EPR signal with g = 1.9568. However, the Zn1-xMnxO NC samples with low x-values exhibits a well-resolved EPR sextet in addition to some fine structure. They are stemmed from the hyperfine interaction between electron (S= 5/2) and nuclear (I = 5/2) spins of the incorporated manganese ions, which are claimed to be located at different positions within the nanocrystal. For instance, the x = 0.0001 sample displays two sets of EPR sextets. Among them, the six well-defined EPR lines with hyperfine interaction splitting of 7.8 mT is assigned to isolated Mn2+-ions substitutionaly incorporated into the Zn1-xMnxO-core nanocrystal. While, the second set of EPR sextet structure, with hyperfine splitting of 8.0 mT, is due to Mn2+-ions incorporated into the Zn1-xMnxO-shell nanocrystal, at crystallographically-distorted sites near the NCs surface [27]. For this sample the smallest average diameter among the doped samples presents the strongest surface effect. Therefore, in comparison to the undistorted Mn-site (core-sites) the x = 0.0001 Zn1-xMnxO NCs sample holds enough distorted Mn-sites (shell-sites) to be probed by EPR in spite of low doping concentration. In addition, the sensitivity of the EPR technique to prove both core-like as well as shell-like Mn-ions with concentration as low as x = 0.0001 is a strong indication of the monodispersity in size. As the Mn-ion concentration increases, the number of EPR lines also increases, and the identified hyperfine structure is now superimposed to a broad EPR background line, as shown in EPR spectrum of the x = 0.0008 NCs sample. The underlying physics can be understood in the following way. As the Mn-ion concentration increases, the amount of Mn-ions in shell-sites increases. Hence, the replacement of Zn-ion by Mn-ions in various crystal sites with different distortion of crystal field occurs, resulting in a multi-line hyperfine structure. Furthermore, the increased concentration of manganese in the shell of nanocrystals may lead to the formation of Mn ion cluster, which inducing a strong Mn-Mn interaction. Hence broad EPR background line emerges. As the manganese concentration goes over x = 0.0081, however, the multi-line hyperfine structure collapses and the EPR spectra are replaced by a symmetric, broad single line due to enhanced Mn-Mn interaction. In order to confirm this analysis we have performed EPR spectral simulation of Mn-doped ZnO NC samples using time dependent perturbation theory [27], in which the spin ˆ H ˆ . In the spin-Hamiltonian H Sˆ g B is the Hamiltonian is described by H H z e e 0 z Zeeman term, where e, ge, and B are the Bohr magneton, the Lande factor and the applied magnetic field, respectively. The second term of the spin-Hamiltonian is Hˆ 0 D Sz2 S S 1 3 E Sx2 Sy2 ASˆ Iˆ , where the first two terms describe the zero magnetic field fine-structure splitting due to spin-spin interaction of electrons, which is nonzero only in environments with symmetries lower than cubic. The third term ( ASˆ Iˆ ) is stemmed from the hyperfine interaction between electron and nuclear spins, leading to the observed six-line pattern. Since the interaction constants A, D and E strongly depend upon the local crystal field characteristics in which the Mn2+-ion is located, the EPR spectrum
70 Nanocrystals – Synthesis, Characterization and Applications
varies when the local Mn2+-ion crystal symmetry changes from Zn1-xMnxO-core to Zn1xMnxO-shell. According to the pattern of the EPR spectra we found from our data, spectral simulation were performed by following a three step procedure, as illustrated in Figure 5 (a). Firstly, we computed the hyperfine structure. Second, a broad background resonance feature was simulated. Finally, we summed over these two spectra to end up with the EPR spectrum of the Zn1-xMnxO NCs sample with x = 0.0008. Figure 6 (b) displays the calculated spectra for x = 0.0001, 0.0008 and 0.0081. Excellent quantitative agreement between the simulated and the experimental spectra were achieved for instance in the case of the x = 0.0008 NCs (inset) sample using g = 2.0033, A = 7.8mT D = 6.1 mT, E = 0.5 mT, and 0.8 mT linewidth for the hyperfine structure simulation and g = 2.0033 and 60 mT linewidth for the broad background resonance calculation. Therefore, we could conclude that the EPR hyperfine six-lines are due to m S = 1 and mI = 0 transitions, where mS (mI) stands for the projection of the spin S (I), the broad background is originated from the exchange narrowing due to the strong Mn-Mn interaction. Hence, the EPR simulations strongly support the picture that Mn-ions are incorporated into the hosting ZnO nanocrystals.
Zn1-xMnxO NCs
x=0.0001 x=0.0008
x=0.0081
x=0.0001
Hyperfine
Mn-Mn
Hyperfine + Mn-Mn 280 320 360 400 440 Magnetic Field (mT)
x=0.0008
x=0.0081
a)
Experimental
280
x = 0.0008 EPR Intensity (a. u.)
x=0
EPR Intensity (a. u.)
EPR Intensity (a.u.)
Zn1-xMnxO NCs
320
360
400
Magnetic Field (mT)
440
b) 280
Simulation
320
360
400
440
Magnetic Field (mT)
Figure 6. (a). Room-temperature X-band EPR spectra of Zn1-xMnxO nanocrystals at different x values and (b) Simulated EPR spectra of Zn1-xMnxO nanocrystals for different x values. In inset illustration of processes used for EPR spectra simulation of the Zn1-xMnxO nanocrystal (x = 0.0008).
4.2. Confirming the migration process of Mn2+ ions in Cd1-xMnxS nanocrystals by Electron Paramagnetic Resonance Theoretical model for explain the incorporation of magnetic impurities in nanocrystals are related in the literature [22-24], such as the “self-purification” mechanisms that are
Optical, Magnetic, and Structural Properties of Semiconductor and Semimagnetic Nanocrystals 71
explained through energetic arguments. These mechanisms show that the formation energy of magnectic impurities increases when the NCs size decreases. Moreover, the binding energy of the impurities in the crystalline faces is highly dependent on the semiconductor material, such as the crystal structure and NCs shape [23]. The energy required to replace a Cd2+ ion by an Mn2+ ion, called the formation energy, is greater for smaller Cd1-xMnxS NCs [22]. Thus, the present Mn2+ ions in smaller Cd1-xMnxS NCs are less stable, promoting the difusion of some of these impurities to regions closer to the dot surface, i.e., to the site SII. This ability of the Mn2+ ion to diffuse through the nanocrystal is quite reasonable because the ionic radius of impurity (83 pm) is smaller than the ionic radius of the Cd2+ ion (95 pm). This mechanism, known as “self-purification” [24], is an intrinsic property of impurities (or defects) in semiconductor related to NCs sizedependent energetic arguments and explains the predominance of the signal SII on the SI in the EPR spectra shown in the Figure 7. The EPR spectra shown in Figure 7(a) for selected SNAB : Cd1−xMnxS samples with x = 0.001, 0.050, and 0.100 display well-resolved transitions between a sixplet sublevel structure inserted into a broader horizontal S-like shaped EPR structure typical for free-like electron states with spin S = 1/2, ±1/2. These six sublevels are associated with the magnetic quantum numbers MS = ±5/2 ,± 3/2, ± 1/2 that occur in fine exchange interaction induced transitions when Mn ions are present in a sample. Another much weaker interacting sixplet sublevel structure occurs because the hyperfine interaction coupling between the spin of localized electrons (S = 1/2) with nuclear spin (I = 5/2) of the incorporated Mn-ions in the doped samples. Among them, are six fairly welldefined EPR lines with fine interaction splitting described by the simulation signal SI, and assigned to dilute concentration of Mn2+ ions found in substitutional Cd places inside the CdS nanocrystal cell. However, the second EPR sixplet structure set described by the simulation signal SII is due to Mn ions located at crystallographically highly distorted sites near the dot surface. In order to confirm this analysis we have performed EPR spectral simulation of Mn-doped CdS samples using time-dependent perturbation theory in which the spin Hamiltonian is given by H HZ H0 , where H Z eS ge B describes the Zeeman interaction and e , ge , and B represent the Bohr magneton, the Landé g-factor, and the applied magnetic field, respectively. The second term, H 0 D Sz2 S S 1 3 E Sx2 Sy2 ASˆ Iˆ , includes the zero magnetic field fine interaction (terms proportional to coupling constants D and E) between the electron spin and the crystal field.
This contribution only induces non-zero fine structure splitting in crystalline environments with symmetries lower than cubic. Finally, the term ASˆ Iˆ represents the hyperfine interaction between localized electrons and nuclear spins in the Mn ions and where each electron transition splits into six additional levels characterized by the nuclear magnetic quantum numbers (MI = ±5/2,±3/2,±1/2), producing, in principle, a total of 36 transitions. However, selection rules limit the number of allowed transitions, and the broader and stronger features observed in the EPR spectra are due to lines associated to the dipoleallowed ΔMS = ±1 transitions with ΔMI = 0. Since the interaction constants A, D, and E
72 Nanocrystals – Synthesis, Characterization and Applications
Figure 7. Panel (a): Room-temperature EPR spectra of selected Cd1−xMnxS NCs embedded in the SNAB glass matrix with Mn concentration x = 0.001, 0.050, 0.100. Panel (b) shows a zoom on two of the sublevel peaks, between 835 and 850 mT, in order to observe the intensity differences, marked as III and II. Noted the change of the ratio between EPR intensities when Mn ions are placed at the dot interface (III) or inside the core cell (II), in samples with concentrations x = 0.050 and x = 0.100. This ratio change indicates the interdiffusion of magnetic ions due to thermal treatment.
strongly depend on the local crystal field characteristics near the Mn2+ ion location, the EPR spectrum will be changed when substitutional Mn2+ ions move from the Cd1−xMnxS dot core (signal SI) to the dot surface (signal SII) region. On the other hand, any isolated Mn ion that is dispersed inside the glass matrix cannot be identified in the EPR spectra due to the absence of a well-defined crystal field of this amorphous material (glass). In addition, the Mn–Mn interactions would also be intensified if the formation of Mn clusters occurred in the glass environment. However, we consider that this later effect may be neglected, since the formation of Mn clusters is highly unlike due to the small amount of incorporated Mn ions in these samples. The other enhancement on the EPR signal intensity, as observed in Figure 7(a), can be associated to the increased concentration of Mn2+ ions. The larger the Mn density is, in samples subjected to thermal treatment for 20 h and also seen in the AFM images, the stronger is the EPR intensity. In addition, the EPR intensity can be strengthened due to migration of a fraction of magnetic ions from the glass matrix to the surface of the NCs, an effect which also increases the intensity of the broader background EPR peak due to Mn–Mn interaction. The zoom in two of the sublevel exchange peaks, between 835 and 850 mT, displayed in Figure 7(b) shows the enhancement of all EPR lines for longer annealing times. However,
Optical, Magnetic, and Structural Properties of Semiconductor and Semimagnetic Nanocrystals 73
the EPR intensity for surface Mn ions III increases whereas for the substitutional ions II decreases in both samples with nominal concentrations x = 0.050 and x = 0.100, when the thermal treatment increases from 2 to 20 h. The change in the ratio between intensities, III / II, confirms the migration of a fraction of Mn ions incorporated in the dot core to the surface region.
Figure 8. Room-temperature EPR spectrum in Cd0.900Mn0.100S NCs measured in the K band. The simulated EPR transitions were obtained by the combination of a stronger spectrum associated to Mn replacing the Cd ions inside the wurtzite cell (signal SI) and a weaker spectrum due to ions located at or near the dot surface region (signal SII). The Hamiltonian model describing the fine and hyperfine magnetic interactions contributing to dipole transitions between the eigenvalues is discussed in the text.
The energy required to replace Cd2+ by Mn2+ in the crystal, usually referred to as the ‘‘formation energy’’, is larger for small- size CdS NCs [9]. Therefore, Mn2+ ions in the less stable places inside Cd1−xMnxS dots are moved to interface region in a process of energy minimization that promotes the interdiffusion of a fraction of impurities from the core (signal SI) to larger binding energy regions near [24] to the surface and, in this location, the magnetic ions generate the signal SII. The ability of Mn2+ ions to migrate through the NC is quite reasonable because the ionic radius of this magnetic impurity (83 pm) is smaller than the ionic radius of the Cd2+ ion (95 pm). This mechanism seems to be an intrinsic general property of impurities (or defects) in semiconductor NCs [24], and the shape and the crystal structure of a NC determine which surface is more favorable for impurity binding; these facets are the (0001) crystalline planes in the CdS wurtzite structure [9]. Here, the larger ratio III/II between intensities of EPR peaks in samples with different annealing times, as shown in the Figure 7(b), corroborates this idea of controlled migration process.
74 Nanocrystals – Synthesis, Characterization and Applications
The simulated signals for the EPR transitions in the Cd0.900Mn0.100 S sample, shown in Figure 8, confirm the presence of Mn2+ ions in two distinct sites: incorporation occurring in the core (signal SI), and near the surface (signal SII). The hyperfine interaction constants used to simulate these spectra were AI = 8.1 mT and AII = 8.4 mT for a magnetic system with spin S = 5/2, nuclear spin I = 5/2, and g-factor ge = 2.005. The fine structure constants were D = 40 mT and E = 5 mT. We believe that these results have shown unambiguously that proper use of annealing temperature with different times may produce controlled diffusion of Mn2+ ions in magnetic dots. These findings are strongly supported by the fairly good agreement between simulated and experimental EPR resonant transitions.
4.3. Investigating the Pb1-xMnxS nanocrystals by susceptibility and magnetization measurements Figure 9 shows the temperature dependence of the inverse of the real part of the magnetic susceptibility (1/χ) of Pb1-xMnxS NCs growth in borosilicate glass with annealing at 500oC at 10hours, for x = 0.003 and 0.007, recorded at 100 Oe. The susceptibility data presented in Figure 9 follow the Curie-Weiss law, T C T , where θ is the Curie-Weiss temperature [25, 26]. The fitted value found for the parameter C in (T ) allowed estimation of the isolated Mn2+ ion content incorporated in the Pb1-xMnxS NCs embedded in glass matrix using: x mA mB S S 1 g B 2 N A
3kBC mA mM
(2)
where mA, mB and mM represent atomic mass for the cation (Pb), anion (S) and magnetically doped (Mn), respectively. S represents the total spin of the Mn2+ ion, kB is the Boltzmann constant, and NA is Avogadro’s number. In this calculation g = 2 is assumed for the Mn2+ ion.
350
x = 0.003
300
250
250
(Oe.g/emu)
300
200
-1
150
-1
(Oe.g/emu)
350
x = 0.007
200 150 100
100
(a)
50
(b)
50 0
0 0
50
100
150
200
Temperature (K)
250
300
0
50
100
150
200
250
300
Temperature (K)
Figure 9. The temperature dependence on the inverse of susceptibility, recorded at 100 Oe, shows low temperature paramagnetic character for Pb1-xMnxS NCs embedded in borosilicate glass matrix.
Optical, Magnetic, and Structural Properties of Semiconductor and Semimagnetic Nanocrystals 75
Using the equation 02, estimates the concentration of Mn ions incorporated into the crystal lattice of the nanocrystals. For the nominal concentrations of x = 0.003 and x = 0.007 were estimated real concentrations of x = 0.003 and x = 0006 respectively, resulting in the formation of Pb0.997Mn0.003S and Pb0.994Mn0.006S NCs. Field-cooled magnetization curves of Pb0.997Mn0.003S and Pb0.994Mn0.006S NCs growth in borosilicate glass matrix, recorded with an external applied field of 1 KOe and over a wide range of temperatures, are shown in Figures 9(a) and (b), respectively. Each inset in these figures displays the T=1.28 K field dependence of the magnetization.
6 Pb0.997Mn0.003 S NCs
Pb
4
(a)
5
6
5
0.994
Mn
0.006
4
3
0
T ~1,28 K
-1
2
0
20000
40000
60000
H (Oe) 1
M (emu/g)
1
M x 10-3 [emu/g]
M (emu/g)
M x 10-3 [emu/g]
3
4
8 6
(b)
5
2
S NCs
4
3
2 0 -2 -4
T ~ 1,28 K
-6
2
-20000
0
20000 40000 60000
H (Oe)
1
H = 1KOe
H = 1KOe 0
0
0
50
100
150
200
Temperature (K)
250
300
0
50
100
150
200
250
300
Temperature (K)
Figure 10. Magnetization as a function of temperature for the Pb0.997Mn0.003S and Pb0.994Mn0.006S NCs embedded in borosilicate glass matrix. Field dependence of magnetization for each sample is shown in the insets.
The magnetic data presented in Figure 9 including the corresponding insets, reveal the dominant paramagnetic behavior of the dots.
4.4. Magnetic force microscopy of semimagnetic nanoparticles: Pb1-xMnxS nanocrystals Figure 10 presents the AFM/MFM images for the Pb0.993Mn0.007S NCs samples subjected to the thermal annealing for 10 h, where we confirmed the high density of the nanocrystals with quantum confinement properties as well as bulk-like properties. In figure 10 (a), the AFM image is also influenced by the sample topography, while in figure 10(b), in the MFM images there are only the magnetic interactions, confirming the formation of semimagnetic Pb0.993Mn0.007S NCs, with average NCs-size of approximately 6.0 nm. In an attractive configuration, the NCs have magnetization in a parallel direction to the tip magnetization, resulting in dark areas of the MFM image. However, in a repulsive configuration, the NCs have magnetization in an antiparallel direction to the tip magnetization, resulting in bright areas of the MFM image. Therefore, the formation of the dark and bright fields related to a single spin domain in the Pb0.993Mn0.007S NCs is shown by the clear contrast in these MFM images.
76 Nanocrystals – Synthesis, Characterization and Applications
Figure 11. AFM/MFM of Pb0.993Mn0.007S NCs growth in borosilicate glass matrix.
5. Structural properties of Zn1-xMnxO nanocrystals The structural properties of Zn1-xMnxO nanocrystals were investigated by X-ray diffraction and Raman spectroscopy techniques.
5.1. Characterizing of Zn1-xMnxO nanocrystals by X-ray diffraction The XRD patterns of the Zn1-xMnxO (x ≥ 0) NCs samples for x = 0, x = 0.0001, x = 0.0008 and x = 0.0081 are shown in Figure 11. It is noted that the typical bulk-ZnO hexagonal wurtzite crystal structure is preserved in the as-precipitated Zn1-xMnxO (x ≥ 0) NCs samples whit treatment thermal of 500oC by 2 hours [27]. Except for the ZnO with treatment thermal the 60oC by 12 hours that is present in amorphous phase. Nevertheless, the characteristic XRD peaks shift towards lower diffraction angle values as the Mn-ion concentration in the hosting ZnO structure increases, as shown in inset for (002) peak, clearly indicating an increase of the lattice constant. Using the Cohen’s method we performed the estimation of the c-axis lattice constant from the following three selected XRD peaks: (100), (002), and (101). One found that the average c-axis lattice crystal constant of the x = 0, 0.0001, 0.0008 and 0.0081 Zn1-xMnxO NC samples were 5.207, 5.208, 5.226 and 5.231 Å, respectively. The monotonic increase observed in the lattice crystal constant is attributed to the replacement of the Zn2+-ion, with smaller ionic radius (0.74 Å in the hexagonal wurtzite ZnO crystal structure), by Mn2+-ion with larger ionic radius (0.83 Å). These XRD findings provide evidences that the as-produced samples are high-quality and single-phased Zn1-xMnxO crystals in the nanoscale regime.
Optical, Magnetic, and Structural Properties of Semiconductor and Semimagnetic Nanocrystals 77
Figure 12. X-ray diffraction of ZnO bulk and Zn1-xMnxO nanocrystal samples with x = 0, 0.0008 and 0.0081. In inset shift of the (002) Zn1-xMnxO nanocrystal XRD peak as a function of Mn-ion concentration (x).
5.2. Characterizing of Zn1-xMnxO nanocrystals by Raman spectroscopy Figure 12 shows the Raman spectra of ZnO bulk and Zn1-xMnxO NCs for x = 0, 0.0008 and 0.0081. The wurtzite ZnO structure belongs to the space group C64v with two formula units per primitive cell. Therefore, group theory predicts that the zone-center optical phonons are described by opt A1 2 B1 E1 2 E2 [5]. The A1 and E1 modes represent Raman and infrared active polar phonons, showing frequencies for transverse-optical (TO) and longitudinal-optical (LO) modes. The E2 mode is non-polar and is Raman active in two frequencies; the E2 (high) associated to the oxygen anions and the E2 (low) associated to the Zn cations in the lattice. Finally, the B1 mode is Raman inactive. The Raman peak centered at 334 cm-1 is described through a multi-phonon process associated to three different modes; the dominant A1 mode plus a weak E2 component and an even weaker E1 component. The literature describes the frequency of this mode as the difference between the E2 (high) and E2 (low) modes. The A1 (TO), E1 (TO), A1 (LO) and E1 (LO) modes were observed at 382, 410, 541 and 586 cm-1, respectively. The Raman peak observed at 439 cm-1 represents the E2 (high) mode associated to the oxygen anions. The Raman peaks of Zn1-xMnxO NCs show a shift to low frequencies and the peaks are asymmetry in relation to the ZnO semiconductor. With the incorporation of Mn2+ ions is observed a peak was observed at about 659 cm-1 becoming more intense with increasing of Mn-concentration in Zn1-xMnxO NCs. The 659 cm-1 peak is associated the two additional modes A1 ( LO) E2 low originated from the precipitation
78 Nanocrystals – Synthesis, Characterization and Applications
phase of ZnMn2O4 as observed for x = 0.0008 and 0.0081 in the samples of Zn1-xMnxO NCs. This finding is a strong support to the picture that Zn-ions in the ZnO crystal structure are replaced by Mn-ions during the course of the chemical precipitation process.
Figure 13. Room-temperature Raman spectra of ZnO bulk and Zn1-xMnxO NCs for x = 0, 0.0008 and 0.0081.
6. Conclusions In conclusions, we report the successfully synthesis of semiconductors and semimagnetic nanocrystals by different methodologies. PbS, Pb1-xMnxS and Cd1-xMnxS NCs were growth in borosilicate glass by fusion method and Zn1-xMnxO NCs were synthesized by co-precipitation method. The investigation of semiconductor and semimagnetic NCs provided by experimental techniques of Optical Absorption, Photoluminescence, Electron Paramagnetic Resonance, Magnetic Force Microscopy, X-Ray Diffraction, and Raman spectroscopy, have revealed the control of optical, magnetic and structural properties and the high-quality of NCs synthesized by different methodologies. We believe that this chapter can motivate inspire further investigation of these systems in a search for possible device applications.
Author details Ricardo Souza da Silva Instituto de Ciências Exatas e Naturais e Educação (ICENE), Departamento de Física, Universidade Federal do Triângulo Mineiro, Uberaba, Minas Gerais, Brazil
Optical, Magnetic, and Structural Properties of Semiconductor and Semimagnetic Nanocrystals 79
Ernesto Soares de Freitas Neto and Noelio Oliveira Dantas Laboratório de Novos Materiais Isolantes e Semicondutores (LNMIS), Instituto de Física, Universidade Federal de Uberlândia, Uberlândia, Minas Gerais, Brazil
Acknowledgement The authors gratefully acknowledge the financial support from the Brazilian agencies: MCT/CNPq, Capes, Fapemig and FUNEPU. We are also grateful to our collaborators: Augusto Miguel Alcalde ( A. M. Alcalde), Eliane da Costa Vilela (E. C. Vilela), Felipe Chen Abrego (F. Chen), Fernando Pelegrini (F. Pelegrini), Gilmar Eugênio Marques (G. E. Marques), Henry Socrates Lavalle Sullasi (H. S. L. Sullasi), Jales Franco Ribeiro da Cunha (J. F. R. Cunha), Leonardo damigo (L. Damigo), Kely Lopes Caiado Miranda (K. L. Miranda), Marcelo de Assumpção Pereira da Silva (M. A. Pereira-da-Silva), Miguel Alexandre Novak (M. A. Novak), Patrícia Pommé Confessori Sartoratto (P. P. C. Sartoratto), Paulo César de Morais (P. C. Morais), Qu Fanyao (Qu Fanyao) and Victor Lopez Richard (V. Lopez-Richard).
7. References [1] Norris D. J, Efros A. L, Erwin S. C (2008) Doped Nanocrystals. Science 319: 1776-1779. [2] Dantas N. O, Qu Fanyao. Silva R.S, Morais P. C (2002) Anti-Stokes Photoluminescence in Quantum Dots. Jour. Of Phys. Chem. B. 106: 7453-7457. [3] Silva R. S, Morais P. C, Qu fanyai, Alcalde A. M, Dantas N. O, Sullasi H. S (2007) Synthesis process controlled magnetic properties of Pb1-xMnxS nanocrystals. App. Phy. Lett.. 90: 253114-1-253114-3. [4] Neto E. S. F, Dantas N. O, Neto N. M. B, Guedes I, Chen F (2011) Control of luminescence emitted by Cd1-xMnxS nanocrystals in a glass matrix: concentration and thermal annealing. Nanotechnology 22: 105709. [5] Dantas N. O, Damigo L, Qu Fanyao, Qu Fanyao, Cunha J. F. R, Silva R. S, Miranda K. L, Vilela E. C, Sartoratto P. P. C, Morais P. C (2008) Raman investigation of ZnO and Zn1xMnxO nanocrystals synthesized by precipitation method. J. Non-Cryst. Solids 354: 4827-4829. [6] Gaponenko, S. V (1998). Optical Properties of Semiconductor Nanocrystals, Cambridge University Press. 260 p. [7] Dantas N. O, Neto E. S. F, Silva R.S (2010) Diluted Magnetic semiconductors in Glass matrix. In: Masuda Y. Nanocrystals. Sciyo: InTech. pp. 143-168. [8] Gur I, Fromer N. A, Geier M. L., Alivisatos A. P (2005) Air-stable all-inorganic nanocrystal solar cells processed from solution. Science 310: 462-465. [9] Erwin S. C, Zu L, Haftel M. I,. Efros A. L, Kennedy T. ., Norris D. J (2005) Doping semiconductor nanocrystals. Nature: 436, 91-94. [10] Timmerman D,Valenta J, Dohnalová K, de Boer1, W. D. A. M, Gregorkiewicz T (2011) Step-like enhancement of luminescence quantum yield of silicon nanocrystals. Nature Nanotechnology 6: 710-713.Volume: [11] Vach H (2011) Ultrastable Silicon Nanocrystals due to Electron Delocalization. Nano Lett. 11: 5477–5481. [12] Furdyna, J. K. (1988). Diluted magnetic semiconductors. J. Appl. Phys. 64: R29 –R64.
80 Nanocrystals – Synthesis, Characterization and Applications
[13] Yu J. H, Liu X, Kweon K. E, Joo J, Park J, Ko K. –T, Lee D. W, Shen S, Tivakornsasithorn K, Son J. S, Park J. –H, Kim Y. –W, Hwang G. S, Dobrowolska M, Furdyna J. K, Hyeon T (2010) Giant Zeeman splitting in nucleation-controlled doped CdSe:Mn2+ quantum nanoribbons. Nature Materials 9: 47-53. [14] Dantas N. O, de Paula P. M. N, Silva R. S, López-Richard V, Marques G. E (2011) Radiative versus nonradiative optical processes in PbS nanocrystals. J. Appl. Phys. 109: 024308-1 - 024308-4. [15] Dantas N. O, Neto E.S.F, Silva R. S, Chen F, Pereira-da-Silva M. A, López-Richard V, Marques G. E (2012) The migration of Mn2+ ions in Cd1-xMnxS nanocrystals: thermal annealing control. Solid State Communications 5: 337-340. [16] Silva R.S, Morais P. C, Mosiniewicz-Szablewska E, Cuevas R. F, Campoy J. C. P, Pelegrini F, Qu Fanyao, Dantas N. O (2008) Synthesis and Magnetic Characterization of Pb1-xMnxS Nanocrystals in Glass Matrix. J. Phys. D: Appl. Phys. 41: 165005-1 - 1650055. [17] Dantas N. O, Pelegrini F,Novak M. A, Morais P.C, Marques G. E, Silva R.S (2012) Control of magnetic behavior by Pb1-xMnxS nanocrystals in a glass matrix. J. of Appl. Phys 111: 106206-1 – 106206-5. [18] Dantas N. O, Damigo L, Qu Fanyao, Silva R. S, Sartoratto P. P. C, Miranda K. L, Vilela E. C, Pelegrini F, Morais P. C. (2008) Structural and magnetic properties of ZnO and Zn1xMnxO nanocrystals J. Non-Cryst. Solids 354: 4727 – 4729. [19] Zhang J, Jiang X (2008) Confinement-Dependent Below-Gap State in PbS Quantum Dot Films Probed by Continuous-Wave Photoinduced Absorption. J. Phys. Chem. B 112: 9557-9560. [20] Bagga A, Chattopadhyay P K, Ghosh S (2006) Origin of Stokes shift in InAs and CdSe quantum dots: Exchange splitting of excitonic states. Phys. Rev. B 74: 035341-1 - 035341-7. [21] Brus, L. E (1983) A Simple-Model For the Ionization-Potential, Electron-Affinity, and Aqueous Redox Potentials of Small Semiconductor Crystallites. J. of Chem. Phys. 79: 5566-5571. [22] Dantas N. O, Neto E.S.F, Silva R. S, Chen F, Pereira-da-Silva M. A, López-Richard V, Marques G. E (2012) The migration of Mn2+ ions in Cd1-xMnxS nanocrystals: thermal annealing control. Solid State Communications 5: 337-340. [23] Norris D. J, Efros A. L, Erwin, S. C (2008) Doped Nanocrystals. Science 319: 1776-1779. [24] Dalpian G. M, Chelikowsky J. R (2006) Self-Purification in Semiconductor Nanocrystals. Phys. Rev. Lett. 96, 226802-1 - 226802-4. [25] Dantas N. O, Pelegrini F,Novak M. A, Morais P.C, Marques G. E, Silva R.S (2012) Control of magnetic behavior by Pb1-xMnxS nanocrystals in a glass matrix. J. of Appl. Phys 111: 106206-1 – 106206-5. [26] Górska, M, Anderson, J. R (1988) Magnetic susceptibility and exchange in IV-VI compound diluted magnetic semiconductors. Phys. Rev. B 38: 9120-9126. [27] Dantas N. O, Damigo L, Qu Fanyao, Silva R. S, Sartoratto P. P. C, Miranda K. L, Vilela E. C, Pelegrini F, Morais P. C. (2008) Structural and magnetic properties of ZnO and Zn1xMnxO nanocrystals. J. Non-Cryst. Solids 354: 4727 – 4729. [28] Brus L. E. (1984) Electron–electron and electronhole interactions in small semiconductor crystallites: The size dependence of the lowest excited electronic state. J. of Chem. Phys. 80: 4403-4409.