Oct 29, 2015 - 2Texas Center for Superconductivity and Department of Physics, University of Houston, Houston, ... where R stands for rare-earth ions, the structural phase ...... [25] W. S. Choi, D. G. Kim, S. S. A. Seo, S. J. Moon, D. Lee, J. H..
PHYSICAL REVIEW B 92, 134308 (2015)
Optical properties, lattice dynamics, and structural phase transition in hexagonal 2H-BaMnO3 single crystals T. N. Stanislavchuk,1,* A. P. Litvinchuk,2 Rongwei Hu,3 Young Hun Jeon,4,5 Sung Dae Ji,5 S.-W. Cheong,3,4,5 and A. A. Sirenko1 1
Department of Physics, New Jersey Institute of Technology, Newark, New Jersey 07102, USA Texas Center for Superconductivity and Department of Physics, University of Houston, Houston, Texas 77204, USA 3 Rutgers Center for Emergent Materials and Department of Physics and Astronomy, Rutgers University, Piscataway, New Jersey 08854, USA 4 Laboratory for Pohang Emergent Materials, Pohang University of Science and Technology, Pohang 790-784, Korea 5 Max Plank POSTECH Center for Complex Phase Materials, Pohang University of Science and Technology, Pohang 790-784, Korea (Received 19 June 2015; revised manuscript received 31 August 2015; published 29 October 2015) 2
Optical properties and lattice dynamics of hexagonal 2H -BaMnO3 single crystals are studied experimentally in a wide temperature range by means of rotating analyzer ellipsometry and Raman scattering. The magnitude of the direct electronic band gap is found to be Eg = 3.2 eV. At room temperature the far-infrared (IR) ellipsometry spectra reveal six IR-active phonons; two of them are polarized along the c axis and four are polarized within the a-b plane. Seven phonon modes are identified in the Raman scattering experiments. Group theoretical mode analysis and complementary density functional theory lattice dynamics calculations are consistent with the 2H -BaMnO3 structure belonging to the polar P 63 mc space group at room temperature. All observed vibrational modes are assigned to specific eigenmodes of the lattice. The neutron diffraction measurements reveal a structural phase transition upon cooling below TC = 130 ± 5 K, which is accompanied by a lattice symmetry change from P 63 mc to P 63 cm. Simultaneously, at temperatures below TC several additional IR- and Raman-active modes are detected in experimental spectra. This confirms the occurrence of a structural transition, which is possibly associated with the appearance of electrical polarization along the c axis and a previously known tripling of the primitive cell volume at low temperatures. DOI: 10.1103/PhysRevB.92.134308
PACS number(s): 78.30.−j, 63.20.dh, 75.47.Lx, 75.85.+t
I. INTRODUCTION
The ABO3 family of crystalline materials is one of the most intensively studied during the last decade. This interest is driven by its known multifunctional properties and its potential for room temperature (RT) multiferroicity, which requires the coexistence of interconnected magnetic and ferroeletric orders in the same compound. In a typical ferroelectric perovskite, like BaTiO3 , the ferroelectricity appears due to hybridization of empty 3d shells of Ti and occupied 2p shells of O [1]. The ferroelectric distortion occurs due to the displacement of the B-site cation (Ti) with respect to the oxygen octahedra. While this mechanism requires empty 3d shells of the transition metal, the existence of magnetic order would require at least a partially filled 3d shell, thus creating an obstacle on the way to multiferroicity [2]. However, this obstacle can be overcome in compounds where different atoms are responsible for the ferroelectric and magnetic orders (lone pair mechanism). For example, in the well-studied rhombohedral perovskite BiFeO3 , the hybridization of Bi empty 6p orbitals and occupied oxygen 2p orbitals results in ferroelectric displacement of the Bi cation whereas partially occupied 3d shells of Fe are responsible for the magnetic order parameter [3]. In hexagonal (h) RMnO3 , where R stands for rare-earth ions, the structural phase transition results in tilting of MnO5 bipyramids accompanied by displacements of R 3+ and oxygen ions, which leads to a net ferroelectric polarization, while Mn3+ cations establish a magnetic order in the system [4,5]. The mechanism of * Author to whom correspondence should be addressed: stantar@ njit.edu
1098-0121/2015/92(13)/134308(10)
ferroelectricity in h-RMnO3 is of electrostatic origin rather than due to changes in chemical bonding, as in BiFeO3 . Thus, it implies that in properly designed materials the ferroelectricity and magnetism can be driven by the same ion. One of the systems interesting in this regard is the (Ca, Sr, Ba)MnO3 perovskites. It was shown that Mn spins form a long-range antiferromagnetic order with G-type magnetic structure in CaMnO3 [6] and SrMnO3 [7,8] and a triangular arrangement of spins perpendicular to the c axis in BaMnO3 [9] (BMO). First-principles calculations predict that these compounds possess ferroelectric instability which is Mn dominated in spite of the partial 3d state occupancy [10]. This instability is suppressed by antiferrodistortive oxygen motions, but it was shown that CaMnO3 can be made ferroelectric by applying an external strain [11]. Thus epitaxial CaMnO3 films with 2.3% tensile strain grown on (001)-oriented LaAlO3 substrates were found to be ferroelectric below 25 K. Since Ba has a larger ionic radius compared to Ca, it was suggested that BaMnO3 crystals can possess a ferroelectric ground state without external tensile strain but rather due to the chemical pressure [10,12]. The substitution of Ca cations with Ba cations results, however, in a 2H hexagonal structure with facesharing oxygen octahedra [13] instead of the orthorhombic perovskite structure of CaMnO3 with corner-sharing oxygen octahedra [14]. At the same time the exact symmetry of the 2H structure, and especially the atomic displacements that result in electric polarization, are still under debate. Early experimental optical studies performed by Roy and Budhani [15] on polycrystalline BMO samples revealed five Raman modes and four infrared (IR) modes. Since in a nonpolar centrosymmetric group all Raman modes are
134308-1
©2015 American Physical Society
T. N. STANISLAVCHUK et al.
PHYSICAL REVIEW B 92, 134308 (2015)
different from IR modes due to the exclusion principle, while in a polar group most of the modes are simultaneously IR and Raman active, the observed proximity of IR and Raman mode frequencies led the authors to the conclusion that the RT phase of BMO is polar P 63 mc [15]. The structural assignment to this polar group was also supported by recent dielectric measurements of ceramic 2H -BMO samples, where ferroelectric order was observed [16]. At the same time, several x-ray and neutron powder diffraction studies suggest a nonpolar P 63 /mmc group at RT [9,17]. Cussen and Battle [9] reported a structural phase transition between RT and 80 K which introduces displacements to MnO6 chains and results in tripling of the unit cell volume. These authors suggested a polar P 63 cm group for low temperatures (LTs) although they did ¯ group. not rule out the possibility of a centrosymmetric P 3c1 Recent first-principles calculations performed by Varignon and Ghosez [18] suggest that at room temperature 2H -BMO possesses a stable centrosymmetric P 63 /mmc structure while upon lowering the temperature it should develop an improper ferroelectric structural phase transition into a P 63 cm ground state. The calculations showed that the phase transition is driven mainly by the unstable nonpolar K3 phonon mode, which corresponds to the motion of Mn and O atoms along the c axis. The polarization then arises due to additional condensation of a stable polar �2− mode triggered by the condensation of the K3 mode [18]. Since RT and LT crystal structures are still under debate, we performed neutron powder diffraction measurements and optical studies of 2H -BMO single crystals in order to clarify their ground state and to investigate possible indications of the structural phase transitions. The number of spectroscopically accessible lattice excitations in the crystal is strictly determined by the crystal’s symmetry, which causes spectroscopic techniques to be sensitive to phase transitions upon which the symmetry changes. Unpolarized transmission and Raman measurements on polycrystalline samples have been performed and reported in the literature. In this paper we present experimental data for the phonon spectra and their polarization analysis measured between 7 and 300 K. Complementary density functional lattice dynamics calculations are performed, which allow assignment of the observed vibrational lines to the specific eigenmodes of the structure. Based on the optical phonon data we will present our conclusions about the crystal symmetry of the measured single-crystal samples. II. SAMPLES, EXPERIMENTAL TECHNIQUES, AND LATTICE DYNAMICS CALCULATIONS
2H -BMO single crystals were grown using a flux method at the Rutgers Center for Emergent Materials. BMO crystals were obtained in the form of translucent flakes with a typical size of 2 × 2 × 0.15 mm3 . The size of available BMO crystals allowed only for the ellipsometry measurement from the a-b plane. In contrast, the micro-Raman experiments were performed for laser light excitation and collection along and perpendicular to the c axis of the crystals. The J.A. Woollam M-2000 spectroscopic ellipsometer at the Center for Functional Nanomaterials at Brookhaven National Lab (CFN-BNL) was used in the spectral range from near-IR up to ultraviolet (UV) at room temperature only. Spectra of the
optical phonons were studied in the temperature range between 7 and 300 K. The far-IR optical experiments were carried out at the National Synchrotron Light Source (NSLS), BNL, at the U4IR beamline equipped with a Bruker 66 interferometer, a custom-made far-IR rotating analyzer ellipsometer (RAE), and a liquid-He-cooled (4.2 K) bolometer [19]. The spectral resolution in the far-IR experiments was 0.7 cm−1 . Raman scattering experiments were performed in the backscattering configuration using 532 nm (Nd:YAG) and 514.5 nm (Ar-ion) laser lines, a liquid-N2 -cooled CCD detector, and a singlegrating Jobin Yvon spectrometer, which provided a spectral resolution of about 2 cm−1 . Neutron powder diffraction data were collected at the ST2 HRPD beamline of HANARO ˚ Center, Korea using a neutron source with λ = 1.8344 A. The first-principles lattice dynamics calculations of 2H -BaMnO3 were performed within the generalized gradient approximation using the Perdew-Burke-Ernzerhof local functional [20] as implemented in the CASTEP code [21]. Normconserving pseudopotentials were used. Prior to performing calculations the structure was relaxed while keeping lattice parameters fixed and equal to the experimentally determined ones (a = 0.56991 nm, c = 0.48145 nm) for the space group P 63 mc, so that forces on atoms in the equilibrium position did not exceed 20 meV/nm. The integration within the Brillouin zone was performed over a 5 × 5 × 6 Monkhorst-Pack grid in the reciprocal space. The lattice dynamics was further assessed by treating a 3 × 3 × 2 supercell by the final displacement method, which yields the frequencies of transverse optical (TO) modes.
III. EXPERIMENTAL RESULTS AND DISCUSSION A. Neutron diffraction measurements
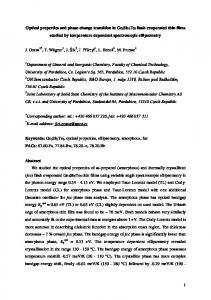
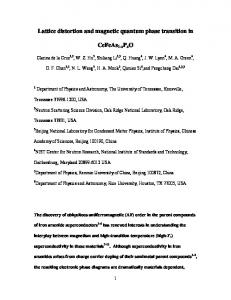
In order to determine the crystal structure of 2H -BMO crystals we performed temperature dependent neutron powder diffraction measurements in the range from 4 to 300 K [see Fig. 1(a)]. The samples for powder diffraction with a mass of about 5 g were obtained from the same growth run as the larger-size flakes that were used for the optical studies. At room temperature the crystal structure was equally well refined with the centrosymmetric P 63 /mmc and polar P 63 mc symmetry groups (see Fig. 2). On lowering the temperature to TC = 130 K, 2H -BMO undergoes a structural phase transition upon which the tripling of the unit cell occurs and the crystal symmetry group is lowered from P 63 mc (P 63 /mmc) to P 63 cm in agreement with the results of Cussen and Battle [9]. Figure 1(a) shows a number of structural peaks that appear in the diffraction spectra for T < TC . The correspondence � � between the unit cell parameters of the high- (a√ ,c ) and low� (a0 ,c0 ) temperature phases is as follows: a ≈ 3a0 , c� ≈ c0 and in vector form a� � = 2� a0 + b�0 , b�� = −� a0 + b�0 , c�� = c�0 . Figure 1(b) shows the temperature dependence of the a and c unit cell parameters obtained from the crystal structure refinement. The error bars for the a and c parameters are comparable with the size of the symbols in Fig. 1(b). In order to keep the a-parameter continuity across the phase transition we define a = a � , c = c� for the low-temperature phase and √ a = 3a0 , c = c0 for the high-temperature phase. While the temperature behavior of the a parameter does not show any
134308-2
OPTICAL PROPERTIES, LATTICE DYNAMICS, AND . . .
4K 30K 60K 100K 140K
2.5 Intensity (x104 arb. units)
Intensity (x102 arb. units)
3
2
1.5
15
(1 0 2) structure 4K 60K
10
100K 140K
5 2.7
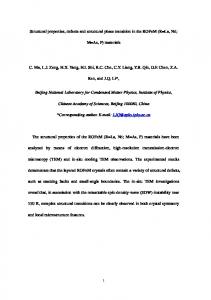
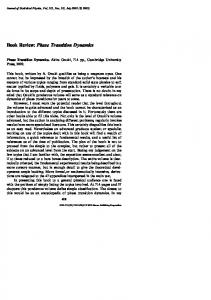
FIG. 2. (Color online) Crystallographic structure of 2H -BMO featuring face-sharing MnO6 octahedrons (space group P 63 mc) from (a) side view and (b) top view.
2.75 Q (Å)
M : magnetic peak
1
PHYSICAL REVIEW B 92, 134308 (2015)
N : structure peak 0.5
M
(a) 0
0
1
M M NM 2
N NNN
N
3
4
N
5
6
Q (Å)
(b)
0.9875
a
0.4815
c
TC=130±5 K
0.9865
0.481
0.986 0.9855 0.4805 0.985 0.9845 0.984
a 0
50
100
√
Lattice parameter c (nm)
Lattice parameter a (nm)
0.987
coupling between ferroelectric polarization, which appears in polar P 63 cm symmetry below TC and is directed along the c axis, and uniform strain along the c axis. Such a coupling could indicate that the polarization P and Curie temperature TC can be controlled by the strain along the c axis. More detailed analysis of neutron diffraction data (structural and magnetic peaks) and related dielectric studies will be presented elsewhere. While neutron diffraction measurements enabled us to determine the LT symmetry of 2H -BMO crystal (P 63 cm space group) they could not distinguish between P 63 /mmc and P 63 mc symmetry groups for the RT phase. As we will discuss in the next sections, symmetry-based selection rules for optical phonons in crystals possessing centrosymmetric P 63 /mmc and polar P 63 mc space groups are different, thus giving us a possibility to distinguish between those two groups.
3×a
150 200 Temperature (K)
250
B. Optical properties measured by spectroscopic ellipsometry
0.48 300
FIG. 1. (Color online) (a) Neutron diffraction data measured at several temperatures below (T = 4 K, 30 K, 60 K, 100 K) and above (T = 140 K) the structural transition temperature TC . Symbols M and N mark the magnetic and structural peaks. The inset shows the temperature variation for one of the structural peaks that disappears in the high-temperature phase above TC = 130 ± 5 K. (b) Neutron diffraction data for the temperature dependence of the 2H -BMO lattice parameters.
peculiarity and monotonically decreases with lowering of the temperature, the c parameter manifests a kink at TC = 130 K and starts increasing below the transition temperature. The fact that the lattice expands along c below TC may be related to the
In this section we will present spectroscopic ellipsometry data for 2H -BMO, which will also be compared with those for hexagonal RMnO3 (R=rare earth) crystals. Ellipsometry measurements were carried out in the spectral range between 0.75 and 5.9 eV. Figures 3(a) and 3(b) show experimental spectra for the real �ε1 (ω)� and imaginary �ε2 (ω)� parts of the pseudo dielectric function �ε(ω)� and measured at multiple angles of light incidence (AOI) between 55° and 75°. Due to the hexagonal symmetry, the dielectric function tensor is diagonal in the Cartesian x,y,z coordinate system (c�z) with εxx (ω) = εyy (ω) = ε⊥ (ω) and εzz (ω) = ε� (ω). In the measured configuration, when the reflecting surface of the sample coincides with the a-b crystallographic plane, �ε(ω)� is a function of the AOI = φ and the tensor components ε⊥ (ω) and ε� (ω) at each frequency ω [22,23]:
⎫2 ⎤ � ε⊥ [ε� −sin2 (φ)] 2 (φ) − ⎬ ε ε − sin ⊥ ⊥ ε� ⎥ ⎢ �ε� = sin2 (φ)⎣1 + sin2 (φ) ⎦. � ⎩ ε cos2 (φ) − ε − sin2 (φ) ε⊥ [ε� −sin2 (φ)] ⎭ ⊥ ⊥ ε� ⎡
⎧ ⎨
The observed weak angular dependence of the measured ellipsometry spectra did not allow us to decouple the inplane and out-of-plane components of the complex dielectric function, ε⊥ (ω) and ε� (ω). At the same time, Eq. (1) shows that the main contribution to �ε(ω)� comes from ε⊥ (ω), while the contribution from ε� (ω) is significant only near zeros of the real part of the ε� (ω) function. In the measured spectral range, however, it is very unlikely that ε1 (ω) could achieve a zero
(1)
value [see, for example, Fig. 3(a), where �ε1 (ω)� is above 2 in the whole spectral range]. Thus, the contribution from ε� (ω) should be small, and for modeling of the �ε1,2 (ω)� spectra we can consider ε� (ω) to be constant, for example equal to 3.6 which is the low-frequency value of the measured �ε1 (ω)� function, without any significant influence on the modeling result. The experimental spectra in Figs. 3(a) and 3(b) are dominated by a few strong absorption peaks above 3 eV.
134308-3
T. N. STANISLAVCHUK et al. 5.0
2H-BMO
PHYSICAL REVIEW B 92, 134308 (2015)
1
*
4.5
2
TABLE I. Experimental parameters of the strong Lorentz oscillators that have been used to model the spectral dependence of the �ε1 � and �ε2 � shown in Figs. 3(a) and 3(b). The oscillator strength Sk is in units of ε1 , where �ε1 �(0.75 eV) = 3.6.
3
〈ε1〉
4.0 3.5
Oscillator 1 Oscillator 2 Oscillator 3 Penn gap
3.0 2.5
(a)
2.0 3.0
0
2
3
4
5
2.0 1.5
*
1.0 0.5
(b)
0.0 0
1
2
3
4
1.6 eV
7 5
〈ε2〉
6
exp AOI=65° exp AOI=70° model fit
LuMnO3
6
5
4 3 2 1
(c)
0 0
1
2
3
4
5
6
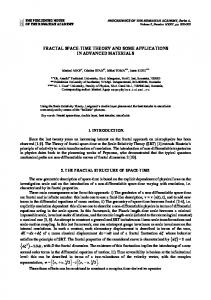
Photon energy (eV) FIG. 3. (Color online) (a) The real �ε1 (ω)� and (b) imaginary �ε2 (ω)� parts of the pseudo dielectric function (symbols) for a BMO single crystal measured at room temperature from the a-b plane with three values of AOI: 55°, 65°, and 75°. The results of the fit using a dielectric function model that consists of three oscillators and a Penn gap (see Table I) are shown with red solid curves. (c) Experimental data for �ε2 (ω)� in h-LuMnO3 . Note a strong absorption peak at 1.6 eV that is absent in (b).
Electronic structure calculations performed for orthorhombic [24] and hexagonal [25] manganites along with photoemission and x-ray absorption data [26,27] show that closest to the Fermi level are the Mn(3d) and O(2p) states. The strong peaks above 3 eV were observed in both ortho- and hexamanganites and attributed to allowed O(2p)-Mn(3d) charge transfer (CT) transitions [24,28–30]. The contribution of these CT transitions to the in-plane dielectric response was modeled with three isotropic Lorentz oscillators and a Penn gap oscillator: ε⊥ (ω) ≈ �ε(ω)� = 1 +
4 � k=1
Sk Ek,0 2 , Ek,0 2 − ω2 − iγk ω
γk , (eV)
Sk
3.2 3.9 5.1 8.6
0.5 1.0 1.6 1.3
0.3(5) 1.2(5) 1.0 0.1
6
2H-BMO exp AOI=55° exp AOI=65° exp AOI=75° model fit
2.5
〈ε2〉
1
Ek , (eV)
(2)
where Ek,0 is the electronic transition energy, Sk is the oscillator strength for the interband optical transition, and γk represents the broadening. Three Lorentz oscillators (k = 1, 2, 3)
at 3.2, 3.9, and 5.1 eV belong to the spectral range covered in our experiments. The lowest direct band gap at Eg = 3.2 eV is at the high-energy edge of the visible spectral range and its value does not contradict the translucent appearance of the measured BMO single crystals. The Penn gap (k = 4) at 8.6 eV is above the high-energy limit of our measurements and, thus, may not correspond to any real electronic transitions. This Penn gap has been included in the dielectric function model to take into account all other higher-energy optical transitions above 6 eV and to match the experimental low-energy value of �ε1 (ω)�, which is about 3.6. The parameters of the Penn gap and the Lorentz oscillators for the electronic transitions in BMO crystals are summarized in Table I and the fit results are shown in Figs. 3(a) and 3(b) with red curves. While the origin of the strong CT electronic transitions is quite clear, this is not the case for the weak peak marked with an asterisk and positioned at 2.5 eV. Note that electronic transition peaks in the range of 1 to 3 eV were observed in both ortho- and hexa-manganites, but their structure and intensity differ substantially between these systems, which is attributed to different environments of Mn3+ ions, different crystal field (CF) splitting of the Mn 3d manifold, and different levels of hybridization between O(2p) and Mn(3d) orbitals in ortho- and hexamanganites. Figure 3(c) shows experimental ellipsometry data of �ε2 (ω)� for a hexagonal single-crystal RMnO3 with R = Lu measured also from the a-b plane. Unlike the case of 2H -BMO, the spectrum of LuMnO3 is dominated by an intense and narrow band at about 1.6 eV. This peak, which is predominantly excited by the electric field of light E� ⊥ c, has also been observed in other hexagonal RMnO3 (where R is a rare earth or yttrium) [25,29–32]. There are still debates in the literature regarding the nature of this transition. The CF of D3h symmetry inside trigonal MnO5 bipyramids splits the Mn3+ d orbitals into three groups: e�� (xz, yz), e� (xy, x 2 − y 2 ), and a1� (3z2 − r 2 ) in order of energy increase [25]. According to Hund’s rule, four 3d electrons of Mn3+ ion occupy the e�� and e� orbitals to form a high-spin state while the a1� orbital is empty. One interpretation of the 1.6 eV peak is that it corresponds to the on-site d-d transition between Mn3+ orbitals which are hybridized with oxygen orbitals [30,31]. Another interpretation is that the 1.6 eV peak is related to a transition from high-energy O(2p) states to the Mn(da1� ) state [26,29,33]. Finally, it was suggested that, because of the strongly hybridized nature of the occupied states, the peak at 1.6 eV should be related to a transition from O(2p) orbitals, which are hybridized with Mn 3d orbitals of the same symmetry, to the unoccupied Mn a1� orbital, rather than to strictly d-d or p-d transitions [25,34].
134308-4
OPTICAL PROPERTIES, LATTICE DYNAMICS, AND . . .
PHYSICAL REVIEW B 92, 134308 (2015)
C. Far-IR ellipsometry measurements of optical phonons
Spectra of the IR-active optical phonons in BMO single crystals have been measured with spectroscopic RAE from the a-b reflecting surface of the sample using a single value for the AOI of 75°. In P 63 mc(P 63 /mmc) RT phase of 2H -BMO
T =10K AB2 Experiment Fit
AB1 150 C1 100
〈ε1〉
AB3 AB4 C2
*
LO
50
LO 30 20 10 0 -10 -20
0
⇓
-50 -100
zoomed
(a)
-150 100
200
300
400
500
600
700 30 20 10 0 -10
250 200
〈ε2 〉
The 1.6 eV peak is known to be absent in the spectra of orthorhombic RMnO3 manganites [24,35], which possess a weaker peak at ∼2 eV with a fine structure [24,28,36]. We note that the structure of this peak in ortho-RMnO3 is retained for different R 3+ ions [24] while in h-RMnO3 the position of the ∼1.6 eV peak shifts by ∼0.1 eV with change of the R 3+ ion [25,32]. In contrast to h-RMnO3 with trigonal MnO5 bipyramids, orthorhombic manganites, as well as 2H -BMO, are composed of MnO6 octahedrons. The d orbitals of the Mn3+ ion in ortho-RMnO3 are split by the Oh octahedral CF into two groups: t2g (xz, yz, xy) and eg (3z2 − r 2 , x 2 − y 2 ) which are further split by Jahn-Teller (JT) distortion [37]. Four 3d electrons of Mn3+ ion occupy three t2g orbitals and the lower eg orbital to form a high-spin state while the upper eg orbital is empty. Theoretical studies showed that the observed weak peak at 2 eV originates from the intersite nearestneighbor deg -deg CT transition [24,38] while its weak structure corresponds to O[t2u (π )] − Mn(eg ) and parity-forbidden but phonon-assisted O[t1g (π )] − Mn(eg ) CT transitions [24]. In contrast to the 3d 4 electronic configuration of Mn3+ ions in ortho-RMnO3 , the electronic configuration of Mn4+ ions in 2H -BMO is 3d 3 , just as in CaMnO3 . The latter crystal is composed of the same MnO6 octahedrons as ortho-RMnO3 , but due to the 3d 3 electronic configuration of the Mn4+ ions their eg orbitals are unoccupied. Thus, the intersite deg -deg transition at ∼ 2 eV typical for ortho-RMnO3 was not observed in CaMnO3 , which appeared to be transparent below 3 eV [39]. While both 2H -BMO and CaMnO3 are composed of MnO6 octahedra with Mn4+ ions, the symmetries of Mn sites are different in these compounds. In the P 63 mc structure of 2H BMO Mn4+ ions occupy positions with C3v symmetry inside face-sharing MnO6 trigonal antiprisms which form chains along the c axis, while in the Pbnm structure of CaMnO3 Mn4+ ions occupy positions with Oh symmetry inside corner-sharing MnO6 octahedra. Lowering the symmetry from Oh to C3v splits one-electron t2g orbitals into an a1 singlet and an e doublet; the eg doublet remains unsplit but because of the absence of inversion symmetry it becomes an e level [40]. According to Hund’s rule, three d 3 electrons of the Mn4+ ion occupy the a1 and lower e orbitals to form a high-spin state while the upper e orbitals are empty. Since MnO6 octahedra in 2H -BMO do not share oxygen ions in the a-b plane, as in ortho-RMnO3 , we can rule out the possibility of intersite nearest-neighbor d-d CT transition in Mn4+ ions as excited by E� ⊥ c (a-b plane CT transition). The dipole-allowed on-site d-d transitions for the E� ⊥ c polarization are from a1 and lower e orbitals to upper e orbitals. Thus, we assume that the weak peak observed at 2.5 eV and marked with an asterisk in Figs. 3(a) and 3(b) is either due to on-site Mn4+ a1 ,e → e transitions or due to charge transfer transitions from high-energy O(2p) states to Mn(3d) states. To clarify the nature of the observed weak peak further, electronic band structure calculations along with temperaturedependent spectroscopic measurements are needed.
zoomed
150 100 50
⇑ (b)
0 100
200
300
400
500
600
700
-1
Wave numbers (cm )
FIG. 4. (Color online) (a) The real and (b) imaginary parts of the measured pseudo dielectric function �ε1 (ω)� and �ε2 (ω)� (black curves) for a BMO single crystal measured for TC = 10 K from the a-b plane with AOI of 75°. The results of the fit using a dielectric function model that consists of seven oscillators are shown with red solid curves. The ABm and Cn labels mark TO frequencies of the phonon modes. For this reason the positions of Cn labels are at the low-frequency side from the spectral lines corresponding to Cn modes since they manifest themselves at LO frequencies in the current configuration of the measurements.
crystal the following phonon modes are optically accessible: modes with E1 (E1u ) symmetry as electric dipoles polarized in the a-b plane and modes with A1 (A2u ) symmetry as electric dipoles polarized along the c axis. Figures 4(a) and 4(b) show experimental data for the real and imaginary parts of the pseudo dielectric function �ε1 (ω)� and �ε2 (ω)�. The optical spectra were fitted with an anisotropic model function ε� (ω) = ε∞,� +
N � n=1 M �
Sn,� ωn,� 2 , ωn,� 2 − ω2 − iγn,� ω (3)
Sm,⊥ ωm,⊥ 2 , ε⊥ (ω) = ε∞,⊥ + ω 2 − ω2 − iγm,⊥ ω m=1 m,⊥ consisting of M Lorentz oscillators polarized in the a-b plane and N oscillators polarized along the c axis. For RT experiments, M = 4 and N = 2, while at LT the number of observed phonon modes polarized in the a-b plane increases to M = 5. In Eqs. (3) ωn(m) ,�(⊥) is the phonon frequency, Sn(m),�(⊥) is the phonon oscillator strength, γn(m),�(⊥) stands for the phonon broadening, and ε∞,�(⊥) represents the dielectric constant at frequencies above those of the measured optical phonons but below the near-IR spectral region discussed in the previous section [�ε1 �(0.75 eV) ≈ 3.6]. The results of the fit using Eqs. (3) are shown in Fig. 4(a) and 4(b) with red curves. All modes polarized in the a-b plane are marked as ABm (m = 1, 2, 3, 4) while those polarized along the c axis are marked as Cn (n = 1, 2). The phonon mode which appears at LT and is polarized in the a-b plane is marked with an asterisk. We note that, in ellipsometric
134308-5
T. N. STANISLAVCHUK et al.
PHYSICAL REVIEW B 92, 134308 (2015)
TABLE II. Frequencies and symmetries of the experimental IRand Raman-active phonons at RT in comparison with DFT-calculated values for the P 63 mc space group. All phonon frequencies are in cm−1 . (2) means a doublet at LT. ε∞,⊥ = 2.9.
correspondingly high uncertainty of the quasistatic value of ε1,⊥ (0) = 9 ± 3.
Phonon symmetry
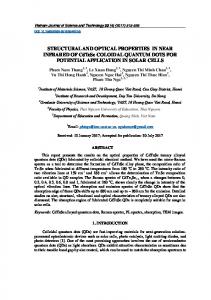
The spectra of the optical phonons in the same crystals of 2H -BMO have also been studied using Raman scattering. ¯ Several backscattering configurations were utilized: c(a,a)c, ¯ a(b,b)a, ¯ and a(c,b)a, ¯ where the first and the a(c,c)a, last symbols correspond to the k-vector direction for exciting and scattered light, whereas the symbols in parentheses correspond to the polarization direction of the excitation and scattering light waves. In these geometries the following mode symmetries should become accessible [41]: A1 + E2 , A1 , A1 + E2 , and E1 , as the in-plane x and y axes could not be distinguished for a hexagonal crystal. As shown in Fig. 5, the experimental spectra are not completely polarized. Several A1 symmetry modes could, however, be reliably identified in the a(c,c)a¯ spectrum (at 368 and 492 cm−1 ), while the relatively high intensity of the 120 and 530 cm−1 modes in the c(a,a)c¯ spectrum proves them to be of E2 symmetry. It is worth noting that the modes at 639 and 660 cm−1 observed in Raman spectra are very close in frequency to those detected in IR spectra (639 and 653 cm−1 ) and assigned to the A1 and E1 symmetry, respectively. A relatively weak and broad feature observed in the spectra around 590 cm−1 and marked with an asterisk in Fig. 5 could probably be attributed to the phonon second-order scattering processes. The experimentally observed phonon frequencies and their symmetries are summarized in Table II along with the results of first-principles calculations for the space group P 63 mc. It seems that there is a reasonable agreement between the experimental and calculated mode frequencies. The behavior of phonon modes in the IR and Raman spectra can be better understood if we consider the corresponding atomic displacements, some of which are shown in Fig. 6. The fully symmetric A1 mode corresponds to the symmetric breathing of oxygen atoms around Mn, and its strong Raman intensity (see the 644 cm−1 mode in Fig. 5) can be attributed to a large polarizability of the mode. However, its infrared
A1 E2 E1 E2 A1 a E1 E2 E2 A1 E2 E1 A1 E1 a E1 a
IR (expt.)
Raman (expt.)
82 119 145 344 368a 394
64 128 119 324
639
385 393 436 468 518 486 684
660
611
413(2) 487(2) 526 599 639 641a 653
DFT (calc.)
LT modes only.
spectra obtained from the a-b reflectance plane of the sample, phonon modes polarized in the a-b plane manifest themselves at transverse optical frequencies, while those polarized along the c axis appear at their longitudinal optical (LO) frequencies, or where ε� (ω) = 0. In Fig. 4 the positions of ABm and Cn labels correspond to TO frequencies of the phonon modes. For this reason the positions of Cn labels are at the low-frequency side from the spectral lines corresponding to the Cn modes. Also, spectra in Fig. 4 show two spectral features at ∼230 and ∼700 cm−1 at which the pseudo dielectric function �ε2 � becomes negative. These features appear at LO frequencies of phonon modes polarized in the a-b plane and are reasonably fitted with our model without introducing any additional oscillators. We note that while the true dielectric function ε2 is always positive, the pseudo dielectric function �ε2 � in anisotropic materials, as shown in Eq. (1), could become negative, which does not contradict any laws of physics. The parameters of the optical phonons are summarized in Table II. The experimental value of ε∞,⊥ is determined to be 2.9. This experimental value is in a reasonable agreement with the low-energy value of �ε1 �(0.75 eV) = 3.6 from the optical data presented in the previous section. Due to the small size of the BMO crystals available to us, the low-frequency range of the spectra in Fig. 4(a) and 4(b) is affected by both the diffraction limit and diffused light scattering by the edges of the small samples. These effects revealed themselves in an artificial decrease of the pseudo dielectric function �ε1 (ω)� for low frequencies and an increase of �ε2 (ω)� in the spectral range below ∼150 cm−1 , where the wavelength of light becomes comparable with the apparent size of the measured sample at an AOI of 75°. Note that this artifact of the measurements does not in practice influence the obtained values of the phonon frequencies. The quasistatic value of ε1,⊥ (0) is found as a sum of ε∞,⊥ and the combined oscillator strength of all four optical phonons ε1,⊥ (0) = � ε∞,⊥ + M m=1 Sm . The uncertainty in the experimental values of the low-frequency phonon oscillator strength results in the
D. Raman scattering experiments
FIG. 5. (Color online) Low-temperature Raman spectra mea¯ a(c,c)a, ¯ sured in four complementary scattering geometries: c(a,a)c, ¯ and a(c,b)a. ¯ The phonon peaks are marked according to a(b,b)a, their frequencies.
134308-6
OPTICAL PROPERTIES, LATTICE DYNAMICS, AND . . .
PHYSICAL REVIEW B 92, 134308 (2015)
equation [42]: � � ω0 (T ) = ω0|T =0 exp −3γG
T
� α(T )dT , �
�
(4)
0
FIG. 6. (Color online) Atomic displacements calculated with density functional theory (DFT) corresponding to several highfrequency phonon modes.
intensity is not high (see the C2 mode in Figs. 4 and 7) because there is only a small dipole moment generated along the c axis via a vibration of oxygen that is slightly out of the a-b plane. For a similar reason, the nonpolar E2 mode also has a large Raman intensity (see the 530 cm−1 mode in Fig. 5). The E1 mode, which involves contribution from the in-plane oxygen and Mn displacements, is, instead, rather strong in the infrared spectrum (see the AB4 mode in Figs. 4 and 7).
E. Temperature dependence of the phonon frequencies
The temperature dependence of the IR optical phonon frequencies is shown in Fig. 7. The oxygen motion-related high-frequency modes (AB3 , AB4 , and C2 ) along with the low-frequency mode AB1 demonstrate a natural softening with the temperature increase. This common behavior is known to be caused by the thermal expansion of the lattice and anharmonic phonon-phonon interactions, which become more important as the temperature increases due to the statistical increase of the number of phonons. We fitted the temperature dependence of the AB1,3,4 and C2 phonons using the following
where γG is a Gr¨uneisen parameter, α(T ) is the linear expansion coefficient along the corresponding a or c axis, and ω0|T =0 is the phonon frequency at zero temperature. α(T ) was obtained as the derivative of the temperature dependencies of the a and c lattice parameters shown in Fig. 1(b). The results of the calculation are shown in Fig. 7 with red curves. Typical values of the Gr¨uneisen parameters for the modes polarized in the a-b plane are found to be γG = 1.1 ± 0.1. The low-frequency mode AB2 shows a weak, i.e., nonGr¨uneisen, hardening with the temperature increase. The oscillator strengths of the IR modes, which are also shown in Fig. 7, are nearly temperature independent. This observation predicts the absence of a phonon-driven variation of the quasistatic dielectric constant ε⊥ (0,T ) with temperature. Below the structural transition temperature TC = 130 K we observed the appearance of a weak mode at 641 cm−1 which is labeled with an asterisk in Fig. 7. The appearance of the new phonon mode at LT indicates a transition to a structure with a lower symmetry. Our ellipsometry data for the c-axis-polarized phonons C1 and C2 are not as clear as those for the a-b-plane modes. The mode position was identified, but the experimental data for their oscillator strengths are less accurate. Much larger crystals with at least a few millimeters along the c axis would be required for more accurate studies. The temperature dependence of the two c-axis-polarized phonons C1 and C2 is shown in Fig. 7. The high-frequency mode at 639 cm−1 demonstrates a Gr¨uneisen-like behavior with γG = 1.5 close to that for the a-b-plane modes. Thus, at room temperature we observed six strong IR-active phonons, four of which are polarized in the a-b plane and two along the c axis. In the low-temperature phase T < TC an additional weak phonon polarized in the a − b plane appears at ∼641 cm−1 . The temperature dependence of the Raman-active phonons is shown in Fig. 8. The most remarkable observation is the appearance of the A1 mode at 368 cm−1 for T < TC [see Figs. 8(a) and 8(b)]. This phonon appears only in the a(c,c)a¯ configuration which corresponds to its polarization along the c axis. The normalized amplitude of this mode has a strong steplike behavior typical for the first-order phase transitions at TC = 130 K. For T < TC two other higher-frequency modes at 417 and 492 cm−1 split into doublets of nearly equal-intensity peaks with a splitting of ∼2 cm−1 [see Figs. 8(c)–8(f)]. The high-frequency A1 mode at 660 cm−1 has a non-Gr¨uneisen temperature dependence at low temperatures with a kink at T = TC [see Fig. 8(j)]. The appearance of a new mode, splitting of several existing Raman modes, and softening of the high-frequency mode for T < TC indicates a possible appearance of electrical polarization in the noncentrosymmetric LT phase below 130 K. To conclude this section, we repeat that at room temperature we observed seven Raman-active modes. For T < TC one extra mode appeared with polarization along the c axis and two phonons split into doublets. The total number of observed Raman modes in the LT phase increases to ten.
134308-7
Osc. strength S Damping coeff. γ (cm-1) Wavenumber ω (cm-1)
T. N. STANISLAVCHUK et al. C1
84
TC
83
PHYSICAL REVIEW B 92, 134308 (2015) AB1
146.5 146.0
82
145.0
80
TC
394.6
γG=1.1
145.5
81
AB3
AB2
TC
604
γG=1.1
C2, AB4
*
642.0
TC
TC
394.4
602
641.0
394.2
600
640.5
TC
655
641.5
γG=0.6
650
γG=1.5
645 640
79 0
100
200
10
144.5 300 0 7
200
300
0
6
6
5
3.5
4
4
3.0
2
3 100
200
300 3.85
0.15
3.80
0.10
3.75
0.05
3.70
0.00
3.65 0
100
200
300
200
300
100
200
300
0
100
200
300
100
200
300
100
200
300
640.0 0 11 10 9 8 7 6 5
0
100
200
300
100
200
300
0
100
200
300
300
0
100
200
300
0
100
200
300
0.11
0.25 200
300
0.12
0.01
0.26
100
200
0.13
0.27
0
100
0.14
0.28
0.24
0 9 8 7 6 5 4 3
0.02
0.080 0.079 0.078 0.077 0.076 0.075 0
0
11 10 9 8 7 6
2.5 0
0.20
100
4.0
8
0
598
394.0 100
0.10 0
100
200
300
0.00
0.09 0
100
200
300
Temperature (K)
FIG. 7. (Color online) Temperature dependencies for parameters of the IR-active optical phonons. The red curves on the graphs for lines AB1 , AB3 , AB4 , and C2 are fits using Eq. (3) with the Gr¨uneisen parameter γG shown next to the curves. The structural transition temperature of TC = 130 K is shown with the vertical dashed line. F. Crystal symmetry discussion
The experimental data presented here provide important information for analysis of the 2H -BaMnO3 structure. First, we have to mention the number and symmetries of the expected vibrational modes for several relevant structures. The P 63 /mmc and P 63 mc space groups (Z = 2) have ten atoms per unit cell, which generate 30 degrees of freedom. For the centrosymmetric space group P 63 /mmc one expects 2A2u + 3E1u (IR), A1g + E1g + 3E2g (Raman), A2u + E1u (acoustic) and A2g + 2B1g + B1u + 2B2u + 2E2u (silent) modes, while for the space group P 63 mc group theory predicts 3A1 + 4E1
(IR), 3A1 + 4E1 + 5E2 (Raman), A1 + E1 (acoustic), and A2 + 4B1 + B2 (silent) modes. Note that according to group theory for the noncentrosymmetric P 63 mc group all IR modes are allowed to be observed in Raman spectra, while for centrosymmetric P 63 /mmc group all IR modes are different from Raman modes. The number of observed IR and Raman modes at room temperature (six IR modes and seven Raman modes) is higher than the number of modes expected for the P 63 /mmc space group (five IR modes and five Raman modes), a fact which allows us to exclude this space group from the possible candidates for the RT phase. For the same reason the space group P 63 cm (Z = 6) can be excluded as
FIG. 8. (Color online) Temperature dependence of the Raman-active phonons measured in the a(c,c)a¯ configuration. (a),(b) Appearance of a new mode at 369 cm−1 for T < TC . (c)–(f) Splitting of the phonons at 417 cm−1 and at 492 cm−1 . (g),(h) Gr¨uneisen-like hardening of the phonon at 530 cm−1 with γG = 0.8. (i),(j) Phonon at 660 cm−1 with a kink at T = TC and Gr¨uneisen hardening of the phonon at 644 cm−1 with γG = 1.3. 134308-8
OPTICAL PROPERTIES, LATTICE DYNAMICS, AND . . .
PHYSICAL REVIEW B 92, 134308 (2015)
well, for which a much larger number of modes is expected due to tripling of the unit cell volume: 8A1 + 14E1 (IR) as well as 8A1 + 14E1 + 15E2 (Raman). Thus, our experimental findings point toward the P 63 mc space group as being the most appropriate for the room-temperature structure of 2H -BaMnO3 . A critical point here is that experimentally several modes (A1 at 639/639 cm−1 and E1 at 653/660 cm−1 ), as measured in the IR and Raman spectra, practically coincide in frequency, a fact, that indicates the absence of inversion symmetry for the structure.
IV. CONCLUSION
show seven vibrational modes. Group-theory mode analysis and complementary density functional theory lattice dynamics calculations are consistent with the 2H -BaMnO3 belonging to polar space group P 63 mc rather than centrosymmetric P 63 /mmc at room temperature. All observed vibrational modes are assigned to the specific eigenmodes of the lattice. Below the TC = 130 K of the structural phase transition, additional modes in the IR and Raman spectra have been observed. The appearance of an additional mode, the splitting of several existing Raman modes, and the softening of the high-frequency mode for T < TC are consistent with the tripling of the primitive cell in the low-temperature phase and the possible appearance of polarization in the LT phase.
The electronic structure of 2H -BaMnO3 is found to be different from a related family of hexagonal RMnO3 manganites (where R = Y, Ho, Er, Tm, Yb, and Lu) by the absence of the strong “red band” at about 1.6 eV, which is typical for the latter compounds. Instead, a weak peak was observed at 2.5 eV, which we assume corresponds to transition from Mn a1 or lower e orbitals to Mn upper e orbitals or from high-energy O(2p) states to Mn(3d) states. The fundamental direct optical gap is found to be at Eg = 3.2 eV. The neutron diffraction measurements for a 2H -BMO single crystal reveal the existence of a structural transition from P 63 mc (P 63 /mmc) symmetry at room temperature to P 63 cm for temperature below TC = 130 K. While the temperature behavior of the lattice parameter a does not show any peculiarity, the c parameter manifests a kink at TC = 130 K and starts increasing below the transition temperature, which may be related to the coupling between ferroelectric polarization and uniform strain along the c axis in the polar LT P 63 cm phase. The far-IR ellipsometry spectra reveal six IR-active phonons at room temperature (two of them are polarized along the c axis and four are polarized within the a-b plane), while Raman scattering experiments
The authors are thankful to Ken Ahn at NJIT and Yuri Janssen and Peter Khalifah at SUNY Stony Brook for useful discussions and to Y.J. and P.Kh. for help with x-ray measurements at RT. The ellipsometry and Raman scattering measurements and crystal growth at NJIT and Rutgers were supported by DOE Grant No. DE-FG02-07ER46382. Lattice dynamics calculations and low-temperature Raman scattering experiments were carried out by A.P.L. who acknowledges the support of the State of Texas through the Texas Center for Superconductivity at the University of Houston. Use of the National Synchrotron Light Source, Brookhaven National Laboratory, was supported by DOE Grant No. DE-AC02-98CH10886. Near-IR–visible ellipsometry measurements at the Center for Functional Nanomaterials, Brookhaven National Laboratory, have been supported by DOE Grant No. DE-AC02-98CH10886. The work at Postech was supported by the Max Planck POSTECH/KOREA Research Initiative Program (Grant No. 2011-0031558) through NRF of Korea funded by MSIP.
[1] R. E. Cohen, Nature (London) 358, 136 (1992). [2] N. A. Hill, J. Phys. Chem. B 104, 6694 (2000). [3] J. B. Neaton, C. Ederer, U. V. Waghmare, N. A. Spaldin, and K. M. Rabe, Phys. Rev. B 71, 014113 (2005). [4] B. B. Van Aken, T. T. M. Palstra, A. Filippetti, and N. A. Spaldin, Nat. Mater. 3, 164 (2004). [5] C. J. Fennie and K. M. Rabe, Phys. Rev. B 72, 100103(R) (2005). [6] E. O. Wollan and W. C. Koehler, Phys. Rev. 100, 545 (1955). [7] P. D. Battle, T. C. Gibb, and C. W. Jones, J. Solid State Chem. 74, 60 (1988). [8] A. Daoud-Aladine, C. Martin, L. C. Chapon, M. Hervieu, K. S. Knight, M. Brunelli, and P. G. Radaelli, Phys. Rev. B 75, 104417 (2007). [9] E. J. Cussen and P. D. Battle, Chem. Mater. 12, 831 (2000). [10] S. Bhattacharjee, E. Bousquet, and P. Ghosez, Phys. Rev. Lett. 102, 117602 (2009). [11] T. G¨unter, E. Bousquet, A. David, Ph. Boullay, Ph. Ghosez, W. Prellier, and M. Fiebig, Phys. Rev. B 85, 214120 (2012). [12] J. M. Rondinelli, A. S. Eidelson, and N. A. Spaldin, Phys. Rev. B 79, 205119 (2009).
[13] B. L. Chamberland, A. W. Sleight, and J. F. Weiher, J. Solid State Chem. 1, 506 (1970). [14] K. R. Poeppelmeier, M. E. Leonowicz, J. C. Scanlon, and J. M. Longo, J. Solid State Chem. 45, 71 (1982). [15] C. Roy and R. C. Budhani, Phys. Rev. B 58, 8174 (1998). [16] S. Satapathy, M. K. Singh, P. Pandit, and P. K. Gupta, Appl. Phys. Lett. 100, 042904 (2012). [17] A. N. Christensen and G. Ollivier, J. Solid State Chem. 4, 131 (1972). [18] J. Varignon and P. Ghosez, Phys. Rev. B 87, 140403(R) (2013). [19] T. N. Stanislavchuk, T. D. Kang, P. D. Rogers, E. C. Standard, R. Basistyy, A. M. Kotelyanskii, G. Nita, T. Zhou, G. L. Carr, M. Kotelyanskii, and A. A. Sirenko, Rev. Sci. Instrum. 84, 023901 (2013). [20] J. P. Perdew, K. Burke, and M. Ernzerhof, Phys. Rev. Lett. 77, 3865 (1996). [21] S. J. Clark, M. D. Segall, C. J. Pickard, P. J. Hasnip, M. J. Probert, K. Z. Refson, and M. C. Payne, Z. Kristallogr. 220, 567 (2005).
ACKNOWLEDGMENTS
134308-9
T. N. STANISLAVCHUK et al.
PHYSICAL REVIEW B 92, 134308 (2015)
[22] R. Basistyy, T. N. Stanislavchuk, A. A. Sirenko, A. P. Litvinchuk, M. Kotelyanskii, G. L. Carr, N. Lee, X. Wang, and S.-W. Cheong, Phys. Rev. B 90, 024307 (2014). [23] G. E. Jellison, Jr. and J. S. Baba, J. Opt. Soc. Am. A 23, 468 (2006). [24] A. S. Moskvin, A. A. Makhnev, L. V. Nomerovannaya, N. N. Loshkareva, and A. M. Balbashov, Phys. Rev. B 82, 035106 (2010). [25] W. S. Choi, D. G. Kim, S. S. A. Seo, S. J. Moon, D. Lee, J. H. Lee, H. S. Lee, D.-Y. Cho, Y. S. Lee, P. Murugavel, J. Yu, and T. W. Noh, Phys. Rev. B 77, 045137 (2008). [26] J.-S. Kang, S. W. Han, J.-G. Park, S. C. Wi, S. S. Lee, G. Kim, H. J. Song, H. J. Shin, W. Jo, and B. I. Min, Phys. Rev. B 71, 092405 (2005). [27] K. Asokan, C. L. Dong, C. W. Bao, H. M. Tsai, J. W. Chiou, C. L. Chang, W. F. Pong, P. Duran, C. Moure, and O. Pena, Solid State Commun. 134, 821 (2005). [28] N. N. Kovaleva, A. V. Boris, C. Bernhard, A. Kulakov, A. Pimenov, A. M. Balbashov, G. Khaliullin, and B. Keimer, Phys. Rev. Lett. 93, 147204 (2004). [29] A. M. Kalashnikova and R. V. Pisarev, JETP Lett. 78, 143 (2003). [30] A. B. Souchkov, J. R. Simpson, M. Quijada, H. Ishibashi, N. Hur, J. S. Ahn, S. W. Cheong, A. J. Millis, and H. D. Drew, Phys. Rev. Lett. 91, 027203 (2003).
[31] R. C. Rai, J. Cao, J. L. Musfeldt, S. B. Kim, S.-W. Cheong, and X. Wei, Phys. Rev. B 75, 184414 (2007). [32] A. A. Makhnev and L. V. Nomerovannaya, Phys. Met. Metallogr. 114, 910 (2013). [33] J. E. Medvedeva, V. I. Anisimov, M. A. Korotin, O. N. Mryasov, and A. J. Freeman, J. Phys.: Condens. Matter 12, 4947 (2000). [34] A. S. Moskvin and R. V. Pisarev, Low Temp. Phys. 36, 489 (2010). [35] W.-C. Yi, S.-I. Kwun, and J.-G. Yoon, J. Phys. Soc. Jpn. 69, 2706 (2000). [36] M. A. Quijada, J. R. Simpson, L. Vasiliu-Doloc, J. W. Lynn, H. D. Drew, Y. M. Mukovskii, and S. G. Karabashev, Phys. Rev. B 64, 224426 (2001). [37] J. A. Alonso, M. J. Mart´ınez-Lope, M. T. Casais, and M. T. Fern´andez-D´ıaz, Inorg. Chem. 39, 917 (2000). [38] K. H. Ahn and A. J. Millis, Phys. Rev. B 61, 13545 (2000). [39] J. H. Jung, K. H. Kim, D. J. Eom, T. W. Noh, E. J. Choi, J. Yu, Y. S. Kwon, and Y. Chung, Phys. Rev. B 55, 15489 (1997). [40] F. A. Cotton, Chemical Applications of Group Theory (Wiley, New York, 1990). [41] R. Loudon, Adv. Phys. 13, 423 (1964). [42] J. M´en´endez and M. Cardona, Phys. Rev. B 29, 2051 (1984).
134308-10