obtained with 1-cm spatial resolution by using a fan-beam geometry with a .... (1r2 3 t n. (2) where M is the number of fan-source positions on the full circle, r is ...
270
OPTICS LETTERS / Vol. 9, No. 7 / July 1984
Optical tomography: experimental verification of noise theory K. Bennett and R. L. Byer Department of Applied Physics, Edward L. CinztonLaboratoryof Physics, Stanford University, Stanford, California 94305. Received January 17, 1984; accepted April 4, 1984 Optical absorption tomography is used to map the iodine-vapor density in a plane. Two-dimensional images are obtained with 1-cm spatial resolution by using a fan-beam geometry with a 56-cm-diameter source circle. Experimental results confirm a theoretical analysis of noise in the reconstructed image, including the effects of correlated noise, position within the image, and spatial averaging.
Knowing the spatial resolution of densities of specific species is useful in fluid-flow and combustion studies. Optical absorption tomography, discussed here, pro-
circles have a radius p of 28 cm. Typical data-acquisi-
vides a two-dimensional image in a planar cross section of a flow field. Tomography offers the advantage of
shorter data-acquisition times. The measurements were made using 2 W of multiaxial-mode 514.5-nm radiation. The iodine-vapor plume absorbs argon-ion laser radiation, does not introduce Fresnel reflections or beam steering, and is relatively safe to handle. Iodine vapor is created by flowing nitrogen through a bed of iodine crystals placed in a 9-cm-diameter container with a temperature-controlled outer jacket.
accurate and absolute spatially resolved absorption measurements with good time resolution. Other techniques that have been demonstrated to provide spatially resolved species-density measurements include planar laser-induced fluorescence1 - 3 and spontaneous Raman and Rayleigh scattering.4 Quantitative interpretation of fluorescence measurements is complicated by quenching, 5 whereas Raman techniques suffer from low sensitivity. In contrast to these
imaging techniques, absorption tomography remains quantitative in optically thick systems and does not require access outside the plane of interest. Optical tomography, an extension of computed x-ray tomography, 6 -8 was proposed by Byer and Shepp. 9
Computed tomography reconstructs a two-dimensional image from line integrals of the absorption, called pro-
jections, along rays traversing the image plane. A parallel-beam
geometry was employed by Santoro et
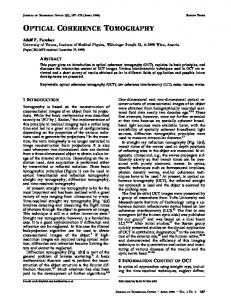
al. 10 to measure methane density in a flame. We report the first experimental demonstration to our knowledge of fan-beam-geometry optical tomography. We also present the results of a theoretical analysis of noise in the reconstructed image resulting from the noise in the projections. The experimental results demonstrate the imaging capabilities of optical tomography and quantitatively confirm the theoretical predictions. Figure 1 is a cutaway drawing of the fan-beam-geometry optical tomography apparatus. A 6-mm-diameter rotating laser spot scattering off a Lambertian surface provides a diverging source of radiation that creates the fan. An encoder on the rotating mirror shaft
measures the position of the laser spot. Rays diverge from the laser spot at the fan vertex to each of the 90 silicon photodiode detectors evenly spaced in a circle
10 mm below the rotating laser spot. The intensities of the rays are sampled and held after traversing the image field for each of the 90, 180, or 360 uniformly
spaced fan-source positions. The data were averaged for 16 scans. Both the fan-source and the detector 0146-9592/84/070270-03$2.00/0
tion time is limited by electronics to 100 msec per scan. However, it is straightforward to design for significantly
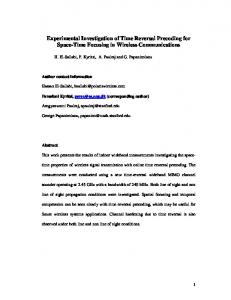
Figure 2 shows an image of the iodine cloud obtained
at a jacket temperature of 350C, corresponding to a saturated iodine-vapor density of 0.6 Torr. The peak absorption is 0.036 cm-, which is 125 times greater than
the noise level at the center of the reconstructed image. The convolution backprojection algorithm discussed by
Herman 1 l was used for the reconstruction. The reconstruction used data from 180 fans. The noise has been reduced by convolving the Ramachandran-Lakshiminarayan (RL) reconstruction kernel" with a triangle smoothing filter of width 2 described below. For absorption tomography, the projection evaluated along a ray is the logarithm of the ratio of the transmitted intensity in the absence and presence of iodine vapor. The iodine-free transmission was determined from a normalization scan. The projections were cor12VAPOR LI1GHT LAMBERTIAN SCATTERER ATTENUATED BY1:2 ,~
RCTAT1NG LASER SPOT
00.
a
0
0
0
\
00
90 PHOTO DETECTORS
ARGON LASER SOURCE
Fig. 1. Cutaway view of the fan-beam-geometry laser tomography apparatus. The 56-cm-diameter ring contains a localized iodine-vapor distribution. © 1984, Optical Society of America
271
July 1984 / Vol. 9, No. 7 / OPTICS LETTERS
is quantitatively confirmed by our experimental measurements.' 2 The autocorrelation of the RL kernel is Rfk}(0) = 12M2 a2
RtkI(t) = 2M 2a 2t2 ' t
Cm
40
A--
~~~~40 cm
j oII
Fig. 2. Two-dimensional image of the iodine-vapor cloud at a vapor density of 0.6 Torr. The peak absorption coefficient is 0.036 cm- 1 , which is 125 times greater than the noise level of the reconstructed image.
rected for fluctuations in laser power, variations in detector sensitivity, and absorption along the radial path from the rotating mirror to the Lambertian scatterer. The standard deviation of the reconstructed absorption at a point can be calculated from the statistics of the projection-data noise for many scans. Let hj (n) denote the noise in the projections, where j indexes a
0.08
If the correlation between the rays of the projections depends only on the angular separation of the rays within the fan, and if the noise in the projection data of one fan is uncorrelated with the noise in another fan, then the noise correlation may be written as
(hj(n)hj'(n'))= U,
E(Z 6n+tnhi, t
(3)
where a is the angular spacing between the rays within a fan. When Eq. (3) is inserted into Eq. (2), the noise power is seen to be inversely proportional to both the number of fans and the square of the spatial resolution. We experimentally investigated noise in our tomography system by constructing null tomograms in the absence of iodine. Figure 3(a) shows a comparison of the measured noise amplitude with the noise values predicted by Eq. (2) using the actual correlations of the data within the projections. The points in this figure represent tomograms made under a wide variety of conditions. Agreement between the theoretical and the experimental noise amplitude is excellent having a standard deviation of 0.015.
fan-source position and n indexes the ray within the fan.
2
0,
0.06
v
4 0.04 00
(1)
i_ 0.02
where f(t) contains the correlation spectrum of the noise normalized to the mean variance of the noise qp 2 in the fan and t is an index for the difference in angle between
rays. The reconstruction process convolvesthe projection data with a kernel function that determines the spatial
PREDICTED NOISE AMPLITUDE
resolution and spatial frequency response of the system. Various kernels can be generated by convolving the RL
NOISE vs
kernel k, which is band limited by the detector spacing, with a smoothing function s (n). The smoothing function reduces the noise sensitivity at the cost of degrading the spatial resolution. The rms noise amplitude a squared in the reconstructed image can be shown
to be' 2
Irms1
(a)
TRIANGULARFILTERWIDTH
N 1 THEORY N" , CORRELATIONS THEORY N w/ CORRELATIONS N
o-0 a
II
b
v eI
'2 = MOp2
(1 + 1/2 r23) E3f(t) a t n (1r2
Rfk}(t - n)Rts (n),
Io
(2)
where M is the number of fan-source positions on the full circle, r is the distance of the reconstructed point from the center of the fan-source circle normalized by the fan-source circle radius, and RI I denotes an operator for taking the autocorrelation of the function in the braces. In contrast to the parallel-beam geometry, noise in the fan-beam geometry -reconstructions depends on the location of the reconstructed point. The (I + 1/2 r2 )/(l - r2 )3 positional dependence of the noise
0
5 FILTER WIDTH (RAYSI.
10
(b)
Fig. 3. Actual noise amplitude measured from reconstructed
null tomograms. (a) Dots are measured points versus theoretical noise based on measured projections. (b) The solid and dashed lines are theoretically predicted noise with and without correlations, respectively.
272
OPTICS LETTERS / Vol. 9, No. 7 / July 1984
Figure 3(b) shows the noise-amplitude dependence on spatial resolution. The RL kernel was smoothed by convolving with a triangle filter of width d given by s(n)
=(d-Inl)/d 2 ,InI d,whichdegrades
the spatial resolution by approximately a factor of d. A
set of reconstructions was generated from the same data. The dots in Fig. 3(b) are the measured rms noise amplitude inside a circle that is 0.32 of the fan-source circle diameter. Zero decibels is defined as the noise
in a reconstruction of projections that have the same standard deviation as the actual data but are uncorrelated.
The solid curve is the value predicted by Eq. (2)
when the correlations of the noise are included. The dashed curve is the result for uncorrelated projections. A factor-of-3 reduction in the spatial resolution, while the angular separation between detectors and the number of fans is held constant, is adequate to obtain
nearly a factor-of-10 reduction in the noise. Laser speckle' 3 was the dominant noise source in our
experiment. The interference of coherent laser light scattered from the rough Lambertian scatterer gave rise
to the speckle at the detectors. It should be emphasized that laser speckle would not be a problem with incoherent light sources or if only one optical path from the
coherence source to the detector existed. Optical tomography is a two-dimensional quantitative imaging technique capable of detecting small ab-
of the image field. Unlike statistical noise, artifacts are
deterministic and have been extensively studied.14,"5 In conclusion, this is the first reported experimental study of optical tomography using the fan-beam geometry. Theoretical predictions of the noise sensitivity of the reconstructed image are confirmed. The authors acknowledge the assistance of G. W. Faris, M. M. Fejer, and J. E. Fouquet and the support provided by the U.S. Air Force Office of Scientific Research and the Stanford Energy Institute. References 1. J. C. McDaniel, D. Baganoff,and R. L. Byer, Phys. Fluids 25, 1105 (1982). 2. M. J. Dyer and D. A. Crosley, Opt. Lett. 7, 383 (1982). 3. G. Kychakoff, R. D. Howe, and R. K. Hanson, Appl. Opt. 23, 704 (1984). 4. M. B. Long, D. C. Fourguette, M. C. Escoda, and C. B. Layne, Opt. Lett. 8, 244 (1983). 5. D. R. Crosley, Opt. Eng. 20, 511 (1981). 6. Special Issue on Computerized Tomography, Proc. IEEE 71 (March
1981).
7. A. M. Cormack, J. Comput. Assisted Tomogr. 4, 658 (1980). 8. G. N. Hounsfield, J. Comput. Assisted Tomogr. 4, 665 (1980).
9. R. L. Byer and L. A. Shepp, Opt. Lett. 4,75 (1979).
sorption values. For example, the noise level in Fig. 2
10. R. J. Santoro, Int. J. Heat Mass Transfer 24, 1139
corresponds to an absorption-length product of 6 X For iodine, the minimum detectable concentra10-4.
(1981). 11. G. T. Herman, Comput. Biol. Med. 6, 259 (1976). 12. K. Bennett, G. W. Faris, and R. L. Byer, "Experimental
tion in 2-cm pixels is 5 parts in
106.
The noise theory
presented here permits the quantitative prediction of the acceptable projection noise for obtaining a desired noise level in the reconstructed
image.
In addition to statistical noise, the tomographic reconstruction process introduces artifacts into the image. Artifacts, which are evident as ridges emanating from the iodine cloud in Fig. 2, are caused by undersampling
optical fan beam tomography" (Appl. Opt., to be published); K. Bennett and R. L. Byer, "Fan beam tomography: noise theory" (submitted to J. Opt. Soc. Am. A). 13. M. Frangon,Laser Speckle and Applications (Academic, New York, 1979), Chap. 2. 14. D. C. Wolfe and R. L. Byer, Appl. Opt. 21, 1165 (1982). 15. P. M. Joseph and R. A. Schulz, Med. Phys. 7, 692 (1980).