Mar 21, 2010 - ments of the inhomogeneous Knight field from a photo-excited electron which acts on .... tion of an NMR spectrum measured in the âdarkâ using.
Optically tunable nuclear magnetic resonance in a single quantum dot M. N. Makhonin1 , E. A. Chekhovich1,2 , P. Senellart3 , A. Lemaˆıtre3, M. S. Skolnick1 , A. I. Tartakovskii1
arXiv:1002.0523v2 [cond-mat.mes-hall] 21 Mar 2010
1
3
Department of Physics and Astronomy, University of Sheffield, S3 7RH,UK 2 Institute of Solid State Physics, RAS, Chernogolovka, 142432, Russia, Laboratoire de Photonique et de Nanostructures, Route de Nozay, 91460 Marcoussis, France (Dated: March 23, 2010)
We report optically detected nuclear magnetic resonance (ODNMR) measurements on small ensembles of nuclear spins in single GaAs quantum dots. Using ODNMR we make direct measurements of the inhomogeneous Knight field from a photo-excited electron which acts on the nuclei in the dot. The resulting shifts of the NMR peak can be optically controlled by varying the electron occupancy and its spin orientation, and lead to strongly asymmetric lineshapes at high optical excitation. The all-optical control of the NMR lineshape will enable position-selective control of small groups of nuclear spins in a dot. Our calculations also show that the asymmetric NMR peak lineshapes can provide information on the volume of the electron wave-function, and may be used for measurements of non-uniform distributions of atoms in nano-structures.
Nuclear spins offer a nano-scale resource with extended spin life-times and coherence, leading to proposals to use nuclei for quantum computation [1–4] and coherent spin-memories [5]. Strong interest in nuclear spin effects in semiconductors has also been recently stimulated by research into manipulation of single spins in nano-structures, where the electron-nuclear (hyperfine) interaction plays an important role [6–8]. Direct control of nuclear spins by resonant techniques such as NMR is highly desirable for both electron and nuclear spin manipulation experiments. In the past NMR methods have been widely applied to large area semiconductor structures (heterojunctions, quantum wells etc) containing very large number of nuclei in the range 108 or more [4, 9–11]. Further refinement of these methods has made it possible to detect magnetic resonance of as few as 104 nuclei in otherwise abundant spin environments by detecting the optical response from individual GaAs quantum dot nano-structures [12, 13]. These micro-ODNMR experiments revealed strong dot-to-dot variation of resonant frequencies [14], arising from interaction of small nuclear spin ensembles with random Knight fields from single spins of localized electrons [15].
by employing the inhomogeneities of the Knight shifts, it becomes possible to access selectively, by appropriate resonant frequencies, small groups of nuclear spins located in different parts of the dot. This may be used for spatially-selective control of the nuclear spins in a nanometer-sized quantum dot. In addition, we show that the strong NMR frequency gradients induced by the localized electron may be used for detection with a few nm-resolution of non-uniform distributions of atoms inside nano-structures. The dependence of the NMR frequencies on the intensity and polarization of optical excitation arises from the optically-induced Knight field, Be , a result of the contact hyperfine interaction between an individual nuclear spin and an electron confined in the dot [16–18]. In an uncharged dot, as in our case, Be arises from the photoexcited electrons, with the time-averaged dot occupancy, F , and mean electron spin s, controlled by the intensity and polarization of light, respectively. The time-averaged magnitude of the Knight field for a nucleus with a hyperfine constant A at the position r depends on the nuclear gyromagnetic ratio γ and is given by [16]: Be =
In this work we take advantage of the strong gradients of the Knight field inside a quantum dot produced by the localized electron spin and enter a new regime of nano-ODNMR. By employing ODNMR techniques first reported in Refs.[12, 13], we measure with high precision the Knight shifts in the resonant frequencies of each individual isotope spin sub-system in individual GaAs/AlGaAs interface dots and find their dependence on the polarization and power of optical excitation. By varying the optical power, we find striking modifications of the lineshape of the NMR spectrum of the dot. These arise from the Knight field variation across the dot which in turn is determined by the spatial distribution of the electron wave-function. The interpretations are supported by calculations, which further demonstrate that
v0 A |ψ(r)|2 sF ¯ γZ h
(1)
Here v0 is the volume of the crystal unit cell, containing Z = 4 Ga or As nuclei. Be follows the distribution of the electron envelope function ψ(r) in the dot leading to the nuclear site-dependent field varying across the dot. In what follows the corresponding site-dependent Knight shifts in the NMR frequency given by ∆f = γBe /2π are measured with high precision in individual QDs. The sample investigated contains interface QDs formed naturally by 1 monolayer width fluctuations in a nominally 13 monolayer GaAs layer embedded in Al0.33 Ga0.67 As barriers (see growth details in Ref.[19]). In contrast to self-assembled quantum dot structures, the interface dots are formed by lattice-matched GaAs and AlGaAs layers, leading to reduced strain and weak
BRF
208 140
1.7076
1.7078
Photon energy (eV)
σ+
(a)
2Be
136
1.7074
15
(d) (b)
(c)
10 5
σ-
0
14.48
14.56 20.32
20.40
25.84
Radio frequency (MHz)
-45
0
Resonance shift (kHz)
Bext
(b)
212
EXZ (µeV)
PL intensity
RF off RF on
PL
(a)
laser
2
45
λ/4 plate angle
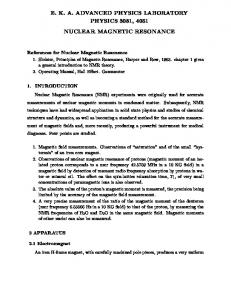
FIG. 1: (color online). (a) Diagram of the ODNMR experiment, depicting optical excitation and PL collection in the Faraday geometry, and the oscillating radio-frequency inplane B-field BRF . (b) PL spectra of the neutral exciton in a GaAs dot with and without RF excitation (black and gray symbols, respectively) at Bext = 2T. Lines show results of the peak fitting.
FIG. 2: (color online). Symbols show NMR spectra EXZ (fRF ) measured at moderate optical power of 0.5 µW at Bext = 2T for 75 As (a), 69 Ga (b), 71 Ga (c). Data obtained with σ +(−) excitation are fitted with the red (blue) line. Vertical lines mark positions of the NMR peaks. (d) Shift of the resonance frequency for 69 Ga as a function of the rotation angle of the λ/4 plate in the laser excitation path.
quadrupole effects, resulting in narrow NMR linewidths. This makes the interface dots an ideal test bed for future applications of ODNMR in III-V semiconductor nanostructures. Knight field effects detected by ODNMR are observable in a wide range of magnetic fields, in contrast to the all-optical detection confined to very low B-fields [17, 18]. The ODNMR setup is sketched in Fig.1a. External magnetic field Bext is applied in the Faraday geometry. Optical excitation is used for (i) pumping the nuclear spin via dynamic nuclear polarization (DNP)[12, 13, 17, 18, 18, 20–23] and (ii) to excite photoluminescence (PL) for measurements of the exciton Zeeman splittings in individual dots. The measurements were carried out at a temperature T =4.2 K. We use an excitation laser at 670 nm which generates electrons and holes in the quantum well (QW) states ≈ 130 meV above the QDs emission lines. PL was detected with a double spectrometer and a charge coupled device. As shown in Fig.1a, a coil was wound around the sample for RF excitation of the dots. The coil was excited by the output from a radio frequency (RF) generator and provided transverse magnetic fields BRF up to 0.6 Gauss. We study neutral dots. Fig.1b shows exciton PL spectra [21] measured for Bext = 2T under σ + polarized laser excitation with and without RF excitation (black and gray symbols, respectively). The two peaks observed in the spectrum belong to the exciton Zeeman doublet. Excitation with circularly polarized light results in the pumping of nuclear spins in the dot and gives rise to the Overhauser field BN [12, 13, 17, 18, 20–23]. BN is detected through the resulting change in the exciton Zeeman splitting, ∆EXZ = ge µB BN [ge electron g-factor, µB - Bohr magneton, BN is co-(anti-) parallel to Bext for σ − (σ + ) excitation]. Using lineshape fitting ∆EXZ is measured with an accuracy of ≈1µeV. RF excitation resonant with nuclear spin transitions in any of the three isotope subsystem contained in the dot (75 As, 71 Ga, 69 Ga
[12, 13]) leads to nuclear spin depolarization and consequent reduction of |BN |. This is observed in Fig.1b as a change in the splitting of the Zeeman doublet when RF excitation is applied. In what follows we will use the variation of the exciton Zeeman splitting upon optical or RF excitation to measure changes in the nuclear polarization on the dot. Fig.2 shows NMR spectra EXZ (fRF ) for 75 As, 69 Ga, 71 Ga at Bext = 2T recorded under simultaneous RF and circularly polarized laser excitation (a moderate pumping power, P of 0.5 µW is employed, corresponding to F ≈ 0.1). The spectra exhibit peaks and dips for σ − and σ + excitation, respectively, with a typical width of 8-10 kHz. Fig.2 shows a strong dependence of the resonance frequency on the polarization of optical excitation [15]. A change of the laser polarization leads to the change in the time-averaged electron spin s in Eq.1. When the polarization is tuned from σ + to σ − , the resonance frequency is also tuned gradually as shown in Fig.2d. The total frequency shift between the resonances measured for σ + and σ − excitation corresponds to twice the maximum average Knight field 2Bemax for a given optical power for nuclei of a particular isotope. For the moderate excitation power used in this experiment the following magnitudes of Bemax were found: Be (75 As) = 1mT, Be (69 Ga) = 0.57mT and Be (71 Ga) = 0.62mT. The above magnitudes of the Knight field are comparable with those reported for InGaAs QDs [17] (