Russian Physics Journal, Vol. 56, No. 2, July, 2013 (Russian Original No. 2, February, 2013)
OPTICS AND SPECTROSCOPY SPECTRAL AND LUMINESCENT PROPERTIES OF SUBSTITUTED 7-HYDROXYCOUMARINS AND THEIR SENSOR POSSIBILITIES R. M. Gadirov,1 L. G. Samsonova,1 T. N. Kopylova,1 N. I. Selivanov,1 V. P. Hilya,2 and V. V. Ishchenko2
UDC 535.376
Spectral and luminescent properties of substituted 7-hydroxycoumarins in solvents of various polarities are investigated and their luminescence spectra at temperature of liquid nitrogen are obtained. Sensor possibilities for ammonia vapor of coumarins in methylcellulose films are investigated. Keywords: coumarin, optical molecular sensor, protolytic forms, luminescence.
Most of the coumarin dye applications are based on knowledge of their spectral and luminescent properties and capability of intermolecular interactions and formation of protolytic forms. Thus, coumarins are widely used as laser active media intended for blue-green wavelength range, fluorescent labels, and sensors for various analytes [1]. There are quite a large number of works in which 7-amino-substituted coumarins are investigated, since they, as a rule, have high quantum fluorescence yield that allows one to create on their basis a number of efficient laser active media for tunable lasers. In the present work, the spectral and luminescent properties and the sensor capabilities of substituted 7-hydroxycoumarins with different substitutes in the 3rd and 7th positions are investigated. Lasing properties of these compounds have already been investigated in [2].
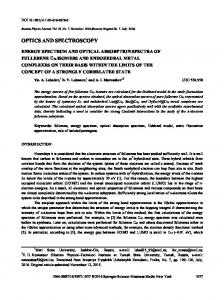
OBJECTS OF RESEARCH AND EXPERIMENTAL PROCEDURE Compounds of the coumarin series shown in Fig. 1 were chosen as objects of research. Names of compounds are not standard and are used for convenience of designations. The absorption and fluorescence spectra were measured with a CM2203 (Solar) spectrofluorometer. The temperature dependences of the luminescent properties were measured and the phosphorescence spectra were registered using a Cary Eclipse (Varian) spectrofluorometer in an Optistat DN cryostat (Oxford Instruments). The quantum yield was determined by the relative method [3] with coumarin 102 in ethanol (φ = 0.93) as an etalon [4]. The difference between the dipole moments in the excited (μe) and ground (μg) states was found from the dependence of the Stokes shift (Δν) on the orientational polarizability (ΔF) depending on the dielectric permittivity (ε) and the refractive index (n) of the solvent from the following formula [5]: Δν =
2 cha 3
ΔF (μe − μ g ) 2 + const ,
(1)
where c is the velocity of light, h is the Planck constant, a is the radius of the cavity occupied by the dye molecule, and
1
V. D. Kuznetsov Siberian Physical-Technical Institute at National Research Tomsk State University, Tomsk, Russia; Taras Shevchenko National University of Kiev, Ukraine, e-mail:
[email protected]. Translated from Izvestiya Vysshikh Uchebnykh Zavedenii, Fizika, No. 2, pp. 89–95, February, 2013. Original article submitted August 24, 2012. 2
1064-8887/13/5602-0213 ©2013 Springer Science+Business Media New York
213
O
O
O
CH3
CH3
N
O O
N S
O O
K1
O
S
O
O
O O
N
O
O
N S
HO
O
O
K3
K2
S HO
O
O
K4
Fig. 1. Structural formulas of the examined compounds.
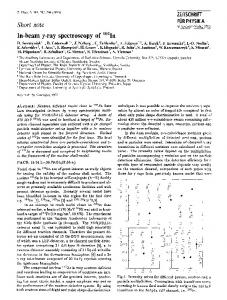
Fig. 2. Block diagram of the setup for investigation of sensor capabilities of coumarins (a) and photograph of the gas chamber with the cover removed (b) comprising sample 1, gas flow 2, light-emitting diode 3, optical filter 4, photodiode 5, collimator lens 6, optical fiber 7, UFPGS-4 device 8, spectrometer 9, and oscilloscope 10.
ΔF =
ε − 1 n2 − 1 − . 2ε + 1 2n2 + 1
(2)
The difference between the squared dipole moments μe2 − μ 2g for the molecule in the excited and ground states was also determined by the graphic method from the dependence of the sum of absorption (νabs) and fluorescence emission (νem) frequencies on the solvent function ΔF + 2 f ( n 2 ) [5]:
νabs + νem =
−2(μe2 − μ 2g ) cha3
(ΔF + 2 f (n2 )) + const ,
(3)
where
f (n2 ) =
n2 − 1 2n 2 + 1
.
(4)
The radius a of the cavity occupied by the molecule was determined by quantum-chemical calculations after optimization of the molecule geometry by the semi-empirical АМ1 method. To study the sensor capabilities of coumarins, the setup shown in Fig. 2 was used. An AvaSpec-2048-2 (Avantes) fiber optic spectrometer was used to register spectra, and an optical YG-17 filter was used to cut off exciting 214
1
10000
a
K2
K3
0.8
8000
K2 0.6
ϕfl
-1
Δv, cm
K1
b
6000
K4
0.4
K4
K1
4000
0
0.05
0.2
K3
0.1
0.15
ΔF
0.2
0.25
0.3
0
0.1
0.2
0.3
ΔF
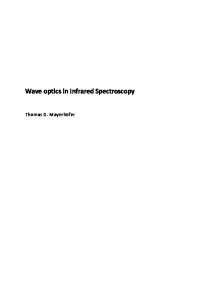
Fig. 3. Dependence of the Stokes shift (a) and quantum fluorescence yield (b) on the orientational polarizability of the solvent.
radiation. Registration was also performed with photodiodes. The photodiode current was measured with a TDS224 oscilloscope (the ratio of the luminescence signal intensity to the exciting light intensity was registered). A violet lightemitting diode (λ= 405 nm) was used as an excitation source. The gas flow was formed using the UFPGS device for forming gas mixture flows. Coumarin films in methylcellulose (MC) were prepared as follows: dimethylsulfoxide (DMSO) was poured into MC and hold in a shaker for 10 h; then undissolved MC was filtered out. After that, 1 ml of coumarin solution in DMSO with concentration of 10–3 mol/L was added to 1 ml of the prepared solution. The solution was put on a cover glass and rolled out in a centrifuge; then the film was dried in a vacuum drying oven at temperature of 90°С. RESULTS AND DISCUSSION In [2] it was demonstrated that the furan carboxylic group in the 7th position had no essential influence on the spectral and luminescent coumarin properties; however, it prevented the formation of anionic and zwitterion forms. Hydroxycoumarins in polar solvents are easily transformed into protolytic forms; therefore, to study the spectral and luminescent properties, it is convenient to use coumarins with furan carboxyl group in the 7th position. The spectral and luminescent properties of molecules in the indicated solvents are presented in Table 1. Based on the spectral and luminescent data obtained for examined coumarins, the dependence of the Stokes shift (Δν) on the orientational polarizability of the solvent was drawn (Fig. 3a). It can be seen that the experimental Stokes shifts for all coumarins lie on straight lines except Δν for K2 in ethanol, DMSO, and dimethylformamide (DMFA) (encircled in the figure), where the specific interactions change the molecule geometry [2]. The differences between the dipole moments and squared dipole moments were calculated using Eqs. (1)–(4). Based on these values, the dipole moments of the compounds in the ground and excited states were calculated (Table 2). As expected, the dipole moment changed for K3 going from S0 to S1 state, and for compounds K1 and K4, the direction of the dipole moment changed when going from the ground to excited state (the sign change when the direction of the dipole moment is changed). It should be noted that the accuracy of calculations (Eqs. (1) and (3)) of the dipole moments by the method described here depends significantly on the accuracy of determining the radius of the cavity occupied with a dye molecule.
215
TABLE 1. Spectral and Luminescent Properties of the Examined Compounds ε, M–1⋅cm–1 λfl, nm Neutral form K1 Hexane 372 – 434 CCl4 373 – 439 Acetone 366 – 442 Toluene 374 – 445 Ethyl acetate 367 – 442 Ethanol 368 28000 451 DMSO 373 25000 457 Cationic form K1 Ethanol 385 31800 480 DMSO 388 34800 480 Neutral form K2 Hexane 398 – 473 CCl4 387 – 484 Toluene 395 – 500 Trichlorethylene 394 – 504 Chlorobenzene 396 – 533 CHCl3 396 – 534 Diethyl ether 391 – 528 Ethyl acetate 389 – 552 THF 390 – 554 DMSO 393 17200 501 DMFA 398 – 502 Acetone 388 – 606 Ethanol 390 19200 507 Acetonitrile 386 – 612 Cationic form K2 DMSO 409 20000 – Ethanol 410 – – Neutral form K3 Hexane 380 – 444 Toluene 386 – 454 Ethanol 386 24000 456 DMSO 392 25900 466 Anionic form K3 Ethanol 446 29000 488 DMSO 464 36400 498 Cationic form K3 Ethanol 410 28600 480 DMSO 413 26800 490 Solvent λabs, nm ε, M–1⋅cm–1 λfl, nm Neutral form K4 Acetonitrile 396 – 496 Trichlorethylene 404 – 484 Toluene 398 – 484 Chlorobenzene 396 25000 500 Chloroform 398 – 500 Ethanol 398 29000 545 DMSO 402 24600 596 Anionic form K4 DMSO 474 44700 504 Ethanol 452 31000 495 Cationic form4 DMSO 429 34000 – Ethanol 425 36000 – Note* Non-fluorescent means that the compound does not fluoresce. Solvent
216
λabs, nm
Φfl
Δν, cm–1
0.9 0.84 0.82 0.95 0.95 0.95 0.65
3840 4030 4697 4266 4623 5000 4927
0.9 0.85
5170 4980
0.35 0.35 0.51 0.59 0.58 0.65 0.53 0.18 0.13 0.006 0.058 0.012 0.01 0.003
3984 5179 5317 5540 6491 6526 6636 7591 7590 5485 5205 9271 5917 9567
Non-fluorescent* Non-fluorescent*
– –
0.86 0.96 1.00 0.93
3800 3870 3870 4040
0.60 0.80
1900 1470
– – Φfl
3570 3790 Δν, cm–1
0.05 0.96 0.57 0.74 0.89 0.06 0.02
5091 4091 4464 5252 5126 3723 4384
0.50 0.49
1300 1700
Non-fluorescent* Non-fluorescent*
– –
TABLE 2. Dipole Moments of the Examined Coumarins Compound K1 K2 K3 K4
a, Å 5.03 5.43 4.61 5.14
μe – μg, D 5.7 15.8 2.5 2.0
μe2 – μg2, D2 16.20 –261.67 –45.52 –1.16
μ e, D 4.3 0.2 7.8 0.7
0.2 0 .1 8
3 00
a 1
2
Intensity, arb. units
D, arb. units
0 .1 4 0 .1 2 0 .1 0 .0 8 0 .0 6
3
0 .0 4
120 K
2 00 1 50
150 K
1 00
170 K 50
250 K
0 .0 2
0
0 30 0
79 K
b
2 50
0 .1 6
μg, D –1.4 16.0 10.3 –1.3
4 00
50 0
600
Wavelength, nm
7 00
290 K 3 00
4 00
500
6 00
70 0
800
Wavelength, nm
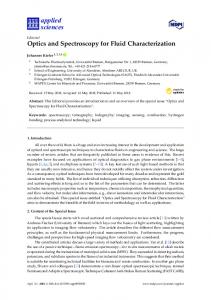
Fig. 4. Compound K2 in ethanol: a) absorption spectrum (curve 1), luminescence without delay (curve 2) and with a 100 μs delay from the excitation pulse (curve 3); b) fluorescence spectra of compound K2 in ethanol at the indicated temperatures. The absorption spectrum was registered at a temperature of 295 K.
The dependence of the coumarin fluorescence quantum yield on the solvent polarity is also of interest (Fig. 3b). Compounds K1 and K3 have a high quantum fluorescence yield irrespective of the solvent polarity. Compounds K2 and K4 in nonpolar solvents have high (~0.5–0.9) quantum yield that decreases almost to zero with increasing polarity. It was established that the fluorescence of K2 in ethanol increased with decreasing temperature, and its quantum yield at the temperature of liquid nitrogen was 0.35. In this case, the fluorescence wavelength and the bandwidth changed. Thus, at room temperature, the fluorescence bandwidth was 5100 cm–1, then the half bandwidth decreased to 3200 cm–1 and the fluorescence maximum shifted toward longer wavelengths (to 545 nm) when the temperature decreased to 170 K, and at temperatures close to the temperature of ethanol freezing, the radiation band was broadened and shifted toward shorter wavelengths (to 486 nm). The temperature dependence for K2 in ethanol is shown in Fig. 4. At a temperature of 77 K, the phosphorescence spectrum of K2 in ethanol was registered. The structure of the phosphorescence band was poorly expressed, though it should be taken into account that the signal was registered with wide slits of excitation and luminescence monochromators (20 nm). In the short-wavelength region, the long-delayed fluorescence was manifested at a wavelength of 500 nm close to the conventional fluorescence (486 nm) at 77 K. The phosphorescence lifetime was τphs (634) = 2 ms. The quantum yield and the fluorescence wavelength of compound K1 in ethanol remained virtually unchanged with decreasing temperature, and the vibrational structure was resolved in the fluorescence spectrum. We failed to register the phosphorescence of compound K1. The increased quantum fluorescence yield of compound K2 in ethanol with decreasing temperature (Fig. 4b) and the Stokes shifts of fluorescence of compound K2 in DMSO, DMFA, and ethanol (Fig. 3a) demonstrate that in these solvents, the molecule undergoes significant geometrical changes. In [2] it was demonstrated that such changes can be due to rotation of the benzodioxolyl azolyl in the 3rd position of coumarin caused by a significant change of the charge on this fragment excited to the S1 state. 217
0.2
a 0.004% 0.01%
0.02%
0.18
0.18
0.04%
1 0.14
2
0.12
0.16
0.14
Iphd, rel. units
Iphd, rel. units
0.002%
b
0.1%
Ispec, rel. units
0.18 0.16
0.2
0.2%
0.17
0.16
0.1 0.12
0.15
0.08 0.06
0
2000
4000
Time, s
0.1 6000
0.14
0
2
4
–log(C Nh3)
Fig. 5. Response of the sensor material of compound K4 on the MC substrate to ammonia vapor. Here curve 1 shows a signal from the fiber-optical spectrometer and curve 2 shows a signal from photodiodes (a). The response of the sensor material to ammonia vapor depending on the negative logarithm of the analyte concentration (b).
The anionic forms of compounds K3 and K4 have high quantum fluorescence yields (0.5–0.8). This special feature can be used to detect ammonia vapors. Methylcellulose was used as a substrate for the examined compounds. It should be noted that other materials (cellulose, polyethylene terephthalate, and SiO2 sol-gel films) were also tested as substrates; however, the best response was observed only for coumarins in MC films. In this case, compound K4 in DMSO, having very weak luminescence, started to fluoresce stronger after its mixing with MC solution in DMSO; however, the luminescence decreased a little in the process of film drying. The increase in the luminescence intensity for K4 film in MC was most likely due to flattening of dye molecules on polymeric MC lattice that hinders rotation of molecule fragments in the excited state. However, the fact that such effect was not observed in cellulose has not been understood yet. To study the sensor possibilities of coumarins in MC films, the setup shown in Fig. 2 was used. For low ammonia concentration in the gas mixture with argon (to 0.1%), the intensity of K3 luminescence slightly increased (compared to the signal without ammonia); however, at high concentrations of ammonia (exceeding 0.1%), the signal intensity decreased. This is due to the fact that at low NH3 concentrations, compound K3 forms the zwitterion form characterized by a wide band and high quantum fluorescence yield. For ammonia concentration exceeding 0.1%, the zwitterion form is destroyed, and K3 is transformed into the anionic form. This special feature does not allow K3 to be used as a sensor for ammonia vapors. Figure 5a shows dependences of luminescence signals of K4 in MC on the ammonia concentration in the gas mixture registered with the fiber-optical spectrometer (curve 1) and photodiodes (curve 2). It was established that the signal rise time to a level of 95% of the maximum was 90 s and the relaxation time was 27 min. The dependence of the luminescence signal intensity on the negative logarithm of the ammonia concentration is shown in Fig. 5, b. It can be seen that this dependence is close to a linear one. The minimum of ammonia concentration registered by such sensor was 0.002%. The sensor sensitivity can be improved by an order of magnitude by increasing the coumarin concentration in the film and using low-noise photodiodes.
218
CONCLUSIONS In this work, the spectral and luminescent properties of coumarin dyes have been investigated in different solvents and the dipole moments of molecules in the ground and excited states have been determined. Based on the material presented here, the obtained dependence of the K4 luminescence intensity on the ammonia content in the atmosphere allows us to develop a cheap sensor for the presence of ammonia vapors. The stand developed for investigation of the sensor possibilities can be used to study the luminescence of films in the presence of various analytes. This work was supported in part by the Federal Target Program “Scientific and Pedagogical Personnel of Innovative Russia” for 2009–2013 (item 1.3.1 of State Contract No. NK 180P). REFERENCES 1. 2. 3. 4. 5.
B. D. Wagner, Molecules, 14, 210–237 (2009). L. G. Samsonova, R. M. Gadirov, V. V. Ishchenko, et al., Opt. Spektrosk., 102, No. 6, 968–974 (2007). S. Parker, Photoluminescence of Solutions [Russian translation], Mir, Moscow (1978). A. N. Fletcher and D. E. Bliss, Appl. Phys., 16, 289–295 (1978). C. M. Golini, B. W. Williams, and J. B. Foresman, J. Fluoresc., 8, No. 4, 395–404 (1998).
219