VOLUME 8
JOURNAL OF HYDROMETEOROLOGY
FEBRUARY 2007
Orographic Precipitation and Water Vapor Fractionation over the Southern Andes RONALD B. SMITH
AND
JASON P. EVANS
Yale University, New Haven, Connecticut (Manuscript received 19 December 2005, in final form 9 May 2006) ABSTRACT The climatological nature of orographic precipitation in the southern Andes between 40° and 48°S is investigated primarily using stable isotope data from streamwater. In addition, four precipitation events are examined using balloon soundings and satellite images. The Moderate Resolution Imaging Spectroradiometer (MODIS) images taken during precipitation events reveal complex patterns of upstream open-cell convection over the ocean, stratus and/or convective clouds over the mountains, and sharp leeside clearing and roll convection over the steppe. Using the water vapor bands on MODIS reveals a sharp drop in column water vapor from about 1.4 to 0.7 cm across the mountain range. Seventy-one water samples from streams across the southern Andes provide deuterium and oxygen-18 isotope data to determine the drying ratio (DR) of airstreams crossing the mountain range and to constrain free parameters in a mathematical model of orographic precipitation. From the strong isotope fractionation associated with orographic precipitation, it is estimated that DR is ⬃50%, the highest value yet found for a mountain range. The cloud delay parameters in a high-resolution linear precipitation model were optimized to fit the streamwater isotope data. The model agrees well with the data when the cloud delay time (i.e., elapsed time from condensation to precipitation) is about 1700 s. The tuned model is used to discuss the small-scale spatial pattern of precipitation. The isotope data from streams are also compared with data from sapwater. The good agreement suggests that future isotope mapping could be done using trees.
1976), in southern Chile, “The orographic effects are probably as ‘pure’ and simple as can be found anywhere on earth. The range is relatively narrow and oriented perpendicular to the flow. The zone would undoubtedly make an excellent ‘laboratory’ for the verification of theoretical models of airflow over mountain and the resulting precipitation and cloudiness patterns.” The goal of this study is to determine the isotope fractionation of water vapor crossing the southern Andes and to use this information to estimate the drying ratio and test and calibrate a physical model of orographic precipitation. Because of the very sparse data network in the region, we focus on the following new datasets to assist in the analysis of local processes: Shuttle Radar Topography Mission (SRTM) data, Moderate Resolution Imaging Spectroradiometer (MODIS) imagery of cloud patterns, National Centers for Environmental Prediction–National Center for Atmospheric Research (NCEP–NCAR) reanalysis of approaching wind and humidity, and isotope data from stream and sapwood water. In addition, we use the new linear model of orographic precipitation (Smith and Barstad 2004) to predict the patterns of orographic pre-
1. Introduction The southern Andes are often mentioned as having the best example of upslope rain and rain shadow effects with precipitation ranging from 6000 mm yr⫺1 on the Chilean coast to less than 300 mm yr⫺1 in Argentina. The influence of the Andes on the climate of Patagonia was clear to Darwin in 1860: “In the southern part of the continent, where the western gales, charged with moisture from the Pacific, prevail, every island on the broken west coast, from 38° to the extreme point of Tierra del Fuego, is densely covered by impenetrable forests. On the eastern side of the Cordillera, over the same extent of latitude, where a blue sky and fine climate prove that the atmosphere has been deprived of its moisture by passing over the mountains, the arid plains of Patagonia support a most scanty vegetation” (Darwin 1962, p. 47). According to Prohaska (in Miller
Corresponding author address: Ronald B. Smith, Department of Geology and Geophysics, Yale University, New Haven, CT 06520-8109. E-mail:
[email protected] DOI: 10.1175/JHM555.1 © 2007 American Meteorological Society
JHM555
3
4
JOURNAL OF HYDROMETEOROLOGY
cipitation in the southern Andes. Data will be used to determine the critical parameters in the model. Our focus region, 40°–48°S latitude, coincides in Chile with the so-called Valdivian Rain Forest (Wilcox 1996). Understanding the modern precipitation processes in the region might help in interpreting the strong recent shifts in climate that have influenced the local forest vegetation (Moreno 2004) as well as the modern dry climates in the steppe (Patuelo and Sala 1995) and the snowfall on Patagonian glaciers (Warren and Sugden 1993; Hulton et al. 2002; Shiraiwa et al. 2002; Cook et al. 2003). Another motivation of the study is to understand the transport of water vapor between the Pacific and Atlantic basins, in connection with the ocean conveyor belt circulation (Zauker and Broecker 1992). The analysis of cross-mountain isotope gradients in the southern Andes was begun by Stern and Blisniuk (2002). They concluded that the highest terrain crossed by the westerly flow is the best predictor of isotope ratio in precipitation; it is better than other suggested predictors such as elevation, distance from coast, air temperature, etc. An aridity gradient zone in Argentina was analyzed isotopically by Schulze et al. (1996) to determine rooting depth and soil water fractionation. Isotope analysis in the corresponding midlatitude coastal ranges of the Northern Hemisphere has been reported for California by Friedman et al. (1992), for Oregon by Smith et al. (2005), and for Canada by Yonge et al. (1989) and Holdsworth et al. (1991). Paleoelevation interpretations of isotope data have been presented by Poage and Chamberlain (2001) and Rowley et al. (2001). In sections 2 and 3 we describe the climate of the region and the physical conditions during precipitation events. In sections 5, 6, and 7, we present the streamwater isotope data, the model description, and the model optimization. In section 8, we introduce the sapwood method of water collection.
2. Climatology of the southern Andes Descriptions of the climate of the southern Andes region are given by Hoffmann (1975), Miller (1976), and Stern and Blisniuk (2002). An introduction to the seasonal cycle of westerlies and storm tracks in the Southern Hemisphere is given by Trenberth (1991). Compared to the Northern Hemisphere, the Southern Hemisphere storm tracks shift less with season, staying near 50°S latitude. These cyclones bring pulses of strong westerly winds against the southern Andes throughout the year. The moisture in these winds derives from the Pacific Ocean, especially the cool north-
VOLUME 8
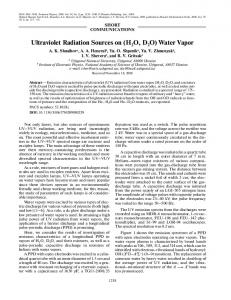
FIG. 1. Coastal wind rose showing the frequency of occurrence of 16 wind directions and speeds during rain events in the southern Andes. The length of each radial line indicates the percentage of occurrence of that wind direction. For example, a WSW wind blows 17% of the time. Its mean speed is 13 m s⫺1. Data were obtained from NCEP–NCAR reanalysis mean daily winds for 2005.
ward-flowing Humboldt Current. At the outer island stations such as Cabo Raper (46°50⬘S, 75°35⬘W), San Pedro (47°43⬘S, 74°55⬘W), and Evangelistas (52°24⬘S, 75°06⬘W), the precipitation is nearly constant throughout the year, with annual totals of about 2000, 4000, and 2600 mm, respectively. On the drier mainland, at stations such as Puerto Montt, Balmaceda, Cochrane, and Chile Chico, the winter months deliver more precipitation than the summer months. On the outer islands, the seasonal swing in air temperature is from 4° to 5°C. Evangelistas varies from 9° (summer) to 5°C (winter), while San Pedro varies from 11° (summer) to 6°C (winter). The temperature range is slightly larger farther inland. To establish the wind climate of the region, we used the NCEP–NCAR reanalysis (Mo and Higgins 1996). Selecting only rainy days for 2004, the wind rose for coastal Patagonia is shown in Fig. 1, for the average winds below 500 hPa. It shows clearly the dominance of westerly flow over the region. The average wind speed was 11 m s⫺1 with a standard deviation of 7 m s⫺1. The average wind direction was 273°. The wind was westerly 24% of the time. The wind direction fell in the range from WSW to WNW 60% of the time. Included in the wind rose are a few cases of rainy easterly flow that we suspect are spurious. The reanalysis is known to give unphysical drizzle from time to time. The reanalysis
FEBRUARY 2007
SMITH AND EVANS
5
FIG. 2. The southern Andes profile, as seen from the west. The maximum terrain elevation at each latitude is taken from the smoothed 1-km SRTM dataset. The marked peaks are Villarrica (V), Osorno (O), San Valentin (SV), and San Lorenzo (SL). The northern Patagonian Ice Field is seen near 47°S. Vertical exaggeration is about 200:1.
also shows a freezing level between 1 and 2 km, tilting downward as one moves southward. These westerly winds encounter a very complex glacially dissected terrain. The view from the west in Fig. 2 is computed from an SRTM dataset smoothed horizontally to 1 km, reducing the peak altitudes. It shows that on average, the airflow must lift about 2 km to pass over the southern Andes. A qualitative view of the precipitation pattern is available from the vegetation distribution observed using cloud-removed composite satellite images. In Fig. 3 we show the terrain (Fig. 3a) and the MODIS-derived annually averaged normalized difference vegetation index (NDVI; Fig. 3b). There is a striking contrast between the dense vegetation along the Chilean coast and the barren steppe in Argentina. The north and south Patagonian Ice Fields, the ocean, and some isolated snowy peaks show a negative NDVI. The intermediate NDVI values in the southwest coastal region represent mountain forests that are snow covered during a few winter months.
3. Physical conditions during orographic precipitation events While this study deals primarily with isotope evidence for climatically averaged conditions, we also examined four different precipitation events using conventional data to gain a sense of the typical physical conditions in the southern Andes (Table 1). The four cases were chosen based on the precipitation records from Isla Huafo (upstream) and Coyhaique (downstream). We chose events that fell in the year preceding
FIG. 3. The southern Andes terrain and vegetation: (a) terrain (SRTM) and (b) MODIS composite accumulated vegetation (NDVI) distribution. In (a), the brown peaks exceed 1500 m. In (b), the coastal forests have a high vegetation index (red) while the Argentine steppe has low vegetation (pale blue). The ocean, ice fields, and snowy mountain tops have negative NDVI (dark blue). The streamwater sampling sites are shown with circles. Three cities with IAEA data are shown for reference.
6
JOURNAL OF HYDROMETEOROLOGY
VOLUME 8
TABLE 1. Physical conditions during four orographic precipitation events. Soundings are taken at 1200 UTC; fluxes are computed up to 400 hPa. Event date
4 Jun 2004
27 Jun 2004
29 Oct 2004
5 Jan 2005
Julian day Isla Huafo precipitation (cm) Coyhaique precipitation (cm) Isla Huafo temperature (°C) Coyhaique temperature (°C) Puerto Montt wind speeds (at 850/500/250 hPa) (m s⫺1) Puerto Montt wind directions (at 850/500/250 hPa) Moist top/inversion (hPa) Freezing level (hPa) Puerto Montt RH (at 850 hPa) Comodoro River RH (at 850 hPa) Puerto Montt mass flux 103 kg m⫺1 s⫺1 Comodoro River mass flux 103 kg m⫺1 s⫺1 Puerto Montt WV flux kg m⫺1 s⫺1 Comodoro River WV flux kg m⫺1 s⫺1 DR Ocean clouds Mountain clouds Steppe clouds
156 5 2.5 3 9 15/37/80
179 4 2 5 8 32/44/73
303 0.5 0.5 8 8 11/32/43
005 2 0.8 10 12 11/39/75
295/290/295
279/270/255
300/260/270
275/290/300
750 880 81 31 132 135 87 104 ⫺19% Open cell Convective Roll convection
750 840 78 41 129 184 101 181 ⫺79% Open cell Convective Roll convection
750 850 73 7 163 146 150 66 56% Open cell Stratiform Irregular convection
the water sampling expedition in January–February 2005. The only available soundings for the region are Puerto Montt (station #85 799; 41°43⬘S, 73°10⬘W) for the upstream flow and Comodoro Rivadavia (station #87 860; 45°78⬘S, 67°50⬘W) on the Atlantic coast for the downstream flow. The former is too far north and sheltered by a low coastal range, and the latter is too far east, but they still provide useful constraints. In general, the incoming westerly flows are strong, warm, and moist, with strong positive wind shear. In three of the four cases, an inversion caps the moist layer at 750 hPa. The freezing level varies from 880 to 780 hPa. As expected, the relative humidity is lower at the downstream Comodoro station. For Table 1, we computed the mass and water vapor fluxes upstream and downstream. From the water vapor flux (F ) we can, in principle, derive the drying ratio (DR), the fraction of the incoming water vapor flux that is rained out over the mountains, that is, DR ⫽
Fupstream ⫺ Fdownstream P ⫽ . Fupstream Fupstream
共1兲
The two winter cases, perhaps by chance, gave consistent DR values of about 55% while the warm-season cases were inconsistent. The downstream fluxes were larger than the upstream fluxes, so that the drying ratios were negative. This unphysical result points to the difficulty in computing the drying ratio from sparse sound-
None 780 100 65 218 161 700 325 54% Open cell Stratiform/convective Roll convection
ing data. Unless the flow is rather steady and twodimensional, the air and moisture budgets derived from sparse soundings will be inaccurate (e.g., Smith et al. 2003). In Patagonia we have neither the sounding density, the rain gauge network, nor a radar system capable of estimating the drying ratio. Instead, an isotopic approach to DR estimation is proposed in section 4 below. In Fig. 4a, we show MODIS Terra 651-RGB false color composite image for the 5 January 2006 event (Table 1). The wavelengths used for red, green, and blue are 1.64, 1.2, and 0.64 m, respectively. In this color scheme, the ocean is dark blue, barren land is brown, and vegetation is green. In this January image, some vegetation is visible on the coastal island of Chiloe and near the eastern cloud edge. Clouds appear in blue and white. The absorption of channel 6 ( ⫽ 1.64 m) by ice clouds (King et al. 2004) is primarily responsible for the distinct appearance of the deeper convective clouds (shown in blue) over the mountains. Sensitivity to particle size may also be playing a role (Nakajima and Kin 1990). All four dates in Table 1 share some of the characteristics in Fig. 4, such as the well-defined upstream and downstream edges of the orographic cloud system and clearing over Argentina. In winter, however, a cirrus shield sometimes covers shallow convection. In spring and summer, shallow and deep convection are mixed together and high and low wave clouds are seen downstream.
FEBRUARY 2007
SMITH AND EVANS
7
The full-scene MODIS images (not shown) give better views of the upstream and downstream regions. Each case has open-cell convection over the Pacific Ocean with a cell diameter of about 25 km. This scale may control the deep convection over the terrain. Each case also has narrow downstream-oriented convective roll clouds emanating from the high terrain between the east–west-oriented glacial lakes. These roll clouds extend all the way to the Atlantic Ocean. To illustrate the airmass drying associated with orographic precipitation events, we used the near-infrared (NIR) water vapor absorption band at 0.936 m for 5 January 2006 to estimate the field of column-integrated water vapor (W ) following Gao and Kaufman (2003). The ratio of reflectance from MODIS band 18 (absorption peak) and band 2 (window) increases in drier air. Care must be taken to mask out clouds (too high) and oceans (too dark) using an NDVI threshold of 0.1. Forests and bare soil reflect NIR strongly and thus provide a good background for W determination. In Fig. 4b, reflected light from a few cloud-free western Chilean islands give upstream estimates of Wup⫽ 1.4 cm while downstream over the Argentine steppe we found Wdown ⫽ 0.7 cm on average. An alternative method, replacing band 18 with 19, gave similar values. Over the steppe, the values vary inversely with terrain elevation as the moist layer thins over high terrain. Note that the drying ratio from (1) can be estimated using DR ⫽ (Wup ⫺ Wdown)/Wup ⬇ 0.5 only if the winds are constant with height and position, which is probably an inaccurate assumption.
4. Streamwater sample collection and isotope analysis
FIG. 4. A satellite view of a precipitation event over the southern Andes on 5 Jan 2006. (a) Terra MODIS false color image (651-RGB). In this color scheme, soil is brown, vegetation is green, liquid clouds are white, ice clouds are blue, and snow is deep blue. Note the presence of convective clouds imbedded in the lower cloud layers. Ocean clouds west of 75°W are masked. (b) Column water vapor indicator from MODIS. In (b) the ratio of bands 18 and 2 is shown in pseudocolor with blue and red indicating moist and dry air, respectively. The ocean and clouds are masked. Note that the air entering the cloud system from the west (blue) carries far more water vapor than the air emerging from the eastern cloud edge (red and yellow).
The measurement of broad-scale precipitation isotope gradients across the Andes was carried out by sampling summer “base flow” streamwater. Seventyone streamwater samples were collected in Patagonia between 22 January and 5 February in 2005. The collection expedition started with a brief leg from Puerto Montt, Chile, southwest to Chiloe. Subsequently, the team drove east across the divide to Bariloche, Argentina, and south to Los Antiguos along Highway 40 in Argentina (Fig. 3a). Recrossing the Andes, they drove southwest to the River Nef, and then north along the Carrera Austral to Puerto Aisen, Chaiten, and back to Puerto Montt. The collection sites ranged from 40.7° to 46.7°S latitude on both sides of the Andean divide (Fig. 3a). Most of the samples were taken from small streams so that the catchment centroids were near the sample locations. At each site, GPS positions and landscape photographs were recorded. Samples were stored in
8
JOURNAL OF HYDROMETEOROLOGY
FIG. 5. Oxygen vs hydrogen isotope data for Patagonia streamwater samples. Note that the trend-line slope (8.0661) and intercept (9.0356) approximate the standard meteoric water line (slope ⫽ 8 and intercept ⫽ 10).
tightly sealed Vacutainers. In addition, at many sites, small twig samples were taken for water extraction (appendix A). In the driest areas of Argentina, in the warm season, the streambeds were dry so that only twig samples could be collected. A potential problem in water sampling is the inaccessibility of the outer Pacific islands of the Chonos archipelago. These outer islands have the first orography encountered by westerly winds and thus may catch the first rain to fall. In the north, the Chiloe visit satisfied the need for western sites. In the south, a small aircraft chartered from Puerto Aisen (west of Coyhaique) took the team to the island of Caleta Andrade, just west of the regional high terrain. No other extreme western sites were reached on this project. The satellite images are reassuring, however (Fig. 4a). They indicate that the orographic clouds do not extend west to the westernmost islands, so our sampling pattern might be sufficient. In March 2005, the streamwater samples were sent to Iso-Analytical Limited in the United Kingdom for hydrogen and oxygen isotope analysis. In June 2005, water was extracted from the tree samples (appendix A) and sent to the same laboratory for isotope analysis. The repeatability of the mass spectrometer analysis can be judged from the standard deviation of delta values from replicates of our two datasets and two sets of standards, that is, 1.12, 1.31, 1.85, and 2.67 ppt for deuterium, and similarly 0.08, 0.1, 0.1, and 0.09 ppt for oxygen. These small laboratory uncertainties have little if any impact on our analyses as the fractionation by the Andes is nearly 100 times greater. Sampling errors may be more significant. As expected, there is a strong gradient in measured isotope ratio across the Andes range. Samples from the west have typical ␦D ⫽ ⫺30, ␦18O ⫽
VOLUME 8
⫺4, while samples from the east are much “lighter” with ␦D ⫽ ⫺110, ␦18O ⫽ ⫺14. An electronic supplement containing the streamwater isotope data is available at DOI: 10.1175/JHM555s.1. The quality of the 2005 dataset can be partially evaluated by comparing the hydrogen and oxygen isotope ratios (Fig. 5). Under conditions of equilibrium fractionation, the two ratios should be strongly correlated. Large scatter from a linear relation usually suggests an error in storage or mass spectrometer analysis. For reference in Fig. 5, the meteoric water line is shown; that is, ␦D ⫽ 8␦18O ⫹ 10 (Dansgaard 1964). Data quality can also be judged against the International Atomic Energy Agency (IAEA) precipitation data from three sites in Table 2 (Fig. 3). We have included the isotope ratios from the streamwater collection site closest to each IAEA station. The agreement is satisfactory, suggesting that our streamwater samples are representative of long-term precipitation averages. This evidence supplements the general agreement between streamwater and precipitation shown by Kendall and Coplen (2001). Significant evaporation would destroy the correspondence between streamwater and precipitation. The deuterium excess is calculated and any samples with a value greater than 5 are excluded from the analysis. We also examined the published streamwater isotope data from Stern and Blisniuk (2002). Their sampling region (47°–48°S) is denser and smaller than ours. It lies east of the gap between the north and south Patagonia Ice Sheets, southwest and southeast of Cochrane. Their data confirmed the strong E–W isotope gradient but was of limited use in model testing or calibration (appendix D).
5. Drying ratio estimates According to the concept of Rayleigh fractionation, condensation preferentially removes the heavier isotopes so the remaining vapor becomes progressively lighter following RⲐR0 ⫽ ⌰␣⫺1,
共2兲
where R and R0 are the ratios of heavy-to-light isotope concentrations in the final and initial state vapor, ⌰ is the fraction of water vapor remaining, and ␣ is the fractionation coefficient (Friedman 1953; Dansgaard 1964). The condensate at each stage of fractionation will follow a similar rule, so using (1) and (2), DR ⫽ 1 ⫺ ⌰ ⫽ 1 ⫺ 共RP ⲐRP0兲1Ⲑ共␣⫺1兲,
共3兲
FEBRUARY 2007
9
SMITH AND EVANS TABLE 2. IAEA precipitation and nearby 2005 streamwater isotope data.
Station
No. of samples
␦18O IAEA precipitation
␦D IAEA precipitation
Precipitation (mm)
Stream site
␦18O stream
␦D stream
Puerto Montt Coyhaique Bariloche
⬃150 117 38
⫺6.68 ⫺11.45 ⫺12.31
⫺44.6 ⫺85.8 ⫺90.0
1723 1011 629
22-1 31-1 24-1
⫺7.04 ⫺11.53 ⫺12.26
⫺45.06 ⫺84.14 ⫺92.36
where RP and RP0 are the ratios of heavy-to-light isotope concentration in the upwind and downwind precipitation. The isotope ratios are represented by the “delta” value, ␦ ⫽ (R/RVSMOW ⫺ 1) ⫻ 1000, using Vienna Standard Mean Ocean Water (RVSMOW) as a reference. The fractionation factor in the exponent of (2, 3) is slightly temperature and phase dependent. If the vapor condenses to liquid at T ⫽ ⫺10°C, the fractionation factor for hydrogen/deuterium is about ␣D ⫽ 1.13 (Friedman and O’Neil 1977). If the heavy and light end points for deuterium are ␦DMAX ⫽ ⫺30 and ␦DMIN ⫽ ⫺110 ppt, then (3) gives a drying ratio of DR ⫽ 1 ⫺ 共0.890Ⲑ0.970兲
7.69
⫽ 1 ⫺ 0.52 ⫽ 0.48.
共4兲
Drying ratios computed with other assumptions for temperature and phase are given in Table 3. Repeating the calculation using oxygen, we take end points ␦18O ⫽ ⫺4 and ⫺14, and with ␣O ⫽ 1.0123 we obtain DR ⫽ 1 ⫺ (0.986/0.996)81.3 ⫽ 1 ⫺ 0.44 ⫽ 0.56 or DR ⫽ 56%. These drying ratio values exceed the previous estimates of DR ⫽ 43% for the Oregon climate transition (Smith et al. 2005) and DR ⫽ 35% for an event with southerly flow against the Alps (Smith et al. 2003). We now proceed to the primary focus of our study: the testing and calibration of a physical model of precipitation.
6. Model prediction of isotope ratio in precipitation To predict the spatial distribution of isotopes in rainfall over Patagonia we use the linear precipitation model of Smith and Barstad (2004; see appendix B) and the Rayleigh fractionation Eq. (4). According to the linear model, the precipitation P(x, y) is proportional to the horizontal water vapor flux, given approximately by F ⫽ qwUHw,
共5兲
where qw is the mixing ratio at the ground, Hw is the depth of the moist layer, and U is the average wind vector. For the present application, the linear model
had to be extended to handle the large drying ratio found in section 5 (appendix C). The model is run on an extended domain (39°–49°S, 69°–76°W) and further embedded in a tapered buffer zone. The model grid increment is 1 km using smoothed SRTM terrain. The vapor removed from the airstream is the integral of the precipitation rate along the wind direction: I共x, y兲 ⫽
冕
x,y
⫺⬁
共6兲
P共x⬘, y⬘兲 ds,
where ds ⫽ 共Udx⬘ ⫹ Vdy⬘兲Ⲑ | U | . The fraction removed is the local drying ratio DR(x, y) ⫽ I(x, y)/| F0| and the fraction remaining is ⌰ ⫽ 1 ⫺ DR. Note that both I(x, y) and F0 have the same units: kg m⫺1 s⫺1. Using (3), the delta value of the local precipitation is
␦⫽
冋冉
冊
册
␦0 ⫹ 1 ⌰␣⫺1 ⫺ 1 ⫻ 1000, 1000
共7兲
where ␦0 is the delta value of the first upstream rain. If the ocean evaporation and first cloud condensation are reversible so Rp0 ⫽ RVSMOW and ␦0 ⫽ 0, then (7) becomes
␦ ⫽ 共⌰␣⫺1 ⫺ 1兲 ⫻ 1000.
共8兲
As an example, if ␣ ⫽ 1.1 and DR ⫽ 0.2, then ⌰ ⫽ 0.8 and ␦ ⫽ (0.80.1 ⫺ 1) ⫻ 1000 ⫽ ⫺22. By using (8) with constant alpha, any latitude effect on the incoming isotope ratio was ignored. Now imagine that the region is subject to winds and
TABLE 3. Andes drying ratio estimates using deuterium values of ␦DMAX ⫽ ⫺30 and ␦DMIN ⫽ ⫺110 under different cloud assumptions. Cloud phase
Liquid
Ice
Temp (°C)
␣D
DR (%)
␣D
DR (%)
0 ⫺10 ⫺20
1.11 1.13 1.14
54 48* 46
1.13 1.15 1.17
48 44 40
* Equation (4).
10
JOURNAL OF HYDROMETEOROLOGY
VOLUME 8
TABLE 4. Combined efficiency E, c, and f for each model case.
␣D
␣O
Background precipitation
Full wind rose
Six directions
Three directions
1.11 1.14 1.17 1.11 1.14 1.17
1.012 1.0155 1.019 1.012 1.0155 1.019
0 0 0 1 1 1
⫺0.055, 0, 800 ⫺0.058, 600, 700 ⫺0.091, 500, 1200 0.240, 0, 800 0.344, 700, 700 0.358, 500, 1400
0.116, 500, 500 0.271, 600, 700 ⫺0.126, 900, 900 0.226, 200, 600 0.360, 500, 700 0.436, 800, 900*
0.240, 0, 500 0.311, 0, 900 0.335, 0, 1400 0.273, 0, 600 0.357, 500, 500 0.396, 100, 1500
* Overall “best” model.
precipitation events with different durations, directions, and strengths. These characteristics are used to group the rain events into classes. The average precipitation rate (during rain events) is given by P共x, y兲 ⫽
兺 P D Ⲑ兺 D , i
i
i
共9兲
i
i
where (Pi, Di) are the precipitation rate and duration for each event class “i.” The annual precipitation is the numerator of (9). The average normalized isotope ratio at each point is the mass-weighted isotope ratio for each event class. From (8)
␦共x, y兲 ⫽
兺 ␦ P D Ⲑ兺 P D , i
i
i
i
i
i
共10兲
i
where (␦i) is the isotope ratio for each class. If an event type produces little precipitation at a point (x, y), then the isotope ratio in that small rainfall event gets little weight in (10). Using many runs of the linear model, P(x, y) from (9) and ␦(x, y) from (10) are derived from the terrain, cloud physics, and water vapor flux climatology. Both P(x, y) and ␦(x, y) are invariant regional fields, independent of how many total rainfall events occur.
7. The determination of a “best” linear precipitation model Using the deuterium and oxygen-18 data from the streamwater samples taken in 2005, an optimization procedure was carried out to find the best values for parameters in the linear model. Five parameters were varied. First, the number of wind directions was increased from (a) only directions with frequency above 10% (i.e., 3 directions), (b) only directions with frequency above 5% (i.e., 6 directions), or (c) all 16 directions (Fig. 1). The advantages of reducing the number of wind directions are simplicity and computational speed, as well as eliminating the spurious cases of easterly flow in the NCEP–NCAR reanalysis. For each wind direction, only the average speed is used. The second parameter to be varied was the fraction-
ation factors for deuterium and oxygen. Here the fractionation factors are climatological and are chosen to represent, in a mean sense, all events in a year. As shown in section 3, significant variations in cloud temperature and phase exist within and between events leading to uncertainty in these values. Three sets of values were used, keeping a ratio of about 10 between the (␣ ⫺ 1) values for oxygen-18 and deuterium (Table 4). The third parameter to be varied was the background precipitation. The linear model allows a background precipitation to be added to that forced by terrain. We chose two values: 0 and 1 mm day⫺1. The fourth and fifth parameters are the cloud time delays in the model: the conversion time c and the fallout time f. The model was run for values of c and f ranging from 0 to 2400 s in steps of 100s. Other parameters such as moist layer depth (Hw ⫽ 3 km) and moist stability (Nm⫽ 0.003 s⫺1) and surface humidity (qw⫽ 0.005 kg kg⫺1) were kept constant, consistent with mean values. With all possible permutations, the number of model runs is about 24 000. Luckily, the linear model runs quickly on a workstation. For each parameter combination we calculated the root-mean-square error (RMSE) and the modified coefficient of efficiency (E ) between the modeled and observed water sample ␦ values (Legates and McCabe 1999):
RMSE ⫽
冑
1 N
N
兺 共O ⫺ P 兲 , i
共11兲
,
共12兲
2
i
i⫽1
N
兺 ⱍO ⫺ P ⱍ i
E⫽1⫺
i
i⫽1 N
兺 ⱍO ⫺ O ⱍ i
i⫽1
where N is the number of samples, O represents observed data, P represents the model-predicted value, and the overbar indicates the mean. The conventional correlation coefficient was also computed according to
FEBRUARY 2007
SMITH AND EVANS
FIG. 6. Tau-space map showing contours of combined efficiency (12) for finding the “best” combination of c and f using isotope data from streamwater. Each grid point represents many model runs with climatological winds, compared with observed streamwater isotope ratios. As tau values are interchangeable, only half the domain is shown. The diagonal structure of the contours suggests that only the sum of the tau values matters.
N
兺 共O ⫺ O兲共P ⫺ P兲 i
CC ⫽
冋兺
i
i⫽1
N
i⫽1
N
共Oi ⫺ O兲
2
兺 共P ⫺ P兲
2
i⫽1
i
册
.
共13兲
1Ⲑ2
The modified coefficient of efficiency (12) ranges from minus infinity to one. An E of zero indicates that the observed mean is as good a predictor as the model. Positive values indicate that the model is a better predictor than the observed mean, with higher values indicating better performance by the model. Here E is calculated for both the ␦D and ␦18O, and then averaged to obtain the “combined efficiency” [i.e., E ⫽ (ED ⫹ EO)/2]. Note that CC and E are dimensionless, while RMSE has delta units in this application. The optimization for cloud delay times is done by examining the efficiency (12) for 288 pairs of tau values (Fig. 6). The maximum E appears as a diagonal band in ⫺ space with many combinations of c and f producing similarly good fits to the observations. This suggests that it is important to have the total time delay right (in this case c ⫹ f ⬇ 1700 s) while the partition between the conversion and fallout time delays is less important. Table 4 indicates that with smaller fractionation coefficients or smaller background precipitation, the tuning gives shorter total taus. As shorter taus increase the model precipitation, less background precipitation and weaker fractionation are needed to match the strong
11
FIG. 7. Combined efficiency (12) plotted against the total cloud delay time. In this plot, only the highest fractionation factors (Tables 3 and 4), background precipitation values of 0 and 1 mm day⫺1 and wind statistics using 3, 6, and 16 directions are used. Note that the best results require a total cloud delay of about 1700 s.
observed fractionation. The optimum choice of six wind directions indicated that some wind variability is important, probably to smooth the fields, but that rainy easterlies should be excluded. Rainy easterlies either do not occur or make little contribution to the local water budget. The optimization process was repeated using other measures of fit [(11), (13)], but the results were similar. To illustrate the selectivity of the optimization, we show several tuning curves in Fig. 7. Only the highest fractionation factors are used (␣D ⫽ 1.17 and ␣O ⫽ 1.019) and the two taus are combined into a “total tau.” The tuning curves are rather sharply peaked. As in Table 4, the “best” model uses 1 mm day⫺1 of background precipitation, a six-point wind rose, and a total tau of 1700 s. The mean precipitation field produced by the best model is shown in Fig. 8 along with the accumulated precipitation field and isotope ratio field. The lowest isotope ratios are found east of the Chilean Ice Fields in the Argentine steppe. The comparison of observed and predicted isotope ratios is shown in Fig. 9. Both predictions are good. To illustrate other properties of the “best” linear model, we zoom into a small region near Puerto Aisen and Coyhaique in Chile (44°–46°S latitude, see Fig. 10). The model predicts a highly variable precipitation field, with maxima on the highest hilltops reaching 48 m yr⫺1. Deep nearby valleys receive only a tenth of this precipitation. These values should be scaled down by 30%–50% if, as we suspect, the NCEP–NCAR reanalysis overestimates the number of rainy days. The precipitation field would be smoother if cold air became
12
JOURNAL OF HYDROMETEOROLOGY
VOLUME 8
FIG. 8. Spatial predictions of the “best” model (a) average precipitation (kg m⫺2 s⫺1), (b) average accumulated precipitation (Giga kg m⫺1 s⫺1), and (c) deuterium isotope ratio (per mille).
trapped in the valleys, preventing the leeside descent (see section 9). To further evaluate the skill of the “best” model we can compare its deuterium prediction against that of other predictors: the highest upstream barrier from the site, the elevation of the collection site, and the latitude and the longitude of the collection site. Scatterplots for these variables are given in Fig. 11 and the fit of a linear regression model ␦ ⫽ Ax ⫹ B, as measured by (11), (12), and (13), is given in Table 5. The height of the upstream barrier does rather well with ED ⫽ 0.364 (see also Stern and Blisniuk 2002). Longitude has little skill, in spite of the general E–W isotope gradient. The linear physical model has better skill than these simple geographical predictors. Note in Table 5 that the “best” model prediction of deuterium has an efficiency (ED ⫽ 0.530) that is higher than its combined efficiency (E ⫽ 0.436) from Table 4. This suggests that noise in the oxygen data may be degrading the fit. Not surprisingly, the correlation, RMSE, and efficiency for deuterium prediction are even better when the model is tuned using only the streamwater deuterium data (i.e., ED ⫽ 0.610). As a further qualitative check on the “best” model, compare the predicted edge of the precipitation (Fig. 9) with the observed edge of the vegetation in Patagonia (Fig. 3b). In the latitude range from 42°–46°S, both edges lie near 72°W. Both the vegetation and the isotope data represent average conditions, smoothing out the event variability described in Table 1.
8. Mapping fractionation patterns with sapwood water In this section, we examine the possibility of using water sampled from sapwood, instead of streams, for
mapping geographic patterns of fractionation. Sapwater collection may have two possible advantages. First, as trees use local soil water and groundwater, the measurement has a higher spatial resolution than streamwater. Streamwater arises from rain over a finite size catchment and is transported downstream before collection. Second, in very dry locations, no streamwater is available in the dry season, yet bushes and small trees are still easy to find. The interpretation of extracted tree water involves additional assumptions and possible extraction errors. First, we assume that there is little fractionation as precipitating water enters the soil and moves into the plant roots. There is wide support for this view in the literature. A number of complicating issues are discussed by Dawson (1996), Ehleringer et al. (2000), and Williams and Ehleringer (2000). They show that different tree species, and even different populations within the same species, may draw water from different soil depths. Adjacent trees may then show isotope signatures from different precipitation seasons. We neglected differences in tree species and root depth. Second, we assume that our collection is dominated by up-moving water in the xylem rather than downmoving sugars in the phloem. Third, we assume that the extraction procedure did not fractionate the sample (appendix A). Lack of reproducibility in the oxygen-18 data suggest that the extraction did fractionate the oxygen slightly, so these data are not used herein. In our evaluation of the sapwater data, we begin with a comparison of deuterium ratios between collected streamwater and tree water from the same site (Fig. 12). The agreement is quite good. Considering that the sapwater data are an independent dataset (although most of the collection sites are
FEBRUARY 2007
SMITH AND EVANS
13
sapwater deuterium prediction (ED ⫽ 0.601) exceeds that of streamwater deuterium prediction (ED ⫽ 0.530) suggests that sapwater might give a better dataset for mapping than streamwater.
9. Discussion of nonlinear effects
FIG. 9. Observed vs “best” predicted isotope ratio at streamwater sites: (a) deuterium and (b) oxygen-18. These predicted isotope ratios are the same values used to tune the model.
common with the streamwater sites), we can use it to test our “best” model derived from the streamwater isotope data. According to Fig. 13, the “best” linear model gives a good prediction of the observed sapwater deuterium ratios. Comparing Tables 5 and 6, we see that the efficiencies and correlations are just as high as for the streamwater data, against which the model was tuned. This result adds credibility to our “best” linear model. The fact that the “best” model efficiency for
It should be clear to the reader that our optimization procedure for model parameters cannot overcome or even necessarily reveal fundamental problems with the formulation of the physical model (e.g., appendix B). An imperfect model, fitted to data, will give misleading results. Three potential problems associated with nonlinearity will be mentioned as a caution. First, is the issue of nonlinear stratified airflow dynamics. One aspect of flow nonlinearity is the trapping of air into deep valleys. Valleys filled with cold air will prevent leeside descent and drying (Zängl 2005). Cloudy air will pass over the valley while rain continues to fall. The dry north–south valleys shown in Fig. 10 may thus be artifacts of the linear model’s inability to capture cold air trapping. Recent time-lapse cloud photography by the lead author in Patagonian valleys suggests that the flow can switch back and forth between dry descent and rainy overflow. The cloud patterns in Fig. 4 do not reveal any small-scale descent into secondary valleys. Second is the question of stratiform versus convective clouds. According to Table 1, both situations can occur in Patagonia. With nonlinear convection, the characteristic time scales (taus) must be reinterpreted. They may correspond to the time needed for convective cloud development rather than the time for simple particle size conversion (see Fuhrer and Schär 2005; Kirshbaum and Durran 2005). Third is the issue of cloud physics nonlinearity. Not only is the Clausius–Clapeyron relation nonlinear, but there may be a nonlinear threshold condensation rate for the conversion of cloud water to rainwater (Jiang and Smith 2003). Such effects are partly parameterized in full numerical models (Colle 2004). Nonlinear processes cannot be fully captured by adjusting parameters in a linear model.
10. Conclusions The strong deuterium and oxygen-18 isotope fractionation in precipitation across the southern Andes can be readily measured using either streamwater or sapwater sampling. Both types of samples represent average precipitation over many weeks or months, smoothing over the interstorm variability. Streamwater has the advantage that no extraction is required. Sapwater sampling requires vacuum extraction in the labo-
14
JOURNAL OF HYDROMETEOROLOGY
FIG. 10. Zoom of “best” model precipitation field from 44° to 46°S: (a) terrain in meters and (b) total annual precipitation in meters (using NCEP event frequency).
FIG. 11. Scatterplots relating streamwater deuterium ratio to other indicators: (a) barrier elevation, (b) site elevation, (c) latitude, and (d) longitude.
VOLUME 8
FEBRUARY 2007
15
SMITH AND EVANS
TABLE 5. Skill of various predictors of deuterium isotope ratio (2005 stream data only). Model
CCD
RMSED
ED
Barrier elev Site elev Latitude Longitude Linear model (*␦D tuned) “Best” linear model
⫺0.873 ⫺0.490 0.462 ⫺0.637 0.941 0.938
11.46 20.50 20.86 18.13 9.97 12.33
0.364 ⫺0.727 ⫺0.715 ⫺0.232 0.610 0.530
* Model parameters optimized on stream deuterium data only.
ratory, but it allows higher spatial resolution and extension into dry areas where streambeds are usually empty. One objective here was to determine the drying ratio for a mountain range without an upper air, radar, or dense rain gauge network. Isotopes are well suited for this estimation. Using streamwater or sapwater and a Rayleigh model, the fractionation in the southern Andes indicates a maximum airstream drying ratio near to 50%, the largest value yet observed for a mountain range. The DR value is slightly sensitive to assumptions about cloud temperatures and phase. The second application of isotope data is to test and calibrate a linear model of orographic precipitation. Using statistical “efficiency” as our measure (12), we determined that a total delay time of c ⫹ f ⫽ 1700 s gives the best fit to the streamwater data. These same parameter values give a good fit to the sapwater data also. Isotope data correlate better with the linear model than with simple predictors like altitude, longitude, or highest upwind peak. The present Southern Hemisphere results are rather
FIG. 13. “Best” model prediction of sapwater deuterium data across the southern Andes. Note that the “best model” (i.e., tuned with streamwater data) is used here to predict the sapwater data.
similar to the previous Northern Hemisphere mountain isotope study in Oregon (Smith et al. 2005). There, the isotope values gave a drying ratio of about 43%, which in turn constrained the total time delay to be c ⫹ f ⬎ 1200 s. For the Olympic range in Washington State, Anders (2005) found that precipitation patterns using c ⫹ f ⬇ 1600 s agreed with output from a full numerical model. Other estimates for delay times are given by Barstad and Smith (2005). One key assumption, in estimating DR from precipitation isotopes and vice versa, is that the precipitation is drawn from a well-mixed water vapor reservoir passing aloft. A more robust approach would be to add isotopes to the cloud algorithms in a full numerical model to obtain an explicit prediction of the precipitation isotope ratio. This approach would take into account altitude dependence of cloud fractionation. In preparation for future modeling and field studies, we used surface, balloon, and satellite data to describe the typical physical conditions associated with the obTABLE 6. Predictions of observed sapwater ␦D.
FIG. 12. Deuterium from sapwater vs streamwater from sites where both were collected across the southern Andes. A trend line is shown with slope 0.9106 and intercept 0.9269.
Model
CCD
RMSED
ED
Barrier elev Linear model (*␦D tuned) “Best” linear model
⫺0.870 0.934 0.929
15.60 17.36 15.80
0.443 0.519 0.601
* Model optimized on stream deuterium data only.
16
JOURNAL OF HYDROMETEOROLOGY
served fractionation and orographic precipitation. The winds are consistently westerly and strongly sheared. The moist layer is about 2.5 km deep. The freezing level is usually between 1 and 2 km above sea level. In the postfrontal phase of precipitation events, open-cell oceanic convection drifts into the range. Clouds thicken and deepen over the mountains, including stratiform and convective clouds. The cloud-top temperatures are almost always below 273 K. The phase of water in the cloud tops varies between ice and supercooled liquid. Downwind, strong descent causes clearing but still allows characteristic troposphere wave clouds and persistent vigorous convective lines triggered by the lake– plateau landscape. In one case, the column water vapor decreased by a factor of 2 between the western islands and the eastern steppe. Acknowledgments. Sigrid R.-P. Smith gave valuable assistance in the field. Roland Geerken and Larry Bonneau at the Yale Center for Earth Observation assisted with the satellite image analysis. Alison Anders gave useful comments on the manuscript. Logistical assistance was given by Veronica and Jorge Ayling in Esquel and Isabel Anwandter in Puerto Aisen. Rene Garreaud contributed useful ideas. MODIS and SRTM data were from NASA and USGS. Comments from Peter Blisniuk and two anonymous reviewers improved the manuscript. Precipitation isotope data were taken from the IAEA Web site. The isotope data from this study are available from the corresponding author. This research was partly supported by the National Science Foundation, Division of Atmospheric Sciences (ATM0112354) and NASA (EOS/03-0587-0425).
VOLUME 8
pressure in the vacuum chamber during extraction is about 3 torr (mmHg) or 4 hPa. In theory, the equilibrium water content of wood exposed to such low pressures is very low (Chen and Lamb 2002), but heat and mass transfer constraints make that limit difficult to achieve. Evaporated vapor is trapped in a U-tube cooled with liquid nitrogen at a temperature between ⫺100° and ⫺190°C. The cold trap efficiency is usually better than 99%. The extraction process is allowed to proceed for 4 to 5 h. The frozen water in the U-tube is then melted, weighed, and poured into a Vacutainer for storage. Typical sample weights are as follows. For an initial stick mass of 12 gm, the water mass removed (and captured) is about 5 gm. After the vacuum transfer is complete, the sticks are placed in an oven at 100°C at atmospheric pressure for 18 h. Typically, the stick mass dropped another 0.5 gm in the oven (depending on species), indicating that not all the water was removed during the vacuum transfer. This problem introduces some uncertainty in the isotope data due to possible fractionation, but all sticks were handled similarly, so the error may be consistent. Some systematic error may arise, however, as the tree species varied from site to site, and perhaps systematically with climate zone. Different species have different water storage and porosity. Of 41 extracted water samples from 23 trees, 8 samples were excluded due to poor extraction percentage (7 samples) or poor isotope duplication (1 sample). Errors in extraction procedure seemed to influence the oxygen isotope values much more than the hydrogen values.
APPENDIX B APPENDIX A Water Extraction from Tree Samples All the tree samples came from 3–5-m-high bushes or trees where a small branch or stem was available at breast height for cutting. When a stream was present, the sampled trees were located 5 to 15 m away. From each tree, a branch about 1.5 cm in diameter was removed and three small sticks about 10 cm long were cut. The tree samples were stored in tightly sealed Ziploc plastic bags and refrigerated. The goal of the laboratory water extraction is to capture all the free water from the sapwood of the branch. The stick mass is limited to 15 gm to avoid clogging the cold trap. The bark is partially removed, but no attempt is made to isolate the active xylem. The stick is split lengthwise to give more surface area, put into a glass flask under vacuum, and heated to about 60°C. The
The Linear Theory (LT) of Orographic Precipitation The linear model (Smith and Barstad 2004) can be succinctly represented by the transfer function Pˆ共k, l兲 ⫽
Cw ihˆ共k, l兲 , 共1 ⫺ imHw兲共1 ⫹ ic兲共1 ⫹ if兲
共B1兲
in which the double Fourier transform of the terrain function, hˆ共k, l兲 ⫽ 共2兲⫺2
冕冕
h共x, y兲e⫺i共kx⫹ly兲 dx dy,
共B2兲
is multiplied by a transfer function (B1) to obtain the double Fourier transform of the precipitation rate field [Pˆ(k, l)]. The spatial pattern of precipitation rate is recovered from an inverse Fourier transform followed by truncation of negative values:
FEBRUARY 2007
17
SMITH AND EVANS
冋冉 冕 冕
P共x, y兲 ⫽ Max
冊册
Pˆ 共k, l兲ei共kx⫹ly兲 dk dl ⫹ P⬁ , 0 . 共B3兲
The units of P(x, y) are kg m⫺2 s⫺1. In (B1), Cw is a condensation coefficient related to the horizontal water vapor flux, and Hw is the depth of the ambient moist layer. The background precipitation caused by synoptic-scale uplift is P⬁. The intrinsic frequency is ⫽ Uk ⫹ Vl, and the vertical wavenumber is m共k, l兲 ⫽
冋冉
2 Nm ⫺ 2
2
冊
共k ⫹ l 兲 2
册
,
CCD
RMSED
ED
Barrier elev Site elev Latitude Longitude Linear model (*␦D tuned) Linear model
0.843 ⫺0.558 0.528 ⫺0.601 0.875 0.863
11.63 17.92 18.34 17.27 14.33 17.30
0.321 ⫺0.335 ⫺0.570 ⫺0.308 0.325 0.229
共B4兲
where Nm is the moist buoyancy frequency. The model is sensitive to the choice of time scales for cloud water conversion c and fallout f . Increasing the tau values reduces the total precipitation and the cross-mountain fractionation. Note that the two tau values are interchangeable in (B1). There are three important assumptions in LT. For the flow dynamics to be linear so that the airflow goes over the terrain, we need Nmh/U ⬍ 1. The column must be stable against moist convection (i.e., Nm ⬎ 0). Cloud linearity implies that precipitation will be proportional to condensation rate. For the water budget to be linear, the DR should be small compared to one (see below). Linear theory has been tested in Oregon (Smith et al. 2005), the Olympics (Anders 2005), and in California, Utah, and the Alps (Barstad and Smith 2005).
and ⌰ is the fraction of vapor remaining [as in (3)]. We also define the fraction of flux remaining as ⌰共x兲 ⫽ 1 ⫺ DR共x兲 ⫽ 1 ⫺
Correcting the Linear Theory for Reduced WV Flux A shortcoming of the linear theory is that it fails to account for the reduction of water vapor flux downwind. The linear theory in fact assumes that the precipitation at each point is proportional to the WV flux far upstream, instead of the flux value locally. This error can be significant when the model is applied to a large region with many mountains that can severely deplete the WV flux. We start with the assumption that the local precipitation rate [P(x)] is proportional to the local WV flux. To incorporate this idea, we scale the precipitation down with the local fraction of water vapor remaining. In one dimension, 共C1兲
where Pref is the precipitation field computed from the linear model using the upstreamwater vapor flux (F0),
冕
x
⫺⬁
P dxⲐF0.
共C2兲
Taking the downstream derivative of (C2) and using (C1) gives d⌰共x兲 ⫽ ⫺PREF 共x兲⌰共x兲 ⲐF0 dx
共C3兲
or d ln⌰(x)/dx ⫽ ⫺PREF /F0. Equation (C3) is an ordinary differential equation with solution, ⌰共x兲 ⫽ e⫺DRREF共x兲,
共C4兲
where DRREF is the drying ratio computed without the correction; that is, DRREF 共x兲 ⫽
APPENDIX C
P共x兲 ⫽ PREF 共x兲⌰共x兲,
Model
* Model optimized on deuterium data only.
1Ⲑ2
2
TABLE D1. Skill of various predictors of deuterium isotope ratio including all stream data [i.e., Stern and Blisniuk (2002) and present data] for comparison with Table 2.
冕
x
⫺⬁
PREF 共x兲 dxⲐF0.
共C5兲
When the fraction remaining is found from (C4) and (C5), the actual precipitation can be recovered from (C1). Note that (C4) has simple properties. For example, if the uncorrected model predicts a precipitation rate of P ⫽ 1 mm h⫺1 at a point where the DR was 75%, (C4) tells us that the actual ⌰ ⫽ 0.47 and DR ⫽ 53% and the precipitation rate [from (C1)] is P ⫽ 0.47 mm h⫺1.
APPENDIX D Using the Isotope Data from Stern and Blisniuk (2002) Several attempts were made to use the isotope data from Stern and Blisniuk (2002) in our analysis. Tuning the linear model to their data failed to achieve reasonable levels of skill. Adding our 2005 data to Stern and Blisniuk’s data improved the situation, but skill levels were still far below the skill level for the 2005 data by themselves (Table D1). Clearly, their data were degrad-
18
JOURNAL OF HYDROMETEOROLOGY
ing the fit. Their oxygen data are worse in this respect than their deuterium data. Finally, using our “best” model to predict the Stern and Blisniuk data gave negative efficiencies. We are not sure why the Stern and Blisniuk data did not add useful information to our study. It might be that that the tight clustering of their collection sites was not compatible with our model. Our model might be poor in this region. The problem could also be caused by data errors, as the deuterium–oxygen-18 plots for their data are much more scattered than in our Fig. 5, indicating noise. REFERENCES Anders, A. M., 2005: The co-evolution of precipitation and topography. Ph.D. thesis, University of Washington, 248 pp. Barstad, I., and R. B. Smith, 2005: Evaluation of an orographic precipitation model. J. Hydrometeor., 6, 85–99. Chen, Z. J., and F. M. Lamb, 2002: Theoretical equilibrium moisture content of wood under vacuum. Wood Fiber Sci., 34, 553–559. Colle, A. B., 2004: Sensitivity of orographic precipitation to changing ambient conditions and terrain geometries: An idealized modeling perspective. J. Atmos. Sci., 61, 588–606. Cook, K. H., X. Yang, C. M. Carter, and B. N. Belcher, 2003: A modeling system for studying climate controls on mountain glaciers with application to the Patagonian icefields. Climatic Change, 56, 339–367. Dansgaard, W., 1964: Stable isotopes in precipitation. Tellus, 16, 436–468. Darwin, C., 1962: The Voyage of the Beagle. L. Engel, Ed., Doubleday, 524 pp. Dawson, T. E., 1996: Determining water use by trees and forests from isotopic, energy balance and transpiration analyses: The roles of tree size and hydraulic lift. Tree Physiol., 16, 263–272. Ehleringer, J. R., J. Roden, and T. E. Dawson, 2000: Assessing ecosystem-level water relations through stable isotope ratio analyses. Methods in Ecosystem Science, O. Sala et al., Eds., Springer Verlag, 181–198. Friedman, I., 1953: Deuterium content of natural waters and other substances. Geochim. Cosmochim. Acta, 4, 89–103. ——, and J. R. O’Neil, 1977: Compilation of stable isotope fractionation factors of geochemical interest. USGS Professional Paper 440-KK, U.S. Geological Survey, Reston, VA. ——, G. I. Smith, J. D. Gleason, A. Warden, and J. M. Harris, 1992: Stable isotope composition of waters in southeastern California. Part 1: Modern precipitation. J. Geophys. Res., 97, 5795–5812. Fuhrer, O., and C. Schär, 2005: Embedded cellular convection in moist flow past topography. J. Atmos. Sci., 62, 2810–2828. Gao, B.-C., and Y. J. Kaufman, 2003: Water vapor retrievals using Moderate Resolution Imaging Spectroradiometer (MODIS) near-infrared channels. J. Geophys. Res., 108, 4389, doi:10.1029/2002JD003023. Hoffmann, J. A. J., 1975: Atlas Climatico de America Sur. World Meteorological Organization, 28 pp. Holdsworth, G., S. Fogarasi, and H. R. Krouse, 1991: Variation of the stable isotopes of water with altitude in the Saint Elias Mountains of Canada. J. Geophys. Res., 96, 7483–7494. Hulton, N. R. J., R. S. Purves, R. D. McCulloch, D. E. Sugden,
VOLUME 8
and M. J. Bentley, 2002: The Last Glacial Maximum and deglaciation in southern South America. Quat. Sci. Rev., 21, 233–241. Jiang, Q., and R. B. Smith, 2003: Cloud time scales and orographic precipitation. J. Atmos. Sci., 60, 1543–1559. Kendall, C., and T. B. Coplen, 2001: Distribution of oxygen-18 and deuterium in river waters across the United States. Hydrol. Processes, 15, 1363–1393. King, M. D., S. Platnick, Y. Ping, G. T. Arnold, M. A. Gray, J. C. Riedi, S. A. Ackerman, and K.-N. Liou, 2004: Remote sensing of liquid water and ice cloud optical thickness and effective radius in the Arctic: Application of airborne multispectral MAS data. J. Atmos. Oceanic Technol., 21, 857–875. Kirshbaum, D. J., and D. R. Durran, 2005: Observations and modeling of banded orographic convection. J. Atmos. Sci., 62, 1463–1479. Legates, D. R., and G. J. McCabe, 1999: Evaluating the use of “goodness-of-fit” measures in hydrologic and hydroclimatic model validation. Water Resour. Res., 35, 233–241. Miller, A., 1976: The climate of Chile. Climates of Central and South America, Vol. 12, W. Schwerdtfeger, Ed., Elsevier, 113–129. Mo, K. C., and R. W. Higgins, 1996: Large-scale atmospheric moisture transport as evaluated in the NCEP/NCAR and the NASA/DAO reanalyses. J. Climate, 9, 1531–1545. Moreno, P. I., 2004: Millenial-scale climate variability in northwest Patagonia over the last 15,000 yr. J. Quat. Sci, 19, 35–47. Nakajima, T., and M. D. King, 1990: Determination of the optical thickness and effective particle radius of clouds from reflected solar radiation measurements. Part I: Theory. J. Atmos. Sci., 47, 1878–1893. Patuelo, J. M., and O. E. Sala, 1995: Water losses in the Patagonian Steppe: A modeling approach. Ecology, 76, 510–520. Poage, M. A., and C. P. Chamberlain, 2001: Empirical relationships between elevation and the stable isotope composition of precipitation and surface waters: Considerations for studies of paleoelevation change. Amer. J. Sci., 301, 1–15. Rowley, D. B., R. Pierrehumbert, and B. S. Currie, 2001: A new approach to stable isotope-based paleoaltimetry: Implications for paleoaltimetry and paleohypsometry of the High Himalaya since the Late Miocene. Earth Planet. Sci. Lett., 188, 253–268. Schulze, E. D., and Coauthors, 1996: Rooting depth, water availability, and vegetation cover along an aridity gradient in Patagonia. Oecologia, 108, 503–511. Shiraiwa, T., S. Kohshima, R. Uemura, N. Yoshida, S. Matoba, J. Uetake, and M. A. Godoi, 2002: High net accumulation rates at Campo de Hielo Patagonica Sur, South America, revealed by analysis of a 45.97m long ice core. Ann. Glaciol., 35, 84–90. Smith, R. B., and I. Barstad, 2004: A linear theory of orographic precipitation. J. Atmos. Sci., 61, 1377–1391. ——, Q. Jiang, M. Fearon, P. Tabary, M. Dorninger, J. Doyle, and R. Benoit, 2003: Orographic precipitation and airmass transformation: An Alpine example. Quart. J. Roy. Meteor. Soc., 129B, 433–454. ——, I. Barstad, and L. Bonneau, 2005: Orographic precipitation and Oregon’s climate transition. J. Atmos. Sci., 62, 177–191. Stern, L. A. and P. M Blisniuk, 2002: Stable isotope composition of precipitation across the southern Patagonian Andes. J. Geophys. Res., 107, 4667, doi:10.1029/2002JD002509.
FEBRUARY 2007
SMITH AND EVANS
Trenberth, K. E., 1991: Storm tracks in the Southern Hemisphere. J. Atmos. Sci., 48, 2159–2178. Warren, C. R., and D. E. Sugden, 1993: The Patagonian icefields: A glaciological review. Arct. Alp. Res., 25, 316–331. Wilcox, K., 1996: Chile’s Native Forests. NW Wild Books, 148 pp. Williams, D. G., and J. R. Ehleringer, 2000: Intra- and interspecific variation for summer precipitation use in Pinyon-Juniper Woodlands. Ecol. Monogr., 70, 517–537. Yonge, C. J., L. Goldenberg, and H. R. Krouse, 1989: Isotope
19
study of water bodies along a traverse of southwestern Canada. J. Hydrol., 106, 245–255. Zängl, G., 2005: The impact of lee-side stratification on the spatial distribution of orographic precipitation. Quart. J. Roy. Meteor. Soc., 131, 1075–1091. Zauker, F., and W. S. Broecker, 1992: The influence of atmospheric moisture transport on the freshwater balance of the Atlantic drainage basin: General circulation and observations. J. Geophys. Res., 97, 2765–2773.