osteoporosis detection. The image processing was performed to obtain the shape-based features of the porous trabecular bone on both the dental radiograph ...
(IJACSA) International Journal of Advanced Computer Science and Applications, Vol. 6, No. 9, 2015
Osteoporosis Detection using Important Shape-Based Features of the Porous Trabecular Bone on the Dental X-Ray Images Enny Itje Sela
Rini Widyaningrum
Department of Informatics STMIK AKAKOM Yogyakarta, Indonesia
Department of Dentomaxillofacial Radiology Faculty of Dentistry Universitas Gadjah Mada Yogyakarta, Indonesia
Abstract—Osteoporosis screening using dental X-Ray images has been growing an interesting research. Existing methods for osteoporosis screening have been performed using the dental periapical or panoramic in X-Ray images. There was limited research using both the periapical and panoramic due to the expensive cost of obtaining data. This paper presents a combination of the periapical and panoramic images for osteoporosis detection. The image processing was performed to obtain the shape-based features of the porous trabecular bone on both the dental radiograph images. The important features were selected from the extracted features. These selected features were chosen for osteoporosis detection using the decision tree. The quantitative evaluation used confusion matrix. It was found accuracy rate to be 73.33%, sensitivity rate to be 72.23, and specificity rate to be 72.23% for data testing. Keywords—dental X-Ray; feature selection; Detection; porous trabecular bone
I.
osteoporosis
INTRODUCTION
Dentists often use radiographs images to support their diagnosis [1][2][3]. The panoramic and the periapical radiograph is kind of extra oral and intraoral assessment which is very widely used by dentists because it is fast, easy to operate, and its cost is relatively inexpensive. Changes in trabecular and cortical mandible radiographically appearing on the images are the first sign of osteoporosis which can be found by dentists [4]. Low bone density is one indicator of the occurrence of osteoporotic fracture. The screening of bone mass density (BMD) is an ideal method for early detection of osteoporosis [5][6][7]. Screening BMD using dual technique X-ray absorptiometry (DXA) is the gold standard for osteoporosis diagnosis [3]. Using a densitometer for osteoporosis diagnosis can be performed on the arms, spine, and thigh [20]. One of the results of measurements of bone density using DXA is a T-Score. Based on WHO criteria, the T-score can be interpreted in 3 categories, which are normal bone density, low bone density (osteopenia), and osteoporosis (brittle bones) [8]. However, screening of osteoporosis using DXA is relatively expensive for Indonesian, and not all hospitals in Indonesia have this tool. Also, DXA still has a limitation because it cannot describe the bone microarchitecture. Bone microarchitecture is quite parameter in the assessment of bone
quality [9]. Several studies have been done related to the osteoporosis screening using the periapical radiograph images [10][11][12] as well as the panoramic radiograph images [7][13][14]. However, studies using these images for Indonesian are still limited. Also, detection using both images had not performed yet due to the lack of data. The selection of features is one of the important stages before detection of osteoporosis. One of the feature selection methods used by [11][13][14] is a decision tree. Then, the selected features can be used to detect osteoporosis. Previous studies in [15] had performed porous features selection but they used only the periapical images for osteoporosis screening. This study proposes a model for detection of osteoporosis through the panoramic and periapical radiograph images using the selected shape-based porous trabecular bone features. These features were performed by [13][15]. Using both images will be expected increase the performances of detection. The model is expected as an alternative for DXA. II.
RELATED WORKS
A. Panoramic In study [5], panoramic radiographs of 100 postmenopausal women who had had BMD assessments of the lumbar spine and the femoral neck were used osteoporosis detection. Experienced oral radiologist determined the position of the mental foramen on 100 digitized dental panoramic radiographs. After determination of the mental foramen, mandibular cortical width below the mental foramen was measured automatically with a computer-aided system by identifying the area of interest, enhancing the original image, determining inner and outer margins of the cortex, and selecting an appropriate point. There were statistically significant correlation between cortical width measured by the computer-aided system and spinal BMD and femoral neck BMD. These correlations were similar with those between cortical width by manual measurement and skeletal BMD. Sensitivity and specificity for identifying postmenopausal women with low spinal BMD by the computer-aided system were about 88.0% and about 58.7%, respectively. Those for identifying postmenopausal women with low femoral neck BMD by this system were about 87.5% and about 56.3%, respectively. Cortical width measured by this system was
247 | P a g e www.ijacsa.thesai.org
(IJACSA) International Journal of Advanced Computer Science and Applications, Vol. 6, No. 9, 2015
compared with BMD of the lumbar spine and the femoral neck.
women who have undergone menopause. The inputs of model were 69 images of the panoramic and periapical radiograph.
In this paper [17], an extraction method of trabecular structures from dental panoramic radiographs using mathematical morphological operations is proposed. It can extract trabeculae excluding roots of teeth and enables the assessment of tooth extraction for trabecular pattern. A measurement method of the lengths and directions of trabecular segments is also proposed in this paper. It is suggested that the measurements of healthy and osteoporotic examples support our hypothesis that the trabeculae parallel to the roots are reduced more than those perpendicular to the roots by osteoporosis.
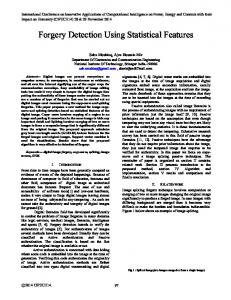
B. Dental X-Ray All periapical X-Ray images were collected from the Department of Radiology of Prof. Soedomo Dental Hospital, Faculty of Dentistry Universitas Gadjah Mada, as in [10][15]. Panoramic radiograph performed using Panora deluxe dental X-ray unit with the voltage setting, currents, strong, and successive exposure time, were 70-80 kVp, 12mA, and 12 s. The panoramic radiography processing is done digitally using DBSWin 4.5, Durr Dental. In [16] also used these images for obtaining the correlation between the trabecular texture features and BMD. Fig.1 shows the periapical and the panoramic images.
In this paper [18] proposed a new method for detecting osteoporosis using Weighted Fuzzy ARTMAP from the features measured in dental panoramic radiographs. The method developed an activation match function by integrating Simplified fuzzy ARTMAP and symmetric Fuzzy ART. Fourier method and segmentation processing were applied for obtaining features of a radiograph in frequency and spatial domain. The experimental results for osteoporosis detection show that the new method achieved accuracy of 87.88%, sensitivity of 93.33%, and specificity of 83.33%. B. Periapical This study [15] aims to select the important features from the combination of porous trabecular pattern with anthropometric features for osteoporosis screening. The study sample has their bone mineral density (BMD) measured at the proximal femur/lumbar spine using dual-energy X-ray absorptiometry (DXA). Morphological porous features such as porosity, the size of porous, and the orientation of porous are obtained from each dental radiograph using digital image processing. The anthropometric features considered are age, height, weight, and body mass index (BMI). Decision tree (J.48 method) is used to evaluate the accuracy of morphological porous and anthropometric features for selection data. The study shows that the most important feature is age and the considered features for osteoporosis screening are porosity, vertical pore, and oblique pore. The decision tree has considerably high accuracy, sensitivity, and specificity. Reference [19] used the dental periapical radiograph images for extracting porous trabecular features. Then, the decision tree with C4.5 method was performed to obtain selected porous features. The usage of confusion matrix to evaluation performance neural network classification had the accuracy, sensitivity, specificity to be 85.71%, 86.90 %, and 85.84%, respectively. Calculating the area under the ROC curve (AUC) results 0.8171 or 81.71%. III.
MATERIALS
A. Subjects Ethical clearance for this study was obtained from the unit and advocacy ethics of Dentistry Faculty, Universitas Gadjah Mada, Yogyakarta, Indonesia. The research sample obtained from a previous study [10][13] [15] on Javanese Indonesian
A.
B.
Fig. 1. Dental Periapical X-Ray Image, B. Dental Panoramic X-Ray
C. BMD Assessment of BMD on femoral neck and lumbar spine carried out from the Department of Radiology Dr. Sardjito Hospital using densitometer DXA. The specifications of DXA are 76kV, 1.5mA, during 1 min 14s (femoral), and 1 min 27s (spine). We classified subjects into one of three groups according to the WHO classification. These BMD were also used in [10][13][14][15]. But, in this study, we used only classification which was normal (N) and osteoporosis (OP). IV.
METHODOLOGY AND DESIGN
A. Methodology On Fig. 2 shows research methodology. The first step is selection ROIs from the panoramic and the periapical images. Each image of panoramic was selected 3 ROI from anterior, right posterior, and left posterior. For each periapical image was selected 1 ROI. So, we had 4 ROI for a subject. The mandibular trabecular bone images obtained from each ROI subsequently processed using digital image method as in [10][13][15]. The second step is images processing on all ROI which are segmentation and porous feature extraction. After segmentation, we extracted the shape-based features of the porous trabecular images. The third step is feature selection. For obtaining the potential features as the predictor of osteoporosis, we selected these features using the decision tree method. The class targets were normal (N) and osteoporosis (OP). Finally, the selected features were used as input for detection. The last steps are detection and evaluation. On detection process, 15 data were tested using decision tree by tracing from root to the node of the tree, on selected features. The performance of detection was shown using confusion matrix.
248 | P a g e www.ijacsa.thesai.org
(IJACSA) International Journal of Advanced Computer Science and Applications, Vol. 6, No. 9, 2015
Then, shape-based porous trabecular features were extracted from binary images. This process obtained 6 features on each ROI, so there were totally 24 features on a subject. The name of the features was based on the main characteristics of the porous i.e the porosity, the size of pore, and orientation of the pore [10][13][15]. Furthermore, these features are named according to the ROI location and characteristics. A total of 24 features were obtained : OAnPor (porosity anterior), OAnJK (small pore anterior), OAnJB (large pore anterior), OAnV (vertical pore anterior), OAnH (horizontal pore anterior), OAnM (pore anterior oblique), OKaPor (right posterior porosity), OKaJK (small pore posterior right), OKaJB (large pore posterior right), OKaV (right posterior vertical pore), OKaH (right posterior horizontal pore), OKaM (pore sloping right posterior), OKiPor (left posterior porosity), OKiJK (small pore posterior left), OKiJB (large pore posterior left), OKiV (left posterior vertical pore), OKiH (left posterior horizontal pore), and OKiM (left posterior oblique pore). The features were extracted from the periapical images: Por (porosity), JK (small pore), JB (large pore), V (pore oblique), H (pore horizaontal), and M (pore oblique). The result of
selection features using decision tree was the major features as the predictor of osteoporosis (Fig. 5).
Fig. 2. Research Methodology
V.
RESULT
Fig. 3 shows the examples of the selection of ROI anterior 100x100 pixels, the right posterior ROI 92x85 pixels, and the left posterior ROI 92x85 pixels, using methods that have been implemented in previous studies [10][15].
A
B
Fig. 5. ROI of trabecular bone from digitized X-Ray
C
Fig. 3. Result of the panoramic ROIs: A. anterior, B. right posterior, C. left posterior
The example of the segmentation on ROI images is a binary image as shown in Fig. 4. Also, it was used a software as in [10][13][14].
Of the 24 features, there are 7 features that play a role in the detection of osteoporosis: OKiJK, OkiPor, Por, OanJK, H, OkaV, and OanPor. Table 1 shows the result of evaluation of training on 54 data. From 54 data, 49 data can be detected correctly. It consists of 30 as normal class and 19 as osteoporosis class. Thus the average value of sensitivity was 90.69%, and the average value of specificity was 90 055%. Furthermore, the selected features were used for testing on 15 data. Table 1 shows the confusion matrix as the results of testing process. TABLE I.
A
B
C
Fig. 4. Segmented the panoramic images A. anterior, B. right posterior, C. left posterior
Normal (N) Osteoporosis (OP) Total
Normal (N) 7 2 9
CONFUSION MATRIX Osteoporosis (OP) 2 4 6
Total 9 6 15
249 | P a g e www.ijacsa.thesai.org
(IJACSA) International Journal of Advanced Computer Science and Applications, Vol. 6, No. 9, 2015
The selection of features was used in training phase. This method had been performed in previous studies [10] [11] [15] but these studies used mandibular trabecular ROI on periapical and panoramic radiographs separately. In this study, an important feature on the detection of osteoporosis using panoramic and periapical radiograph images is porosity. It is represented at the left anterior, the right anterior, and the periapical. Moreover, small pore at the left posterior and anterior, horizontal pore on the periapical, vertical pores in the left posterior also contribute for osteoporosis screening. These results are similar to previous studies [15] which state that the most important feature on the detection of osteoporosis using periapical radiograph image is the porosity. The most important features found in this research that features small pore on the part of the left posterior (OkiJK) is similar to the study [13], but it did not make the process of detection of osteoporosis. Accuracy value of this research is using the panoramic and periapical images which is still not as good as the accuracy of the value of research [5][17][18][19]. The difference of value occurs because (1) the type of image that is used in all four studies did not use the panoramic and the periapical images, (2) the difference in the number of images, (3) extracted features method, and (4) methods of identification. This study is one of the first steps to build an intelligent system of detection of osteoporosis using either dental panoramic and periapical radiograph images. The idea of drafting an intelligent system of detection of osteoporosis using dental panoramic radiographs and periapical has been delivered approximately one decade ago [3] [5] [11] [20]. The utilization of dental radiographs to build an intelligent system requires a multidisciplinary collaboration involving dentists and developers of computer systems. Dentists play a role as experts who can interpret radiographs, as well as a user of the intelligent system that will be built. Several studies are still being developed, but studies using both the panoramic and the periapical radiographic images for Indonesian are still very limited. VI.
[2]
[3] [4]
[5]
[6] [7]
[8]
[9] [10]
[11]
[12] [13]
[14]
CONCLUSION
Based on the research that has been done, there can be drawn some conclusion as follows: 1) The proposed model could performed for osteoporosis detection using the selected porous trabecular bone features 2) Using the decision tree, the selected features for the detection of osteoporosis on panoramic and periapical images are OKiJK, OkiPor, Por, OanJK, H, OkaV, and
[15]
[16]
OanPor
3) The results of performance detection obtained accuracy, sensitivity, specificity are 73.33%, 72.23%, and 72.23%, respectively. For further study, there needs to be plan to carry out detection of osteoporosis using supervised learning methods. The class is a class that used normal, osteopenia, and osteoporosis. [1]
REFERENCES H.I. Othman, and S.A. Ouda, Mandibular radiomorphometric measurements as indicators of possible osteoporosis in celiac patients.
[17] [18]
[19]
[20]
JKAU: Med. Sci., vol.17, no.2, pp.21-35, DOI: 10.4197/Med. 17-23, 2010. M. Primiarti, B. Kiswanjaya, and H.B. Iskandar, Radiographic evaluation of osteopororsis through detection of jaw bone changes: a simplified early osteoporosis detection effort, Makara Kesehatan, vol.14, no.2, pp.51-56, 2010. S.C. White, Oral radiographic predictor of osteoporosis, Dentomaxillofac. Radiol, vol.31, pp. 84-92, 2001. P.C.A. Watanabe, A. Farmer, M.G.C. Watanabe, and J.P.M Issa, 2008, Radiographic signal detection of systemic disease: Orthopantomographic radiography, Int. J. Morphol., vol.26, no.4, pp.915-926, 2009. A.Z. Arifin, A. Asano, A. Taguchi, T. Nakamoto, M. Ohtsuka, and K. Tanimoto, Computer-aided system for measuring the mandibular cortical width on panoramic radiographs in osteoporosis diagnosis, Proceeding of the SPIE Medical Imaging, vol. 5747, pp.813-821, 2005. G.M. Blake, and I. Fogelman, The role of DXA bone density scans in the diagnosis and treatment of osteoporosis, Postgrad Med J., vol.83, pp.509-517, 2007. T. Nakamoto, A. Taguchi, M. Ohtsuka, Y. Suei, M. Fujita, M. Tsuda, M. Sanada, Y. Kudo, A. Asano, and K. Tanimoto, A computer-aided diagnosis system to screen for osteoporosis using dental panoramic radiographs, Dentomaxillofac. Radiol, vol.37, pp. 274-281, 2008. A. Gulsahi, S. Ozden, A.I. Cebeci, N.O. Kucuk, C.S. Paksoy, and Y. Genc, The relationship between panoramic radiomorfometric indices and the femoral bone mineral density of edentulous patients, Oral Radiol, vol.25, pp.47-52, 2009. M.L. Brandi, Microarchitechture: the key to bone quality. Rheumatology, vol.48, pp.iv3-iv8, 2008. E.I Sela, S. Hartati, A. Harjoko, R. Wardoyo, and Munakhir MS, Segmentation on the dental periapical X-Ray images for osteoporosis screening, IJACSA, vol.4, no.7,pp. 147-151, DOI: 10. 14569/IJACSA.2013.040720, July 2013. R. Licks, V. Licks, F. Ouriqe, H.R. Bittencourt, and V. Fontanella, Development of a prediction tool for low bone mass based on clinical data and periapikal radiography, Dentomaxillofac. Radiol., vol.39, pp. 224-230, 2010. BD. Lee, and S.C. White., Age and trabecular features of alveolar bone associated with osteoporosis, Oral Surg Oral Pathol Oral Radiol Endod, Elsevier Inc., 2005. E.I. Sela, and R. Widyaningrum, Pemilihan fitur bentuk porus tulang trabekula mandibula pada radiograf panoramik untuk deteksi osteoporosis, Proceeding Forsila II ISBN: 9786021145135, Unisula Press, Semarang, 2005. R. Widyaningrum, and S. Lestari, The correlation between mandible trabecular texture parameter on panoramic radiograph with bone mass density, Proceeding of The International Symphosium of Advanced Clinical Approach for The Prevention of Dental Caries and Implicated Diseases, Yogyakarta, Indonesia, pp. 206-214, 2013 E.I Sela, S. Hartati, A. Harjoko, R. Wardoyo, and Munakhir MS, Feature selection of the combination of porous trabecular with anthropometric features for osteoporosis screening, IJECE, vol.5, no.1, pp 78-83, ISSN: 2088-8708, DOI: 10. 11591/ijece v5i1. 6922, 2015. W.G.M. Geraets, J.G.C. Verheij, P.F. van der Stelt, K. Horner, C. Lindh, K. Nicopoulou-Karayianni., R. Jacobs, E.J. Marjonovic, J.E. Adams, and H. Devlin, Selecting Regions of Interest on Intraoral radiographs for Predictions of Bone Mineral Density, Dentomaxillofac Radiol, vol. 37, pp. 375-379, 2008. A. Asano, T. Tambe, A.Taguchi, C.M. Asano, 2006, Extraction of trabecular structures of mandible excluding tooth roots on dental panoramic radiographs using mathematical morphology, vol.3, 2006. D. Herumurti , A.Z Arifin, R. Sulaeman, A. Asano, A Taguchi, T. Nakamoto , K. Uchimura, Weighted Fuzzy ARTMAP for Osteoporosis Detection, 16th Korea-Japan Joint Workshop on Frontiers of Computer Vision, 2008. E.I. Sela, S. Hartati, A, Harjoko, R. Wardoyo, M. Mudjosemedi, Dissertation: Shape-based features extraction model of the porous trabecular bone on the dental periapical radiograph images for osteoporosis screening, Universitas Gadjah Mada, Yogyakarta, 2014. Kemenkes RI. Keputusan Menteri Kesehatan Republik Indonesia No. 1142/Menkes/SK/XII/2008 tentang Pedoman Pengendalian Osteoporosis.
250 | P a g e www.ijacsa.thesai.org