Open Journal of Urology, 2015, 5, 57-64 Published Online May 2015 in SciRes. http://www.scirp.org/journal/oju http://dx.doi.org/10.4236/oju.2015.55009
Does an “Overactive to Underactive Bladder Transition” Phenomenon Exist in a Rat Lumbar Spinal Canal Stenosis Model? Noritoshi Sekido1, Jun Kida2, Daisuke Wakamatsu2, Hiroki Okada2, Hidekazu Matsuya2 1
Department of Urology, School of Medicine, Faculty of Medicine, Toho University Medical Center Ohashi Hospital, Tokyo, Japan 2 Group2 Discovery Research Laboratories, Ono Pharmaceutical Co., Ltd., Osaka, Japan Email:
[email protected] Received 11 April 2015; accepted 6 May 2015; published 8 May 2015 Copyright © 2015 by authors and Scientific Research Publishing Inc. This work is licensed under the Creative Commons Attribution International License (CC BY). http://creativecommons.org/licenses/by/4.0/
Abstract Purpose: To investigate the association between the maximum cystometric capacity (MCC) and other cystometric parameters in lumbar canal stenosis (LCS) rats. Material and Methods: One small hole was drilled at the fifth lumbar vertebral arch (Sham), and a rectangular piece of silicone rubber was then placed in the epidural space (LCS) of Wister rats. Two weeks after surgery, awake cystometry was performed. LCS rats were divided into three groups: Group A (n = 5, MCC < 0.87 mL), Group B (n = 13, MCC 0.87 - 1.81 mL), and Group C (n = 14, MCC > 1.81 mL). Cystometric parameters were investigated in sham and LCS groups. Results: MCC did not significantly correlate to the frequency of non-voiding contractions (NVCs), voided volume (VV), or maximum intravesical pressure during voiding (Pmax), but significantly positively correlated to postvoid residual urine volume (PVR) and residual urine rate (RUR) (Spearman’s correlation coefficients (ρ) = 0.8973 (p < 0.0001) and 0.4915 (p = 0.0068), respectively). Compared with the sham rats, LCS rats in each group revealed significantly smaller VV, larger RUR, and lower Pmax. On the other hand, among LCS rats, VV, RUR, and Pmax were not significantly different. The frequency of NVCs in each LCS group was not significantly different from that in sham-operated rats (Tukey-Kramer’s HSD test). However, a Jonckheere-Terpstra trend test revealed a significant trend toward higher NVCs in the order of sham, Groups C, B, and A (p = 0.036). Conclusions: LCS rats showed the same degree of detrusor underactivity regardless of MCC. NVCs did not significantly increase in LCS rats with decreased MCC, but the trend toward higher NVCs with smaller MCC was significant.
Keywords Underactive Bladder, Detrusor Underactivity, Lumbar Canal Stenosis, Animal Model, How to cite this paper: Sekido, N., Kida, J., Wakamatsu, D., Okada, H. and Matsuya, H. (2015) Does an “Overactive to Underactive Bladder Transition” Phenomenon Exist in a Rat Lumbar Spinal Canal Stenosis Model? Open Journal of Urology, 5, 57-64. http://dx.doi.org/10.4236/oju.2015.55009
N. Sekido et al.
Overactive Bladder
1. Introduction A recent clinical study demonstrated that underactive bladder (UAB) could be preceded by overactive bladder (OAB) which is regarded as a compensatory mechanism for decreased shortening velocity [1]. Early detrusor underactivity (DU) is frequently accompanied by detrusor overactivity (DO, 68%), while advanced DU is not (18%). In a basic experiment, Nomiya et al. investigated bladder function in an atherosclerosis rat model that was induced by endothelial injury of the internal iliac artery with a high cholesterol diet [2]. These rats manifested an OAB phenotype in a metabolic cage study and on awake cystometry. However, in vivo muscle strip studies showed impaired detrusor contractility. Based on these studies, some researchers proposed the existence of an “OAB to UAB transition” [3]-[6]. Recently, we reported a rat model of lumbar canal stenosis (LCS) as a UAB model [7] [8]. This model was created by insertion of a small piece of silicone rubber into the L5 to L6 epidural space to compress the cauda equina, and it reveals features of infrasacral neuropathic bladder (NB), namely, impairment of voiding efficiency and a decrease in detrusor contractility. Unexpectedly, maximum cystometric capacity (MCC, mL) in some LCS rats became smaller than that in sham rats, which is why MCC in LCS rats (1.58 ± 0.68 mL, mean ± SEM) was not significantly different from that in sham rats (1.34 ± 0.23 mL) [7]. In clinical settings, it was reported that DO was noted in 29% of LCS patients [9]. This phenomenon seemed to be caused by irritation of the sacral roots, ischemic disturbances of the conus medullaris, or decentralization of the parasympathetic ganglia situated within the bladder wall [9] [10]. In this study we investigated whether MCC was increased in LCS rats. Our hypotheses were: 1) voiding parameters in LCS rats with normal or decreased MCC would be better; 2) the frequency of non-voiding contractions (NVCs, /min) would be increased in LCS rats with decreasing MCC.
2. Materials and Methods All experiments were approved by the Animal Experimental Committee of Ono Pharmaceutical Co., Ltd. This study further explored awake cystometric findings from a previous study [7]. The procedures of model preparation and the awake cystometric study are briefly described as below. Model preparation: Female Wistar rats (180 - 190 g, CLEA, Inc., n = 32) were anesthetized with pentobarbital (40 mg/kg, i.p.: Schering-Plough Animal Health), and the fifth and sixth lumbar vertebral arches were exposed. One small hole (1.5 mm in diameter) was drilled at the fifth vertebral arch. A rectangular piece (3.5 × 5.0 × 0.5 mm) of silicone rubber (Yamanaka Chemical Ind., Ltd.) was then inserted into the L5 - L6 epidural space. LCS rats underwent bladder expression at least twice a day. An identical surgical procedure was performed on control sham-operated animals (n = 10) except that the silicone rubber was not placed in the epidural space. An aliquot of urine was collected before each experiment and examined microscopically for leukocytes in order to rule out significant urinary tract infection (UTI). As shown in the previous study [7], UTI was not identified on urinalysis at CMG, and histological studies of the bladder specimens showed no obvious qualitative difference between sham and LCS rats. Also, there was no significant renal impairment on blood chemistry at the time of CMG. The cystometric study was performed 14 days after surgery in the present study. Awake cystometry (CMG): Cystometric investigations were performed without any anesthesia in a restraining cage (W 80 mm × L 300 mm × H 150 mm, Yamanaka Chemical Ind., Ltd.) 3 d after suprapubic bladder catheter implantation in 10 sham-operated rats and 32 LCS rats. Micturition volumes were measured by a fluid collector connected to a force displacement transducer (NSI-022, BrainScience Idea Co., Ltd.) placed under the urethral orifice. The bladder catheter was connected via a T-tube to a pressure transducer (DX-100, Nihon Kohden Corp.) and a microinjection pump (Terufusion Syringe Pump TE-311, Terumo Corp.). Room temperature saline was infused into the bladder at a rate of 2 mL/h. All rats were given 60 min to acclimate to test conditions before starting CMGs. Residual urine volume was measured after each micturition reflex by evacuating the bladder through the cystometric catheter. Cystometric parameters were acquired three times for each rat, and data from the second and third measurements were analyzed. The cystometric parameters investigated were MCC; frequency of NVCs per min, which is characterized by fluctuations in intravesical pressure larger than 3.04 mmHg
58
N. Sekido et al.
without voiding [11]; voided volume (VV, mL); postvoid residual urine volume (PVR, mL); and maximum bladder pressure during micturition (Pmax, mmHg). The residual urine rate (RUR, %) was calculated by the equation (PVR ÷ (VV + PVR)) × 100. Cystometric data are presented as the mean ± SEM. The correlation of MCC or the frequency of NVCs with other cystometric parameters was assessed with Spearman’s correlation coefficient (ρ). We considered |ρ| ≥ 0.7 as being strongly correlated, 0.7 > |ρ| ≥ 0.5 as being correlated, 0.5 > |ρ| ≥ 0.3 as being weakly correlated, and 0.3 > |ρ| as being uncorrelated. Then, the LCS rats were divided into three groups: Group A (n = 5, MCC < 0.87 mL, Figure 1), Group B (n = 13, MCC 0.87 1.81 mL, Figure 1), and Group C (n = 14, MCC > 1.81 mL, Figure 1). These ranges corresponded to less than −2SD, −2SD to +2SD, and more than +2SD of MCC in sham rats, respectively. First, Cystometric parameters including NVCs, VV, PVR, RUR, and Pmax, were investigated in sham and LCS groups using an analysis of variance (ANOVA) test. When the results from ANOVA revealed a statistical significance, then, Tukey-Kramer’s HSD test was performed as a post-hoc test. Finally, we examined whether a Jonckheere-Terpstra trend test revealed a significant trend toward higher NVCs in the order of sham, Groups C, B, and A. Analysis was performed by JMP 9.0.2 (SAS Institute Inc.). For all statistical tests, p < 0.05 was considered significant.
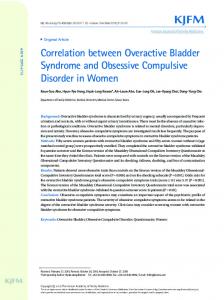
3. Results 3.1. MCC vs. VV, PVR, RUR, and Pmax MCC was not significantly correlated to VV, or Pmax, but was significantly positively correlated to PVR and RUR (Spearman’s correlation coefficients (ρ) = 0.8973 (p < 0.0001) and 0.4915 (p = 0.0068), respectively, Table 1, Figure 2). In sham and each LCS group ANOVA revealed statistical differences (p < 0.0001) in VV, PVR, RUR, and Pmax. Compared with the sham rats, LCS rats in each group revealed significantly smaller VV, larger RUR, and lower Pmax. On the other hand, among LCS rats VV, RUR, and Omax were not significantly different (Table 2, Figure 3). VV in LCS rats ranged from 0.062 ± 0.086 mL to 0.141 ± 0.058 mL. PVR in Group A (0.50 ± 0.14 mL) was significantly smaller than in Group B (1.3 ± 0.087 mL) or C (1.92 ± 0.094 mL), (a)
(b)
(c)
Figure 1. Representative cystometric traces of each group. (a) Group A: the range of MCC corresponds to less than −2SD of MCC in sham rats. Maximum cystometric capacity (MCC), 0.80 mL; the frequency of non-voiding contractions (NVCs), 0.33/min; (b) Group B: the range of MCC corresponds to −2SD to +2SD of MCC in sham rats. MCC, 1.25 mL, NVCs, 0.08/min; (c) Group C: the range of MCC corresponds to more than +2SD of MCC in sham rats. MCC, 2.50 mL; NVCs, 0.00/min. “Void” indicates the time when the first micturition occurs.
59
N. Sekido et al.
Table 1. Spearman correlation coefficients (ρ) of maximum cystometric capacity (MCC) and frequency of non-voiding contractions (NVCs) with other cystometric parameters. NVCs (/min)
VV (mL)
PVR (mL)
RUR (%)
Pmax (mmHg)
ρ
−0.1412
0.0421
0.8973
0.4915
0.1873
p
0.4409
0.8283