International Environmental Modelling and Software Society (iEMSs) 2012 International Congress on Environmental Modelling and Software Managing Resources of a Limited Planet, Sixth Biennial Meeting, Leipzig, Germany R. Seppelt, A.A. Voinov, S. Lange, D. Bankamp (Eds.) http://www.iemss.org/society/index.php/iemss-2012-proceedings
Quantifying and reducing uncertainty in the assessment of water-related risks in southern Europe and neighbouring countries 1
1
1
2
Joachim Post , Günter Strunz , Franz Hummel , Sihem Benabdallah , Franz 3 4 Prettenthaler , Ralf Ludwig 1 DLR – German Aerospace Centre, German Remote Sensing Data Center (DFD) Department Civil Crisis Information & GeoRisks, Oberpfaffenhofen, Germany 2 CERTE – Center for Water Research and Technologies, Borj-Cedria, Tunisia 3 Joanneum Research, POLICIES – Centre for Economic and Innovation Research, Graz, Austria 4 Ludwig-Maximilians-University Munich, Department of Geography, Munich, Germany
[email protected] Abstract: The project CLIMB (Climate Induced Changes on the Hydrology of Mediterranean Basins – Reducing Uncertainty and Quantifying Risk through an Integrated Monitoring and Modelling System, www.climb-fp7.eu) aims to investigate present and future climate induced changes in the hydrological budgets and extremes for Mediterranean and neighbouring countries. We provide a concept for an integrated modelling and assessment set-up to tackle the challenge of quantifying parameter related uncertainties and associated risks with the water balance simulation model ETH (WaSiM-ETH) for the cultivation of tomatoes in Chiba basin, Tunisia, which is a test site within the CLIMB project. This study indicates that it is already delicate to cultivate tomatoes in the watershed under rain-fed conditions with a deteriorating trend in the future. This is associated with considerable yield reduction for tomatoes and thus economic impacts for local farmers. Keywords: Climate change; uncertainty analysis; parameter uncertainty; risk assessment 1
INTRODUCTION
Southern Europe and neighbouring countries are already experiencing a broad range of water-related risks. According to climate projections, the region is at risk due to its pronounced susceptibility to changes in the hydrological budget and extremes. Such changes are expected to have strong impacts on the management of water resources and on key strategic sectors of regional economies (Ludwig et al. [2011]). Integrated assessment schemes covering climate and hydrological modelling and socio-economic vulnerability assessment have to be developed and applied in order to quantify water-related risks. More and more important for interpretation and decision making is the quantification of uncertainty in the risk estimates. In the context of model simulations, the quantification of attached modelling uncertainties on model outputs and information on how the uncertainty in the model output can be apportioned to different sources of uncertainty in the model input (sensitivity analysis) are meanwhile necessary information (Post et al. [2008], Saltelli et al. [2004]). Within the project CLIMB (Climate Induced Changes on the Hydrology of Mediterranean Basins - Reducing Uncertainty and Quantifying Risk through an Integrated Monitoring and Modelling System, Ludwig et al. [2010],
Post et al. / Quantifying and reducing uncertainty in the assessment of water-related risks in southern Europe and neighbouring countries
see www.climb-fp7.eu) one aim is to quantify and reduce uncertainty taking into account the propagation of sources of uncertainty through the full modelling chain, starting from the definition of emission scenarios to global and regional climate modelling to hydrological and socio-economic impact models and a subsequent variety of management options. In this paper we provide a concept for an integrated modelling and assessment set-up to tackle the challenge of an end-to-end uncertainty assessment to assess water related risks. First results and insights will be given for selected CLIMB test sites. In this paper we will concentrate on quantifying parameter related uncertainties and associated risks for the cultivation of tomatoes in Chiba basin, Tunisia. 2
METHODOLOGY
2.1
Study site description
The study area is located in the Cap-Bon region in Northeast Tunisia. It lies in the semi-arid bioclimatic region. The rainfall regime is typical of Mediterranean type with rainy season extending from September to April with an average rainfall of 450 mm with high temporal and spatial variability. The average annual temperature is 19 °C. This area, like many other parts of the country, is affected by limited water supply. It relies mainly on groundwater and surface water from the Chiba dam with a capacity of 6.9 million m³. The dominant soil textures are mainly sandy clay loams, sandy loams and silty loams. The land use in the catchment is 80 % cropland (olive trees, barley, wheat and vegetables), 6 % forest and transitional vegetation, and 14 % between rural settlements and bare soils. The catchment is experiencing an intensification of agriculture and the irrigated area is increasing rapidly. Thus, the population is heavily dependent on agriculture activity as its primary source of income. The only climate change study elaborated by the Tunisian Ministry of Agriculture and Hydraulic Resources (MAHR) in 2007 indicated that water resources will decrease by 28 % by 2030, affecting mainly groundwater and coastal aquifers. Surface water is estimated to decrease by 5 % (MAHR [2007]). However, these estimates were not associated with their level of uncertainty and they were derived based on one global model namely the coupled global model HADCM3, predicting an average increase of 1.7 °C in temperature and an average decrease of 15 mm in annual rainfall for the Cap-Bon area by 2050. Thus, an important point to address is that agriculture goods will not only depend on economic variables and market fluctuations but more on the exacerbated variability of local climate under the influence of global climate changes. 2.2
UA components and methods
Identifying sources of uncertainty in the water resources estimation process is related to estimating natural resource availability (climate and hydrological modelling), present day resource use and availability (system yield modelling) and future resource use and management. Potential sources of uncertainty thereby arise in the fields of hydrology, water resources engineering, agricultural science, economics, social science and politics. Uncertainties of hydrological models can be related to three major sources, namely input data (e.g. precipitation), model structure as well as parameter estimation (IWR [2009]). Refsgaard et al. [2007] provide a list of 14 types of methods that are commonly used to address uncertainty. We applied a combination of Monte Carlo Analysis (MC) and Sensitivity Analysis (SA) techniques which is commonly used to quantify and reduce uncertainty in environmental and hydrological modelling. MC can be used to investigate the error propagation for a series of uncertain input factors within a model and their cumulative effect on model output. MC thereby relies on a variety of randomly selected data which is drawn from the designated range and probability distribution function (PDF) of each input factor. In this environment also interdependencies between factors may be considered (Saltelli et al. 2008). MC typically consists of six steps (Saltelli et al. [2000a], Saltelli et al. [2000b]):
Post et al. / Quantifying and reducing uncertainty in the assessment of water-related risks in southern Europe and neighbouring countries
(1) Definition of model variables (input factors) that are used for the analysis, (2) selection of ranges and PDFs for all input factors, (3) generation of samples within the specified ranges and PDFs of the model input (sampling), (4) evaluation of the model output for each element of the input factor sample, (5) uncertainty analysis (UA) and (6) sensitivity analysis (SA). For this study, steps (3) and (6) of MC are realized with the uncertainty and sensitivity analysis tool Simlab [2011] (Saltelli et al. [2004]; Simlab [2008]). 2.3
Parameter uncertainty study (PUS)
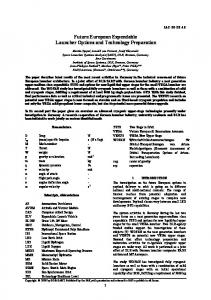
This study illustrates an approach to quantify parameter related uncertainties with the water balance simulation model ETH (WaSiM-ETH) for the Chiba basin (north east of Tunisia) which is a test site within the CLIMB project. The timeframe of the study covers a reference (1971 – 2000) as well as a scenario period (2041 – 2070). The parameter uncertainty study (PUS) consists of three steps, namely the generation of one climate data set that is used throughout PUS, the parameter data set variation and finally the quantification of parameter related uncertainty (see figure 1). In this case the climate data set was averaged from two regional climate models (RACMO2 (Lenderink et al. [2003]), operated by the Royal Meteorological Institute of the Netherlands KNMI, and RCA3 (Kjellström et al. [2005]), operated by the Swedish Meteorological and Hydrological Institute SMHI) both applied within the EU project ENSEMBLES [2012], dynamically downscaling the general circulation model (GCM) ECHAM5-r3 SRES-A1 (IPCC [2007]). Both climate models have an original spatial cell size resolution of 25 km. A mass and energy conserving downscaling technique with the application SCALMET (Marke [2008]) was used to deduce this coarse information down to the catchment scale (cell size 1000 m). The possibility for validating model results on observations is very scarce in this region due to limited monitoring networks as well as field campaign activities in the past. Thus, only plausible assumptions for the model input may be made and propagated within the model to derive plausible model outputs. Two climate stations (Tunis-Carthage and Nabeul) outside of Chiba basin were used to get information about goodness of fit for the climate model data used within Chiba basin. Monthly average characteristics of temperature and precipitation regimes and extremes over the year could be sufficiently reproduced by the climate model data. Information about crop cycles of land use classes was derived from FAOcrop [2011] as well as Reinery [2011]. Supplemental information regarding crop parameterization was taken from Reinery [2011], Cropwat [2011] as well as Masson et al. [2003]. Schulla and Jasper [2007] provide information about water retention properties for 14 soil classes (e.g. sand). All this is finally complemented with data originating from a local study concerning the Korba coastal aquifer which is situated in the east of Chiba basin (Zghibi et al. [2011]). Taking this data basis into account, a set of 22 parameters is determined for the WaSiM-ETH model and varied in the subsequent parameter uncertainty study. These parameters can be summarized in four groups, namely land use, soil, ground water and climate (see table 1). Some parameters are listed as being important in the user manual (Schulla and Jasper [2007]), namely land use and soil parameters. Climate and ground water related parameters were chosen to test their influence on model outputs. All 22 parameters are defined with a designated range and PDF. This information is used to perform a Latin-Hypercube-Sampling (LHS), which offers a series of benefits. The range of each input factor is divided in N intervals. N stands for the number of samples that are drawn. Within each interval a sample is randomly selected. Consequently LHS ensures randomness in the sample generation and fully stratified coverage of an input factor, while resulting in a significant reduction of required samples. For each input factor a minimum of 1.5 model runs is recommended. With 22 model parameters varied at a time within PUS this amounts to at least 33 model runs (Simlab [2008]). This study incorporates a series of 50 samples for each input factor to confidently meet LHS requirements (see figure 1). In the following an example is given to illustrate the sampling process. ’Crop_LAI’ consists of 36 monthly mean values of wheat, olives and tomatoes. These 36 values constitute a mean of 1.82 [m²/m²] and a standard deviation of 1.83 [m²/m²].
Post et al. / Quantifying and reducing uncertainty in the assessment of water-related risks in southern Europe and neighbouring countries
A Gaussian-type PDF for ’Crop_LAI’ is assumed. Simlab [2011] processes this information with the Latin Hypercube sampling procedure and the specification that 50 model runs are to be performed, therefore 50 samples of ’Crop_LAI’ are produced. The mean value of ’Crop_LAI’ is 1.82 [m²/m²]. For one model run a sample may define ’Crop_LAI’ to be 1.27 [m²/m²]. Relating the sample to the mean value results in a change factor of 0.7 (1.27/1.82) for this model run. In this case the 36 values of the basic parameterization of LAI for wheat, olives and tomatoes (12 monthly mean values per class) would be multiplied with a factor of 0.7 to transfer the sample specifications into the modelling environment. All 50 model runs span up a variety of change factors. The bandwidth of variation extends from 0.06 to 3.06 relative to the basic characteristics of ’Crop_LAI’ (see table 1). This methodology is applied to all input factors. 22 parameters exist for 1971 – 2000 and 2041 – 2070. ’Temp_Ref’\’Prec_Ref’ vary in the reference period and ’Temp_Fut’\’Prec_Fut’ in the scenario period respectively. Each model run covers 30 years; therefore, information on a specific characteristic (e.g. relative soil water content in the root zone) for a given day consists of 30 values for a single model run. 50 model runs with varying parameter sets even amount to 1500 samples which span up a range of calculated values for each modelled day, further used to quantify uncertainty of model results based on varying parameter sets. Comparison of reference and scenario period shows climate induced changes between those periods. With this approach shifts in regimes as well as extremes of key outputs of interest can be assessed.
Figure 1: Structure of the parameter uncertainty study (PUS). Table 1: List of input factors used within the parameter uncertainty study (PUS).
Post et al. / Quantifying and reducing uncertainty in the assessment of water-related risks in southern Europe and neighbouring countries
3
RESULTS
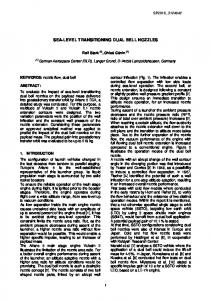
All model runs of PUS indicate a decrease of relative soil water content in the root zone for every season of the year. Winter (DJF), spring (MAM) and summer (JJA) feature statistical significance. Thereby all individual months show a decline except November (statistical significance for January to September). Changing characteristics of soils, plants and Korba ground water aquifer lead to a distinct spread of soil water contents within PUS. This is pronounced during the wet season (September to April), when water availability varies considerably due to the high variability of rainfall in the semi-arid climate of Chiba basin. The ratio between the highest and lowest inter-annual precipitation sums is 4.4 (EC [2009]). Uncertainties are higher in times of varying rainfall. This expresses in a much wider band of projected values for individual months. During summertime, all simulations project a small band of very low values. Therefore a higher confidence exists that water will be scarce during that time of the year (see figure 2). Best estimates project annual mean values of relative soil water content in the root zone of 9.3 [Vol.-%] +/- 1.9 [Vol.-%] and 8 [Vol.-%] +/- 1.5 [Vol.-%] for the reference and scenario period respectively which results in a decline of 1.3 [Vol.-%] +/- 0.25 [Vol.-%] (-14 % +/- 2.7 %) between 1971 – 2000 and 2041 – 2070. This trend can mainly be attributed to a reduction of annual precipitation sums by 59.3 mm +/- 17.2 mm (-16.9 % +/- 4.9 %) from 351.3 mm +/- 105.4 mm (1971 – 2000) to 292 mm +/81.8 mm (2041 – 2070). Chiba basin is modelled with an area of 176 km². Therefore a decline of 59.3 mm +/- 17.2 mm adds up to a value of 10.4 million m³ +/- 3 million m³ of less water on average in each year. Inter-annual variability may even lead to a more pronounced decline in individual years. These facts indicate that precipitation constitutes the key input factor within this study. High variability of rainfall results in a high degree of uncertainty for relative soil water contents in the root zone as well as actual evapotranspiration rates, especially from September to April (wet season). This exacerbates a precise quantification of overall available water for individual years. However, best estimates project annual overall available water resources to decline by 3.32 million m³ (-66 %) [5.03 million m³ (1971 – 2000) to 1.71 million m³ (2041 – 2070)]. These findings can be associated to risks for the cultivation of tomatoes under rainfed conditions. From February to April it is more likely than not (50 – 100 % probability) that there is enough water for tomato cultivation. From May to October it is unlikely (0 – 33 % probability) to exceptionally unlikely (0 – 1 % probability) to meet critical values in the study area. November and December feature higher probabilities but lie below 50%. With relative soil water contents in the root zone further declining in 2041 – 2070, probabilities decrease to meet water demands of tomatoes in Chiba basin (see figure 2 and table 2). Probability of meeting water demands for tomatoes is derived from the number of simulations exceeding critical values. Since these model results are quantified measures of uncertainty, findings may be expressed with a certain probability terminology according to the guidelines th specified for the IPCC 5 Assessment Report (Mastrandrea et al. [2010]). Cropwat [2011] was used to deduce critical soil water contents for tomatoes as well as to assess yield response of tomatoes to water stress in specific development stages. In general the effect of water stress weights smaller in the vegetative and ripening period but becomes larger in times of flowering and yield formation. Not a single month always meets critical soil water demands within the model run simulations of PUS. Thus water stress may occur throughout the first and second crop cycle. The first crop cycle is less affected by water stress in the first stages of development. Relevant water stress illustrates in the later stages of development though. The second crop cycle shows substantial water scarcity at the initial and development stage. Also later stages display only small probabilities of meeting water demands. Taking these findings into account one may expect considerable yield reduction for tomatoes in both crop cycles and thus economic impacts for local farmers. This study indicates that it is already delicate to cultivate tomatoes in the watershed under rain-fed conditions with a deteriorating trend in the future. Korba aquifer is already overexploited due to the uncontrolled high pumping rates which caused modification of the natural flow system and induced seawater intrusion from the coast leading to the deterioration of the water table quality. Hence, aquifer recharge by surface water and by treated wastewater is already practiced in the Chiba basin
Post et al. / Quantifying and reducing uncertainty in the assessment of water-related risks in southern Europe and neighbouring countries
(Horriche et al. [2010]). If the lack of water was to be compensated with more water from Korba ground water aquifer, associated problems may amplify in the future.
Figure 2: Simulated monthly mean values of relative soil water content in the root zone within PUS for 1971 – 2000 (left window) and 2041 – 2070 (right window). Dark red points indicate critical water contents for tomatoes. Table 2: Probability [%] of meeting water demands of tomatoes in Chiba basin under climate conditions of 1971 – 2000 and 2041 – 2070. Water demands are deduced from Cropwat [2011] and calculated for February to June (first crop cycle) as well as August to December (second crop cycle).
4
CONCLUSIONS
This study presented an approach to quantify parameter related uncertainties for relative soil water content in the root zone as well as associated risks for tomato cultivation in Chiba basin. This approach is still preliminary and will be constantly refined until final implementation. Supplemental information and updates to CLIMB project results are disseminated on the project website (www.climb-fp7.eu). Beyond the findings of this paper we will develop an approach to investigate on how the uncertainty in the model output can be apportioned to different sources of uncertainty in the model input (sensitivity analysis SA). Furthermore, findings of SA indicate where additional data gathering and research may build a better data base to reduce uncertainties related with input factor parameterization. Besides that the structure of CLIMB aims to improve data availability and accuracy by conducting a series of field studies combined with remote sensing technology in the case study areas. Both efforts shall lead to better model parameterizations resulting in a reduction of overall model uncertainty. Findings of SA will be part of a series of future publications in the context of the on-going CLIMB dissemination process.
Post et al. / Quantifying and reducing uncertainty in the assessment of water-related risks in southern Europe and neighbouring countries
REFERENCES Cropwat, http://www.fao.org/nr/water/infores_databases_cropwat.html, 26.11.2011. EC, Description of work (DOW) CLIMB - Climate Induced Changes on the Hydrology of Mediterranean Basins - Reducing Uncertainty and Quantifying Risk through an Integrated Monitoring and Modelling System, Technical report, European Commission, Community Research, Seventh Framework Programme, 2009. Ensembles, Ensemble-based predictions of climate changes and their impacts, http://www.ensembles-eu.org, 01.03.2012. FAOcrop, Crop calendar - an information tool for seed security, http://www.fao.org/agriculture/seed/cropcalendar/welcome.do, 15.10.2011. Horriche, F., Benabdallah, S., and A. Charef, Hydrogeological Characterization of the Korba Artificial Recharge Site, Tunisia-Japan Symposium: Regional Development and Water Resource – A new vision for sustainable society, Tunis, Tunisia, Nov. 28th – Dec. 1st , 2010, p. 149-151, 2010. IPCC, Climate Change 2007: Synthesis Report. Contribution of Working Groups I, II and III to the Fourth Assessment Report of the Intergovernmental Panel on Climate Change, IPCC, Geneva, Switzerland, 2007. IWR, Identification, Estimation, Quantification and Incorporation of Risk and Uncertainty in Water Resources Management Tools in South Africa, Deliverable No. 3: Interim Report on Sources of Uncertainty, Water Research Commission Project No: K5/1838, Institute of Water Research, Rhodes University, School of Bioresources Engineering and Environmental Hydrology, University of KwaZuluNatal and Water for Africa, 2009. Kjellström, E., Baerring, L., Gollvik, S., Hansson, U., Jones, C., Samuelsson, P., Rummukainen, M., Ullerstig, A., Willen, U., and K. Wyser, A 140-year simulation of European climate with the new version of the Rossby Centre regional atmospheric climate model (RCA3), 2005. Lenderink, G., van den Hurk, B., van Meijgaard, E., van Ulden, A., and J. Cuijpers, Simulation of present-day climate in racmo2: first results and model developments, knmi technical report, Technical report, 2003. Ludwig, R., Soddu, A., Duttmann, R., Baghdadi, N., Benabdallah, S., Deidda, R., Marrocu, M., Strunz, G., Wendland, F., Engin, G., Paniconi, C., Prettenthaler, F., Lajeunesse, I., Afiffi, S., Cassiani, G., Bellin, A., Mabrouk, B., Bach, H., and T. Ammerl, CLIMB – Climate Induced Changes on the Hydrology of Mediterranean Basins, Fresenius Environmental Bulletin, 19, 15-23, 2010. Ludwig, R., Roson, R., Zografos, C., and G. Kallis, Towards an inter-disciplinary research agenda on climate change, water and security in Southern Europe and Neighbouring countries, Environmental Science and Policy, 14, 794-803, 2011. Tunisian Ministry of Agriculture and Hydraulic Resources, Stratégie nationale d'adaptation de l'agriculture tunisienne et des écosystèmes aux Changement Climatiques, Technical report, German Technical cooperation, 2007. Marke, T., Development and Application of a Model Interface to couple Land Surface Models with Regional Climate Models for Climate Change Risk Assessment in the Upper Danube Watershed, PhD thesis, Ludwig-MaximiliansUniversity Munich, 2008. Masson, V., Champeaux, J., Chauvin, F., Meriguet, C., and R. Lacaze, A global database of land surface parameters at 1-km resolution in meteorological and climate models, Journal of Climate, 16, 1261-1282, 2003. Mastrandrea, M., Field, C., Stocker, T., Edenhofer, O., Ebi, K., Frame, D., Held, H., Kriegler, E., Mach, K., Matschoss, P., Plattner, G., Yohe, G., and F. Zwiers, Guidance Note for Lead Authors of the IPCC Fifth Assessment Report on Consistent Treatment of Uncertainties, Intergovernmental Panel on Climate Change (IPCC), 2010. Post, J., Hattermann, F., Krysanova, V., and Suckow, F. Parameter and input data uncertainty estimation for the assessment of long-term soil organic carbon dynamics. Environmental Modelling & Software, 23:125-138, 2008. Refsgaard, J.C., van der Sluijs, J., Hojberg, A.L., and P.A. Vanrolleghem, Uncertainty in the environmental modelling process - a framework and guidance. Environmental Modeling & Software, 22, 1543-1556, 2007.
Post et al. / Quantifying and reducing uncertainty in the assessment of water-related risks in southern Europe and neighbouring countries
Reinery, L., Modellgestützte Analyse der Folgen des Klimawandels auf die Hydrologie des Mittelmeerraumes – Fallbeispiel: Chiba, Tunesien, Master’s thesis, LMU Munich, 2011. Saltelli, A., Chan, A., and N. Scott, Sensitivity Analysis, Mathematical and Statistical Methods, 2000a. Saltelli, A., Tarantola, S., and F. Campolongo, Sensitivity analysis as an ingredient of modelling, Statistical Science, 15, 377-395, 2000b. Saltelli, A., Tarantola, S., Campolongo, F., and M. Ratto, Sensitivity Analysis in Practice: A Guide to Assessing Scientific Models, Wiley-Interscience, 2004. Saltelli, A., Ratto, M., Andres, T., Campolongo, F., Cariboni, J., Gatelli, D., Saisana, M., and S. Tarantola, Global Sensitivity Analysis: The Primer, Wiley-Interscience, 2008. Schulla, J., and K. Jasper, Model description WaSiM-ETH (Water balance Simulation Model ETH), last updated: November 2007, ETH-Zurich, 2007. Simlab, Simlab 2.2 Reference Manual, Last Update July 15th 2008, 2008. Simlab, Software package for uncertainty and sensitivity analysis, Joint Research Centre of the European Commission, downloadable for free at: http://simlab.jrc.ec.europa.eu, 2011. Zghibi, A., Zouhri, L., and J. Tarhouni, Groundwater modelling and marine intrusion in the semi-arid systems (cap-bon, tunisia). Hydrological Processes, 25:18221836, 2011.