... Helsinki University of Technology, P.O. Box 2200 (Technical Physics), FIN-02015 HUT, Finland ... todetector records the intensity of the beam reflected from.
Paper I Scanning Michelson interferometer for imaging surface acoustic wave fields
J. V. Knuuttila, P. T. Tikka, and M. M. Salomaa
© 2000 Optical Society of America J. V. Knuuttila, P. T. Tikka, and M. M. Salomaa, “Scanning Michelson interferometer for imaging surface acoustic wave fields”, Optics Letters, Vol. 25, No. 9, pp. 613–615, May 2000.
Reprinted with permission.
May 1, 2000 / Vol. 25, No. 9 / OPTICS LETTERS
613
Scanning Michelson interferometer for imaging surface acoustic wave fields J. V. Knuuttila, P. T. Tikka,* and M. M. Salomaa Materials Physics Laboratory, Helsinki University of Technology, P.O. Box 2200 (Technical Physics), FIN-02015 HUT, Finland Received December 1, 1999 A scanning homodyne Michelson interferometer is constructed for two-dimensional imaging of highfrequency surface acoustic wave (SAW) f ields in SAW devices. The interferometer possesses a sensitivity p of ⬃1025 nm兾 Hz, and it is capable of directly measuring SAW’s with frequencies ranging from 0.5 MHz up to 1 GHz. The fast scheme used for locating the optimum operation point of the interferometer facilitates high measuring speeds, up to 50,000 points兾h. The measured f ield image has a lateral resolution of better than 1 mm. The fully optical noninvasive scanning system can be applied to SAW device development and research, providing information on acoustic wave distribution that cannot be obtained by merely electrical measurements. 2000 Optical Society of America OCIS codes: 240.6690, 120.3180, 110.7170, 120.1880, 120.7280, 350.4010.
The demand for high-frequency low-loss surface acoustic wave (SAW) filters for wireless telecommunications has led to extensive research focusing on novel SAW designs. Detailed information is needed on the propagation properties of SAW’s within interdigital transducer and ref lector structures in novel miniaturized applications featuring micrometer-scale structures and operation frequencies in the 1-GHz range. Achieving low losses poses stringent demands for component design. An important factor is how well waveguides and resonators conf ine energy. Theoretical models,1 along with S-parameter measurements performed on test structures2 and device prototypes, are the standard methods for analyzing these issues and improving SAW designs. However, evaluating acoustic activity in resonators, waveguides, and ref lectors with the above-described methods is tedious, indirect, and costly. Direct twodimensional probing of SAW fields is needed. In efficient probing aimed at assisting device development, the measuring setup must possess high sensitivity and permit measurements at frequencies reaching 1 GHz, at which the wavelength can be less than 4 mm. Linear response and an extensive dynamic range are also required from the probing system. The possibility of scanning areas of arbitrary size and zooming in on details with high lateral resolution at will is crucial for analyzing any operating SAW device. Finally, fast scanning speed, allowing a large number of scanning points, is needed, along with the capability of measuring packaged devices at a given frequency without complex frequency- or amplitude-modulation schemes. Detection systems that were recently presented for probing SAW’s3 – 8 fulf illed some of the above criteria but often lacked the versatility required to measure two-dimensional prof iles on high-frequency SAW devices effectively. Instead, most published results were obtained from test structures and with limited numbers of data points. In particular, a scanning acoustic force microscope that was recently proposed for highresolution probing of SAW’s suffers from limitations if noninvasive probing of large areas is to be performed or a linear response is required.3,4 0146-9592/00/090613-03$15.00/0
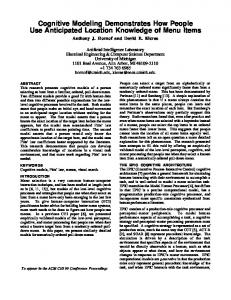
To date, the most-advanced measuring setups suitable for noninvasive probing of SAW devices have been based on the optical knife-edge technique.5,8 By developing a fast-scanning Michelson interferometer, we have been able to measure, for what is believed to be the first time, large two-dimensional scans from low-loss SAW devices operating at 1 GHz. These measurements revealed a new acoustic loss mechanism in modern low-loss SAW devices.9,10 Our imaging system utilizes laser interferometry, which allows noncontact probing of SAW as well as bulk acoustic wave vibrations.11 The optical setup (see Fig. 1) is a homodyne Michelson interferometer. The coherent light source is a linearly polarized TEM00 mode 10-mW red He–Ne laser (Uniphase 1135P). A polarizing beam splitter divides the beam into measurement and the reference components. The measurement beam is focused on the SAW chip by a microscopy objective (Nikon 354248 CF N Plan 403 ELWD) featuring a long working distance of 6.8 mm, suitable for operating in packaged SAW devices attached to bondwires. The diameter of the focused measurement spot size is less than 1 mm. The interference signal is detected with a fast photodetector
Fig. 1. Setup of our scanning homodyne Michelson interferometer. The thick arrows (at right angles) indicate the polarization vectors of the laser beam. The second photodetector records the intensity of the beam ref lected from the SAW sample. 2000 Optical Society of America
614
OPTICS LETTERS / Vol. 25, No. 9 / May 1, 2000
(Newport 818-BB-21), amplified, and fed into a spectrum analyzer. The highest detectable spot-sizelimited SAW frequency is 2 GHz. To date, the interferometer has been applied to probing SAW fields as high as 1008 MHz. Earlier interferometer-based setups were applied to significantly lower SAW frequencies12 – 14 (17–150 MHz) or were designed for fixed-point SAW velocity-dispersion measurements.15 To permit accurate and f lexible scanning we attach the SAW sample to a computer-controlled threeaxis translation stage. The resolution of the stage is 0.055 mm; the range, 25 mm. To achieve a scanning precision of less than 1 mm and to ensure suff icient stability for interferometric detection we assemble the complete setup on a vibration-isolated optical table. For a homodyne Michelson interferometer the optical path difference between the two interferometer arms needs to be tuned at each measurement point for optimal operation. The photocurrent at the detector is16 µ ∂ p P 1 4pDd , hge rs 1 rref 1 2 rs rref cos (1) im 苷 4 hn l where h is the quantum efficiency of the detector; g is the detector gain; e is the electronic charge; P is the laser power; hn is the photon energy; and rs and rref are the reference mirror and the sample ref lectivities, respectively; Dd is the optical path difference; and l is the wavelength of the laser. The maximum sensitivity of the interferometer is achieved at the quadrature point at which Dd 苷 l共1/8 1 n/4兲, where n is an integer. Tuning of the interferometer at each point is achieved by application of a fast scheme that locates the quadrature points. The spectrum analyzer is set to zero-span mode, in which it acts as a tuned receiver and records the amplitude of the tuned frequency as a function of time. Since the reference mirror is simultaneously moved with a piezocontroller, the response of the interferometer is obtained as a function of the path difference over a few l. From this response, four maxima are located and averaged, and the SAW amplitude is obtained. The receiver bandwidth of the spectrum analyzer is set to 3 kHz. A narrower receiver bandwidth can be used to increase the sensitivity of the interferometer but this is limited by our spectrum analyzer. The applied scheme eliminates the need for stabilization circuits and provides high tolerance against external low-frequency vibrations, since a narrow receiver band is applied and the signal maxima are always detected. A sweep can be performed in less than 50 ms, thus permitting measurement speeds greater than 70,000 points兾h. However, the translation stage limits the highest achievable scanning speed to 50,000 points兾h. The minimum shot-noise-limited surface displacement that can be detected is17 µ ∂ 1 hn 1/2 1/2 d Amin 苷 Df , (2) 4 hP where d denotes the spot size, yielding a value of 0.3 3 1025 nm for the calculated sensitivity. To determine the sensitivity experimentally we replace the
sample with a piezoelectric element equipped with a ref lecting mirror surface. To achieve signal versus vibration amplitude calibration we record the measured signals at the drive frequency (400 kHz) and the second- and third-harmonic frequencies at different drive levels of the piezo and fit them to the values of the corresponding Bessel functions given by modulation theory. A minimum detectable surface displacement of 1.1 6 0.2 3 1023 nm for a 10-kHz detection bandwidth is obtained, resulting in a sensitivity of the probe of 1.1 6 0.2 3 1025 nm. The detection limit is higher than the calculated value as a result of light-intensity and coherence losses at nonideal optical surfaces and the added noise resulting from the amplification of the detector signal. The linearity of the interferometer response is displayed in Fig. 2. The dynamic range is better than 50 dB for measurements of leaky waves at 930 MHz and increases to 70 dB for Rayleigh waves at 200 MHz. Software has been created to automate the measurements. It moves the stages, locates the interference maxima, and records the amplitude data. Also, we record the intensity of the beam ref lected from the SAW chip at each probe point to form an optical image of the scanned area. A two-dimensional scan performed on a commercial 947.5-MHz GSM Rx-type SAW filter is shown in Fig. 3. The filter applies the impedance element design, a principle used for modern low-loss high-performance SAW filters.18 The material is 36± LiTaO3 supporting a leaky SAW mode. There are ref lector gratings at both ends of each resonator. Figure 3 displays the ref lected light power and the amplitude data. On the left-hand side, high the values of the ref lected light-power image indicate a metallized surface; low values, a crystal surface. The
Fig. 2. Interference signal is linear in the drive —to a fair approximation —for amplitudes above the noise-f loor level 共297 dBm兲 of the interferometer. The signal decreases by 6 dB when the SAW amplitude decreases by a factor of 2; i.e., the interferometer signal represents the power density of the SAW. The arrows indicate the amplitudes at which the internal attenuation of the Hewlett-Packard drive-signal generator changes.
May 1, 2000 / Vol. 25, No. 9 / OPTICS LETTERS
615
ment of SAW devices. In spite of recent progress in scanning acoustic force microscopy of SAW fields,3 we find that optical probing remains more versatile: Measurements of an arbitrary part of a component can be performed, and on-chip acoustic phenomena can be studied in a variety of devices. We thank Thor Thorvaldsson (Micronas Semiconductor SA, Bevaix, Switzerland) for providing the samples; Matti Kaivola, Victor Plessky, and the late Carl-Gustav Aminoff for discussions; and Advanced SAW Products SA, Technology Development Centre, Finland (TEKES), and the Nokia Group for support. *Present address, NMP, Inc., P.O. Box 86, FIN-24101 Salo, Finland. References
Fig. 3. (left) Ref lected light power and (right) the SAW amplitude field image on top of the resonator and the surrounding busbar reveal unwanted leakage of acoustic power. The amplitude scale indicates the power density of the SAW in decibels, with the highest measured amplitude set as the reference level, and the scale for ref lectivity is in arbitrary units.
scanning step of the translation stage was chosen to be 0.4 mm along both the x and the y axes. The 1-mm-wide electrodes are well resolved but are not reproduced in Fig. 3. The measured SAW amplitude field on top of the resonator and the surrounding busbar area is displayed on the right-hand side. The excitation frequency is fixed at 947.5 MHz, the resonance of the series interdigital transducer. The total number of points is 527 000 at a scanning speed of 49,200 points兾h. The location of the SAW prof ile with respect to the electrode structure is found by comparison of the light-ref lection and -amplitude images. The measured amplitudes on the metallized areas are higher than those on the crystal surface, where the low ref lectivity slightly reduces the sensitivity of the interferometer. The scans reveal undesirable leakage of acoustic power: Diverging SAW beams originating from the resonator progress in all directions from the resonator. Further, it can be seen from the optical image that areas possessing high SAW amplitudes exhibit electroacoustic migration. Thus, in addition to providing information on acoustic leakage, the interferometer can also be used to investigate the power distribution in SAW filters, thus assisting in developing the power tolerance of SAW components. In conclusion, we have demonstrated that it is possible to apply laser interferometry to detailed probing of the acoustic amplitude distribution in SAW components operating at cellular phone frequencies. The scanning interferometer presented above enables one to study high-frequency SAW physics as well as to advance industrial research on and develop-
1. C. C. W. Ruppel, W. Ruile, G. Scholl, K. Ch. Wagner, and O. M¨anner, in Proceedings of the 1994 IEEE Ultrasonics Symposium (Institute of Electrical and Electronics Engineers, New York, 1995), p. 313. 2. C. S. Hartmann and V. P. Plessky, in Proceedings of the 1993 IEEE Ultrasonics Symposium (Institute of Electrical and Electronics Engineers, New York, 1994), p. 1247. 3. T. Hesjedal, E. Chilla, and H.-J. Fr¨ohlich, Appl. Phys. Lett. 70, 1372 (1997). 4. G. Behme, T. Hesjedal, E. Chilla, and H.-J. Fr¨ohlich, Appl. Phys. Lett. 73, 882 (1998). 5. S. Jen and C. S. Hartmann, in Proceedings of the 1996 IEEE Ultrasonics Symposium (Institute of Electrical and Electronics Engineers, New York, 1997), p. 33. 6. G. S¨olkner, A. Ginter, and H.-P. Grassl, Mater. Sci. Eng. A 122, 43 (1989). 7. A. Ginter and G. S¨olkner, Appl. Phys. Lett. 53, 2295 (1990). 8. A. Holm, P. Wallner, W. Ruile, and R. Weigel, in Proceedings of the 1997 IEEE Ultrasonics Symposium (Institute of Electrical and Electronics Engineers, New York, 1998), p. 153. 9. J. V. Knuuttila, P. T. Tikka, C. S. Hartmann, V. P. Plessky, and M. M. Salomaa, Electron. Lett. 35, 1115 (1999). 10. J. Koskela, J. V. Knuuttila, P. T. Tikka, C. S. Hartmann, V. P. Plessky, and M. M. Salomaa, Appl. Phys. Lett. 75, 2683 (1999). 11. P. T. Tikka, J. Kaitila, M. Ylilammi, J. V. Knuuttila, T. Makkonen, K. Hashimoto, and M. M. Salomaa, in Proceedings of the 1998 IEEE Ultrasonics Symposium (Institute of Electrical and Electronics Engineers, New York, 1998), p. 1143. 12. A. Royer and E. Dieulesaint, in Proceedings of the 1986 IEEE Ultrasonics Symposium (Institute of Electrical and Electronics Engineers, New York, 1986), p. 527. 13. R. L. Jungerman, J. E. Bowers, J. B. Green, and G. S. Kino, Appl. Phys. Lett. 40, 313 (1982). 14. J. E. Bowers, R. L. Jungerman, B. T. Khuri-Yakub, and G. S. Kino, J. Lightwave Technol. 1, 429 (1983). 15. Y. C. Shen and P. Hess, J. Appl. Phys. 82, 4758 (1997). 16. H. Sontag and A. C. Tam, IEEE Trans. Ultrason. Ferroelectr. Freq. Control 33, 500 (1986). 17. C. B. Scruby and L. E. Drain, Laser Ultrasonics (Hilger, London, 1990). 18. V. P. Plessky, RF Design 21, 46 (1998).