In particular, Adobe's Flash video (FLV) ..... uses the Flash Netstream class to record the buffer status ... BufferTime in the Netstream class to adjust the size of.
Measuring the Quality of Experience of HTTP Video Streaming Ricky K. P. Mok, Edmond W. W. Chan, and Rocky K. C. Chang Department of Computing The Hong Kong Polytechnic University Hunghom, Kowloon, Hong Kong Email: {cskpmok, cswwchan, csrchang}@comp.polyu.edu.hk
I. I NTRODUCTION HTTP video streaming is widely used in delivering stored multimedia content. In particular, Adobe’s Flash video (FLV) plays an important role in storing and streaming videos via HTTP over TCP. YouTube is clearly the most successful system [20] for video sharing and video-on-demand service based on FLV. This kind of “streaming” is different from the traditional UDP-based streaming offered in, for example, Windows Media and Real Media, because it is not necessary for the video streaming server and client to synchronize. Moreover, the client could watch an incompletely downloaded video clip by its progressive download [4] technology. The reliable features of TCP also free the video codec from handling packet losses, and the picture quality is not degraded due to missing frames. Moreover, the web server does not require additional software or plugins to support the video streaming function. However, TCP throughput could be reduced by various kinds of impairments in network paths, such as packet loss and reordering. When the TCP throughput is lower than the playback rate, the video playback will pause and wait for new video data. This disruption could greatly impact the user-perceived quality, which is also known as the quality of experience (QoE). In general, the QoE can be affected by other factors, such as the quality of video and sound and the smoothness of playback, which could be cataloged into a protocol stack to form a conceptual relationship between
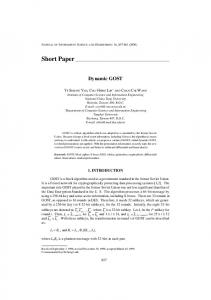
quality of service (QoS) and QoE [23], [29]. In this paper, we construct a similar protocol stack shown in Figure 1, but our focus is not on spatial (i.e., picture) quality at the application QoS layer. Instead, we propose a temporal structure of video as the application QoS for HTTP video streaming and use it to analyze how the QoE is affected by the network QoS (i.e., network path quality). User QoS (QoE) (MOS ȸ Mean Opinion Score) Application QoS (Application Performance Metrics)
Radar Chart
Abstract—HTTP video streaming, such as Flash video, is widely deployed to deliver stored media. Owing to TCP’s reliable service, the picture and sound quality would not be degraded by network impairments, such as high delay and packet loss. However, the network impairments can cause rebuffering events which would result in jerky playback and deform the video’s temporal structure. These quality degradations could adversely affect users’ quality of experience (QoE). In this paper, we investigate the relationship among three levels of quality of service (QoS) of HTTP video streaming: network QoS, application QoS, and user QoS (i.e., QoE). Our ultimate goal is to understand how the network QoS affects the QoE of HTTP video streaming. Our approach is to first characterize the correlation between the application and network QoS using analytical models and empirical evaluation. The second step is to perform subjective experiments to evaluate the relationship between application QoS and QoE. Our analysis reveals that the frequency of rebuffering is the main factor responsible for the variations in the QoE.
Network QoS (RTT, Bandwidth, Packet LossɃ)
Fig. 1: Three levels of QoS considered in this paper.
To characterize the relationship between the network QoS and application QoS, previous works [17], [27] performed analytical studies to model the video streaming performance using TCP. An algorithm was proposed to estimate the receiver buffer requirement based on the model in [17]. Moreover, empirical studies were conducted to investigate how network conditions affect the application QoS by recording application metrics during the video playback [28], [16]. Their evaluations, however, were only based on Windows Media. In this paper, we adopt both analytical and empirical approaches to study the correlation between the network QoS and application QoS. In particular, we use a set of application performance metrics (APM) for the study: (1) Initial buffering time, (2) mean duration of a rebuffering event, and (3) rebuffering frequency. On the other hand, the network QoS can be measured based on active measurement (e.g., OneProbe [19] and YouTube Video Speed History [2]) or passive measurement (e.g., [9], [7]). Moreover, the QoE is usually expressed using a Mean Opinion Score (MOS) of 1 (“Bad”) to 5 (“Excellent”) [14]. It could be obtained from subjective or objective measurement. ITU-T Recommendation P.911 [15] provides the reference for carrying out subjective measurement of audiovisual materials, and VQEG [1] provides detailed test plans for evaluating video quality in a subjective way. However, PSNR (Peak-Signal-toNoise-Ratio) and MSE (Mean Square Error), which are exam-
Previous works on correlating network QoS and QoE mainly concern the picture/audio quality or VoIP performance. Hands and Wilkins [11] studied how the network loss and burst size affected the video streaming quality, and subjective measurement and MPEG-1 videos were used in their experiments. Verscheure et al. [26] investigated the impact of data loss on the quality of MPEG-2 video. Zhou et al. [30] used the objective approach, E-model and the approach proposed in [26] to measure how the perceived quality of VoIP and MPEG2 video streaming were affected in IPv6. Tasaka and Watanabe [24] performed subjective experiment and used a multiple regression approach to estimate the QoE, and their focus was on the video and audio synchronization. Unlike these works, we study the correlation based on the temporal quality of HTTP streaming videos. Huynh-Thu et al. evaluated the correlation between the temporal aspect and the perceived quality in [12], and proposed temporal quality metrics in [13]. The artifacts they addressed are frame freezing and low frame rate. The occurrence of these artifacts is due to the loss of video frames caused by packet loss events. However, lost packets will be retransmitted in HTTP video streaming. Varga et al. [25] presented experiment results on how network QoS was correlated with user-perceived quality of Internet applications. They considered various applications, including video streaming, but they did not quantify the results. Wang et al. [28] proposed performance metrics for UDP-based Windows media streaming to evaluate the performance under different network conditions. However, the correlation of the perceived quality and performance metrics was not reported. III. N ETWORK Q O S AND
APPLICATION
QOS
In this section, we investigate the relationship between the network QoS and application QoS. Network QoS is the network path performance between a server and a client, including the round-trip time (RTT), packet loss rate, and network bandwidth. Application QoS, on the other hand, reflects the performance from an application point of view. In
A. Application performance metrics We propose three APMs to quantify the application QoS for HTTP video streaming, and these metrics represent the temporal structure of a video playback, regardless of the video content. 1. Initial buffering time (denoted by Tinit ): This metric measures the period between the starting time of loading a video and the starting time of playing it. 2. Mean rebuffering duration (denoted by Trebuf ): This metric measures the average duration of a rebuffering event. 3. Rebuffering frequency (denoted by frebuf ): When the amount of buffered video data decreases to a low value, the playback will pause, and the player will enter into a rebuffering state. This metric measures how frequent the rebuffering events occur. Figure 2 plots the time series of the video playhead time (i.e., the current position of the video) and the amount of video buffered by FlashTrack, our implementation of a customized Flash video player which will be presented in section III-D. The solid line refers to the video playhead time, and the dotted line to the amount of buffered video. The circles on the dotted line correspond to the empty-buffer events which occur whenever the amount of buffered video falls to a low value. The video playback pauses until the buffer is refilled. Therefore, the video playhead time stops increasing for a period of rebuffering after the onset of an empty-buffer event.
75
Buffered Video Empty−buffer Events Video Playhead Time
3 50 1.5 25 0 0
50 100 150 200 Wall Clock Time /s
Buffered video /s
II. R ELATED W ORK
the ensuing discussion, we propose three APMs to quantify the application QoS for HTTP video streaming. We then correlate both QoS using analytical modeling and empirical evaluation.
Video PlayHead Time /s
ples of the objective approach, only evaluate the spatial quality of videos, therefore not suitable for HTTP video streaming. In this paper, we perform subjective experiments to evaluate how the application QoS correlates with the QoE. Based on the correlation results for the network and application QoS, we are then able to correlate the network QoS with QoE which can be effectively visualized using a radar chart [8]. Section II first highlights the related works. Section III addresses the correlation between network QoS and application QoS, whereas section IV measures the correlation between QoE and application QoS. In section V, we then measure the correlation between the network QoS and QoE by combining the two sets of correlation results and use a radar chart to visualize the results. We discuss other issues which may affect the QoE in section VI and finally conclude this paper in section VII.
0
Fig. 2: Time series of the video playhead time and the amount of video data buffered at the player.
B. Modeling the APMs We construct a simple model to correlate network QoS with the three APMs. To simplify the model, we make the following assumptions: 1. The network bandwidth, RTT, and packet loss rate are constant during the video download. 2. The client does not interact with the video during the playback, such as pausing and forward/backward seeking.
3. The average bitrate of cross traffic between the server and the client is constant. 4. The fluctuation of video bitrate is not large. 5. The video buffer must be filled up before exiting the initial buffering and rebuffering states, and its size is smaller than the video’s length. 1) Initial buffering time and mean rebuffering duration: The estimates (in seconds) of the initial buffering time and mean rebuffering duration can be computed by Td init
T\ rebuf
= =
Bf ull × λ , β � 0, (Bf ull − Bempty ) λ/β,
(1)
When the average TCP goodput is less than the video’s bitrate, we will encounter nrebuf empty-buffer events during the video playback given by Equation (5), where l′ is the remaining length of the video (in seconds) upon the onset of the first empty-buffer event, and brebuf is the length of the played video (in seconds) before the next empty-buffer event. When β ≪ λ (i.e., β/λ ≈ 0), the maximum rebuffering frequency is given by � � 1 l − Bf ull max(frebuf ) = . (8) l Bf ull − Bempty
if β ≥ λ, (2) otherwise,
From Equation (8), the maximum rebuffering frequency only depends on the video length and buffer size, and is independent of the TCP goodput.
where Bf ull is the size (in seconds of video) of the video buffer, Bempty (< Bf ull ) is the remaining length of the buffered video that triggers an empty-buffer event, λ is the video’s bitrate (in bits/s), and β is the average TCP goodput (in bits/s) for the video streaming. T\ rebuf = 0 for β ≥ λ because the rebuffering event occurs only when the average TCP goodput is less than the video’s bitrate. To estimate the average TCP goodput, we employ the throughput model for a TCP Reno flow [21], given by s(p) = R
q
2bp 3
�
1
+ T0 min 1, 3
q
3bp 8
�
,
(3)
p (1 + 32p2 )
where s(p) is the packet sending rate per RTT, p is the packet loss rate, b is the number of packets that are acknowledged by an ACK, R is the RTT, and T0 is the retransmission timeout. As a result, the estimated average TCP goodput for the given RTT and loss rate is β = s(p) × M × 8/R, where M is the size of the data packets sent from the server. While the throughput model can estimate the TCP packet sending rate, the TCP goodput is also affected by the available bandwidth which affects both the packet loss rate and RTT experienced by the TCP flow. In particular, when the packet sending rate is greater than the available bandwidth, the network path will become congested, thus increasing the queueing delay of TCP packets or even discarding some packets due to buffer overflow. To compute the goodput, we resort to OneProbe [19] to measure the RTT and loss rate for the network path with a particular bandwidth configuration. 2) Rebuffering frequency: Given a video’s length of l (in seconds), the rebuffering frequency estimate is given by � 0, if β ≥ λ, f\ = (4) rebuf nrebuf /l, otherwise, where nrebuf
=
l′
=
brebuf
=
�
l′ brebuf
�
,
� � β l − Bf ull / 1 − , λ � � β . (Bf ull − Bempty ) / 1 − λ
(5) (6) (7)
C. Measuring the APMs from clients We have implemented a customized Flash video player, named FlashTrack, to compute the actual APMs based on the status of video playbacks obtained from the client. FlashTrack uses the Flash Netstream class to record the buffer status and current playhead time every 0.25 seconds, and special events, such as empty buffer. We have used the property BufferTime in the Netstream class to adjust the size of the player buffer. The buffer must be filled up before starting the playback or after the rebuffering event. In our experiments, we set BufferTime to 3 seconds, because we have observed that it is the value possibly used by YouTube. D. Testbed experiments Figure 3 shows the testbed setup for evaluating our model for the correlation between network QoS and application QoS. A web server was installed with Ubuntu 10.04 (kernel 2.6.3222) and Apache 2.2.14 to host video clips for a client to download and play using FlashTrack. The client ran Ubuntu 9.04, Firefox 3.6.8, and Flash Player 10.1. The TCP congestion avoidance algorithm for both machines were configured as “Reno.” A Click router [18] was installed between the server and the client to emulate different network bandwidths, packet loss rates and RTTs. BW, RTT, Packet Loss FlashTrack
Video Clip
Browser
Client
Click Router Web server Cross Traffic Sink Cross Traffic Source
Fig. 3: A testbed setup for evaluating the correlation between network QoS and application QoS.
Table I lists the network QoS parameters emulated by the Click router. The bandwidth was chosen between 1 Mbits/s and 15 Mbits/s to emulate the bandwidth of common home users, while 100 Mbits/s was chosen to serve as a control. The choices for RTT represent the local, inter-continent, and transoceanic paths. We also varied the round-trip packet loss rate from 0% to 8% to investigate the impact of packet
TABLE I: The network QoS parameters emulated by the Click router. Network QoS
Parameters
Network bandwidth (Mbits/s) RTT (ms) Round-trip packet loss rate (%)
1, 5, 10, 15, 100 0, 25, 50, 75, 100 0, 2, 4, 6, 8
For every set of parameters, we ran FlashTrack from the client to download a video clip from the web server for three trials. The browser’s cache folder was first cleared, and the private mode of the Firefox was used to ensure that the video will not be saved to the local cache after quitting the browser. The video clip was extracted from the movie tailer of “The Twilight Saga: New Moon” which belongs to the type of “Movies, movies tailers” stated in the VQEG test plan. Table II summarizes the specification of the video clip. TABLE II: A specification of the video used in the testbed experiments and QoE assessment. Items
Parameters
Video length Video format Audio format Resolution File size Frame rate File format
87 seconds H.264 ACC 864×480 10.6 MBytes 23.97 fps FLV
Figure 4 shows the histograms of the actual APMs measured by FlashTrack under different network QoS parameters specified in Table I. The results are the averages from three independent trials. The bars with different grey levels represent different emulated bandwidths. The x-axis is the delay, whereas the y-axis is the packet loss rate. As shown in Figure 4, all three APMs increase with the packet loss rate and delay, but decrease with the network bandwidth. As shown in Figures 4(a) and 4(c), the distributions of Tinit and Trebuf exhibit similar patterns. Moreover, Figure 4(b) shows that frebuf is significantly reduced by the network path with high bandwidth and low packet loss rate. frebuf reaches near the maximum value, which is obtained from Equation (8), when the delay is larger than 50 ms with loss rate greater than 4%. We now compare the three APMs estimated by our model with the actual APMs obtained by FlashTrack. To obtain the (round-trip) packet loss rate and RTT for Equation (3), we ran OneProbe [19] from the client to measure the network path between the web server and itself. OneProbe was executed three seconds after launching FlashTrack with a periodic probe rate of 2 Hz for 60 seconds. Based on OneProbe measurement, we computed the median RTT and average packet loss rate which are the parameters for estimating the TCP goodput.
Figure 5 shows the cumulative distribution function (CDF) of relative errors between the APM estimates and actual APMs. We compute the relative errors by (ˆ x − x)/x, where x ˆ and x are the APM estimates and the actual APMs, respectively. As shown, more than 90% of the rebuffering frequency estimates have errors less than 50%, while over 75% of rebuffering duration estimates and over 60% of initial buffering time estimates have errors less than 50%. The larger error in the initial buffering time estimates is probably due to a small congestion window at the beginning of the connection which limits the packet sending rate. However, the TCP throughput model assumes that the flow has already been in the steady state, thus overestimating the TCP goodput. 1
f
rebuf
0.8 CDF
loss. Moreover, we introduced background cross traffic to the forward path of the web server using D-ITG [5]. The cross traffic was a TCP flow with packet size drawn from Pareto distribution of shape 1.2 and exponential inter-departure time with mean 500 ms, and had the average bitrate of around 100 kbits/s.
0.6
Tinit T
rebuf
0.4 0.2 0 −1.2
−0.5 0 0.5 Relative Error
1.2
Fig. 5: The CDF of relative errors between the APM estimates and actual APMs.
We have further investigated the rebuffering frequency by using our analytical model. As will be seen later, the rebuffering frequency is the major factor affecting the QoE. Figure 6 shows the rebuffering frequency for different buffer sizes and goodput-to-bitrate ratio (β/λ) with l = 87 seconds (same as the length of the video clip for the previous experiment). As shown, the rebuffering frequency decreases with β/λ and Bf ull , because a small buffer is used up quickly especially for a small TCP goodput (or large bitrate). When Bf ull is greater than 10 seconds, the rebuffering frequency stays at a low level (even if β/λ is small), because the maximum rebuffering event is bounded by the video length. IV. T HE Q O E MEASUREMENT We have performed a subjective assessment to measure QoE of Flash video perceived by users and to quantify how the QoE is influenced by the application QoS (i.e., the APMs). To this end, we have implemented a platform using Flash to emulate video playback under various levels of APMs as shown in Table III. We divide each APM into three levels (low, medium, and high) which are based on the 25th , 50th , and 75th percentiles of the actual APMs (obtained by FlashTrack) reported in section III-D. Instead of delivering the video in real time, we simulate the rebuffering events by pausing and resuming the video, during which a message “buffering . . . ” and the current buffering
6
0 8
50 25
4
2 0 Loss rate /%
100 75
Delay /ms
6
2 0 Loss rate /%
0
25
4
50 Delay /ms
0
(a) Tinit .
rebuf
75
0.2
40 20
T
100
/s
0.4 rebuf
40 20 0 8
1 Mbit/s 5 Mbits/s 15 Mbits/s 100 Mbits/s
1 Mbit/s 5 Mbits/s 15 Mbits/s 100 Mbits/s
f
Tinit /s
1 Mbit/s 5 Mbits/s 15 Mbits/s 100 Mbits/s
0 8
100 75 6
50 25
4
2 0 Loss rate /%
(b) frebuf .
Delay /ms
0
(c) Trebuf .
Fig. 4: The three APMs under different network path quality.
1.5
d frebuf
1
0.5
0 0 0.5
β/λ
1 0
5
B
10
15
full
Fig. 6: The rebuffering frequency estimates for a 87-second video clip under different buffer sizes and goodput-to-bitrate ratios. TABLE III: Three levels of application performance based on the APMs. Level Low Medium High
Tinit
APMs frebuf
Trebuf
0 − 1 seconds 1 − 5 seconds > 5 seconds
0 − 0.02 0.02 − 0.15 > 0.15
0 − 5 seconds 5 − 10 seconds > 10 seconds
progress are shown on the interface. The advantage of this approach (over generating video playback in real time) is to minimize the variations (e.g., network conditions) among different subjects during the QoE measurement. To minimize the subjective bias, the player’s interface, similar to common video sharing web sites, includes a progress bar showing the video playhead time, buffered video length, and video’s length. Each subject participating in the subjective assessment was required to fill in their basic personal information (e.g., gender and age) and watched the same video clip specified in Table II for 30 rounds, which include all the possible combinations of APM levels (33 = 27) and three replications to validate the reliability of the subjects’ scoring. The replications were based on the APM levels randomly selected from all the 27 possibilities. After each round, the subject was asked to give a score immediately, and the whole experiment did not last more than an hour to avoid burdening the subject. Due to this time limitation, the duration of each round was limited to 120 seconds. Therefore, the subjects may not watch the video completely in every round. Finally, the sequence of
video playback was randomly shuffled by a pseudo random function (Math.random in Flash) to mitigate the possible ordering bias resulted from the watching sequence. After excluding three outliers who produced unreliable scores, we have successfully examined ten subjects: seven of them are male and three of them are female. Their ages ranged between 23 and 35. All of them were non-experts in evaluating video quality. For each combination of the APM levels, we use the scores obtained from the ten subjects to compute a MOS and therefore obtain 27 MOSes to represent the QoE of the Flash video. An ANOVA analysis reveals that the rebuffering frequency is the only main factor influencing the MOS. Users are generally annoyed by the video pausing due to the rebuffering events. Moreover, there is no interaction of variables. As a result, a higher rebuffering frequency will generally lower the user-perceived quality. The effects of the initial buffering and mean rebuffering duration, on the other hand, are not significant, because users are generally willing to tolerate a longer start-up delay for a better video-watching experience. We have performed a regression analysis to acquire a relationship between QoE and application QoS. As shown in Equation (9), the coefficients of the three APMs are all negative, thus a higher level of APMs giving a lower MOS. MOS = 4.23 − 0.0672Lti − 0.742Lf r − 0.106Ltr ,
(9)
where Lti , Lf r and Ltr are the respective levels of Tinit , frebuf , and Trebuf . We use 1, 2, and 3 to represent the “low”, “medium”, and “high” levels, respectively. To minimize the variability caused by the video content, only one video clip is used in the subjective experiment. We performed pilot studies on four other video clips of different content—-sports game, news, TV comedy show and music video. Figure 7 plots the MOS against the three levels of rebuffering frequency. The result shows that the level of rebuffering frequency is negatively correlated with the MOS, which is consistent with our previous findings. Quantifying the correlation of various video types will be our future work. V. C ORRELATING Q O E
WITH NETWORK
QOS
We now describe our methodology for correlating QoE of HTTP video streaming with network QoS. Specifically,
4
Sports News TV Comedy Show Music Video
MOS
3.5 3
Loss rate 8% Delay e100ms Delay 75ms d’ Delay 50ms Loss rate 6%
MOS
>1 >2 >3
Delay 25ms
Loss rate 4%
B
Loss rate 2%
8%
BW Unlimited A Loss rate 0%
6%
100ms
Delay 0ms BW Unlimited BW 15Mbps
4% 75ms
2.5
2%
50ms
BW 15Mbps
25ms
BW 10Mbps
0% 0ms
2
BW 5Mbps
BW 10Mbps Unlimited
1.5 Low
Medium Levels of frebuf
High
Fig. 7: MOS against levels of frebuf for four types of video clips.
BW 5Mbps BW 1Mbps d
A. Visualizing the correlation Figure 8 shows the radar chart that maps network QoS to QoE. The MOS is divided into three levels – greater than 1, 2 and 3, which are represented using different color levels. The network path metrics with the same MOS level are bounded into areas. Sectors AB, BC, and CA fix one of the network path metrics to the “best” value – unlimited bandwidth, zero packet delay and zero packet loss rate, respectively. The other two metrics, on the other hand, vary within the sector. The three axes A, B, and C in the chart extended from the center of the circle vary one of the network metrics from the best to the worst. Moreover, the values of axes A, B and C belong to sectors dd′ , ee′ , and f f ′ respectively. For example, in sector Ad′ , while the bandwidth is unlimited, the packet loss rate increases from 0% to 8% in clockwise direction and the packet delay increases from the center to the edge of the chart. Therefore, we could observe how the two network metrics interact with each other. As shown in Figure 8, both packet loss rate and packet delay are the dominating factors affecting the QoE. Sector AB of the chart, which varies the packet loss rate and packet delay, is mainly a dark color region (i.e., a low MOS). This effect is also reflected in the large light color regions shown in sectors CA (with zero packet loss rate) and BC (with zero packet delay). However, a very small RTT (packet loss rate) could partially compensate the low QoE due to the packet loss (high packet delay). For example, a small region of semi-light color region in sector Ad′ could still be seen even for high packet loss rate.
f Loss rate 8%
10M
Delay 100ms f’ Delay 75ms
we first estimate the three APMs for a given network QoS (measured by OneProbe) using our model presented in section III-B. With the three APM estimates, we then look up their levels according to Table III and finally obtain the corresponding MOSes to represent the user-perceived performance under the network path quality. Moreover, we use the radar chart proposed in [8] to inspect the correlation between the QoE and network QoS. For the network QoS parameters, the bandwidth varies from 1 Mbit/s to unlimited, delay from 0 ms to 100 ms, and packet loss rate from 0% to 8%.
e’BW 1Mbps
15M
Loss rate 6%
5M
1M
Loss rate 4%
Delay 50ms C Loss rate 2% Delay 25ms Loss rate 0% Delay 0ms
Fig. 8: The radar chart mapping network QoS with QoE.
B. Applications We demonstrate how the quality of HTTP video streaming can be predicted based on network QoS obtained from our recent Internet measurement study. We have conducted OneProbe measurement from a probing machine located at a local university in Hong Kong to the Lenovo web server in China between 26 August 2010 to 7 September 2010 (UTC). Since OneProbe uses HTTP requests as probe packets to elicit HTTP data response packets from remote web servers, we expect that OneProbe can observe similar network path quality experienced by the HTTP video streaming traffic. During the measurement period, the measuring node performs one-minute OneProbe measurement every ten minutes. Figure 9 shows the time series of the median RTT and average round-trip packet loss rate obtained from the twoweek network measurement. The solid (blue) line is the RTT, and the green lines close to the x-axis is the average round-trip packet loss rate. The grey-scale spectrum at the background shows the MOS estimated by our model. The lighter color in the spectrum represents a higher MOS score (i.e., better QoE) for users in watching videos hosted by the web server. We observe diurnal RTT and loss rate patterns throughout the measurement period. Moreover, the MOS is dominated by the packet loss rate, because the dark grey areas coincide mainly with higher packet loss rate, particularly on 26 August and 5 September when the packet loss rate reached around 5%. On the other hand, only sparse grey lines appear in the RTT inflation periods, thus implying that the users could still perceive an acceptable level of video quality. VI. D ISCUSSION In the previous sections, we consider the round-trip packet loss rate for evaluating the application QoS. However, network path asymmetry is a common phenomenon in the Internet, and it introduces different impacts on the TCP performance [6]. We therefore investigate the effect of packet loss asymmetry on the performance of HTTP video streaming by evaluating
Fig. 9: Time series of the HTTP video streaming’s MOS, and the RTT and packet loss rate of the network path.
the APMs measured by FlashTrack under our testbed. To this end, we configured the testbed with network bandwidth of 5 Mbits/s, RTTs of {25, 100} ms, and packet loss rate between 0% and 8% on a unidirectional path (forward or reverse path), while keeping the loss rate in the opposite direction to zero. Let A (f, r) be the measured APM under forward-path and reverse-path packet loss rates of f and r, respectively. We compute the APM difference ∆asy (A (p)) = A (p, 0) − A (0, p) for a loss rate p. Figures 10(a)-10(c) show the values of ∆asy (Tinit ), ∆asy (frebuf ), and ∆asy (Trebuf ) for different packet loss rates. The solid line and the dashed line show the results for RTTs of 25 ms and 100 ms, respectively. As shown, the APM differences are all positive, meaning that the forwardpath packet loss introduces a more significant impact on the application QoS. When packet loss occurs in the forward path, the corresponding video data has to be retransmitted from the server, thus reducing the TCP goodput. However, packet loss in the reverse path affects mainly the ACK packets from the client, and a lost ACK packet could be compensated by a succeeding ACK packet with a higher acknowledgement number. Furthermore, the APM difference is more significant under the higher RTT as a result of slower packet retransmissions. We also consider the effect of different TCP variants on the application QoS. While TCP Reno considered in the previous sections is supported by most operating systems, TCP Cubic [10] and Compound TCP [22] are the default congestion avoidance algorithms used by Linux and Microsoft Windows, respectively. These congestion avoidance algorithms could improve the fairness and throughput by better estimates of the TCP congestion window. Previous work [3] shows that TCP Cubic outperforms Compound TCP and New Reno in terms of goodput. To investigate the effect of TCP variants, we carried out another set of experiments under the same testbed except that TCP Cubic is used for both the client and server. We compare the performance by computing the APM difference ∆c (A) = Ac − Ar , where Ac and Ar are the respective APMs measured by FlashTrack under TCP Cubic and TCP Reno. Figures 11(a)-11(c) show the APM differences of various packet loss rates and RTTs under a constant bandwidth of 5 Mbits/s. We also repeated the experiments with RTTs of {25, 100} ms. As shown, the advantage of using TCP
Cubic is not significant. For an RTT of 25 ms, ∆c (Tinit ) shows approximately the same performance, except for some performance gain when the loss rate increases to 8%. On the other hand, ∆c (frebuf ) slightly decreases at a low loss rate. The performance of TCP Cubic is better when the delay increases to 100 ms, but only less than 10 seconds of reduction in ∆c (Tinit ) and ∆c (Trebuf ). Moreover, ∆c (frebuf ) decreases when the loss rate is 2%, implying a reduction of the rebuffering events. The TCP Cubic could maintain a larger congestion window in the presence of occasional loss events. Therefore, TCP Cubic receives a performance gain at loss rate less than 6%. However, when the loss is too heavy, none of the TCP variants can have a clear performance advantage. VII. C ONCLUSIONS In this paper, we studied how network path quality affects QoE of HTTP video streaming. We addressed the problem by dividing it into two subproblems: measuring the correlation between the network QoS and application QoS, and measuring the correlation between application QoS and QoE. In the first subproblem, we proposed three application performance metrics for HTTP video streaming and used both analytical model and empirical evaluation to characterize their correlation. In the second subproblem, subjective assessments were conducted to correlate the MOS and the application QoS. Our main finding is that network throughput is lowered by packet losses and the RTT, thus increasing the rebuffering frequency. We also identified the rebuffering frequency to be the main factor responsible for the MOS variance. This shows that the temporal structure, instead of spatial artifacts, is also an important factor affecting the QoE. The QoE could be improved by both network QoS or application QoS management. Moreover, our approach allows us to inspect the correlation between QoS and the QoE from different aspects, and the approach could be easily applied to other application environments. ACKNOWLEDGMENTS This work is partially supported by a grant (ref. no. ITS/355/09) from the Innovation Technology Fund in Hong Kong and a grant (ref. no. H-ZL17) from the Joint Universities Computer Centre of Hong Kong.
0.2
40
Delay 25ms Delay 100ms
∆
∆
0.3
asy rebuf
20
asy
(T
init
) /s
30
)
0.4
∆asy(Trebuf) /s
Delay 25ms Delay 100ms
(f
40
10 0 0
0.1 2
4 Loss rate /%
6
0 0
8
(a) Initial buffering time.
2
4 Loss rate /%
6
(b) Rebuffering frequency.
30 20 10 0 0
8
Delay 25ms Delay 100ms
2
4 Loss rate /%
6
8
(c) Mean duration of a rebuffering event.
Fig. 10: The APM differences under different asymmetric loss rates, bandwidth of 5 Mbits/s, and RTTs of {25, 100} ms.
0.01 0
−0.01
c
∆ (T
init
0
1
Delay 25ms Delay 100ms
∆c(Trebuf) /s
Delay 25ms Delay 100ms
∆c(frebuf)
) /s
5
−5
−0.02
2
4 Loss rate /%
6
(a) Initial buffering time.
8
0
0 −1 −2
−0.03 −10 0
Delay 25ms Delay 100ms
2
4 Loss rate /%
6
(b) Rebuffering frequency.
8
0
2
4 Loss rate /%
6
8
(c) Mean duration of a rebuffering event.
Fig. 11: The APM differences for two TCP variants under different round-trip loss rates, bandwidth of 5 Mbits/s, and RTTs of {25, 100} ms.
R EFERENCES [1] The Video Quality Experts Group (VQEG). http://www.its.bldrdoc.gov/ vqeg. [2] Youtube video speed history. http://www.youtube.com/my speed. [3] I. Abdeljaouad, H. Rachidi, S. Fernandes, and A. Karmouch. Performance analysis of modern TCP variants: A comparison of Cubic, Compound and New Reno. In Proc. QBSC, 2010. [4] Adobe. Video technology center, delivery: Progressive download. http: //www.adobe.com/devnet/video/progressive.html. [5] S. Avallone, S. Guadagno, D. Emma, A. Pescape, and G. Ventre. D-itg distributed internet traffic generator. In Proc. QEST, 2004. [6] H. Balakrishnan, V. Padmanabhan, G. Fairhurst, and M. Sooriyabandara. TCP performance implications of network path asymmetry, 2002. [7] J. Case, M. Fedor, M. Schoffstall, and J. Davin. Simple Network Management Protocol (SNMP). RFC 1157, IETF, May 1990. [8] Y. Chang, C. Chang, K. Chen, and C. Lei. Radar chart: Scanning for high QoE in QoS dimensions. In Proc. IEEE CQR, June 2010. [9] B. Choi, S. Moon, R. Cruz, Z. Zhang, and C. Diot. Practical delay monitoring for ISPs. In Proc. ACM CoNEXT, 2005. [10] S. Ha, I. Rhee, and L. Xu. CUBIC: A new TCP-friendly high-speed TCP variant. SIGOPS Oper. Syst. Rev., 42(5):64–74, 2008. [11] D. Hands and M. Wilkins. A study of the impact of network loss and burst size on video streaming quality and acceptability. Lecture Notes in Computer Science, pages 45–57, 1999. [12] Q. Huynh-Thu and M. Ghanbari. Temporal aspect of perceived quality in mobile video broadcasting. IEEE Trans. on Broadcasting, 54(3):641 – 651, 2008. [13] Q. Huynh-Thu and M. Ghanbari. No-reference temporal quality metric for video impaired by frame freezing artefacts. In Proc. of ICIP, 2009. [14] ITU-T Recommendation P.800. Methods for subjective determination of transmission quality, August 1996. [15] ITU-T Recommendation P.911. Subjective audiovisual quality assessment methods for multimedia applications, December 1998. [16] R. Karki, T. Seenivasan, M. Claypool, and R. Kinicki. Performance analysis of home streaming video using Orb. In Proc. NOSSDAV, 2010. [17] T. Kim and M. Ammar. Receiver buffer requirement for video streaming over TCP. In Proc. SPIE, pages p. 422–431, 2006.
[18] E. Kohler, R. Morris, B. Chen, J. Jannotti, and M. F. Kaashoek. The click modular router. ACM Trans. Comput. Syst., 18(3):263–297, 2000. [19] X. Luo, E. Chan, and R. Chang. Design and implementation of TCP data probes for reliable and metric-rich network path monitoring. In Proc. USENIX Annual Tech. Conf. 2009, 2009. [20] Nielsen. YouTube maintains top ranking by total streams and Hulu grows 490 percent year-over-year, April 2009. http://en-us.nielsen.com/ main/news/news releases/2009/may/youtube maintains. [21] J. Padhye, V. Firoiu, D. Towsley, and J. Kurose. Modeling TCP Reno performance: A simple model and its empirical validation. IEEE/ACM Trans. Netw., 8(2):133–145, 2000. [22] K. Tan and J. Song. Compound TCP: A Scalable and TCP-friendly Congestion Control for High-speed Networks. In Proc. PFLDNet, 2006. [23] S. Tasaka and Y. Ishibashi. Mutually compensatory property of multimedia QoS. In Proc. ICC, 2002. [24] S. Tasaka and Y. Watanabe. Real-time estimation of user-level QoS in audio-video IP transmission by using temporal and spatial quality. In Proc. IEEE GLOBECOM, 2007. [25] P. Varga, G. K´un, G. Sey, I. Moldov´an, and P. Gelencs´er. Correlating user perception and measurable network properties: Experimenting with QoE. Autonomic Principles of IP Operations and Management, pages 218–221, 2006. [26] O. Verscheure, P. Frossard, and M. Hamdi. MPEG-2 video services over packet networks: Joint effect of encoding rate. In Proc. NOSSDAV, 1998. [27] B. Wang, J. Kurose, P. Shenoy, and D. Towsley. Multimedia streaming via TCP: An analytic performance study. ACM Trans. Multimedia Comput. Commun. Appl., 4(2):1–22, 2008. [28] Z. Wang, S. Banerjee, and S. Jamin. Studying streaming video quality: from an application point of view. In Proc. ACM Multimedia, 2003. [29] W. Wu, A. Arefin, R. Rivas, K. Nahrstedt, R. Sheppard, and Z. Yang. Quality of experience in distributed interactive multimedia environments: Toward a theoretical framework. In Proc. ACM Multimedia, 2009. [30] X. Zhou, H. Uijterwaal, R. E. Kooij, and P. Van Mieghem. Estimation of perceived quality of service for applications on IPv6 networks. In Proc. ACM PM2HW2N, 2006.