Beiträge zur Tabakforschung International/ Contributions to Tobacco Research Volume 26 @ No. 4 @ December 2014 DOI: 10.1515/cttr-2015-0006
Particle Size Distribution of E-Cigarette Aerosols and the Relationship to Cambridge Filter Pad Collection Efficiency * by Steven L. Alderman, Chen Song, Serban C. Moldoveanu, and Stephen K. Cole R.J. Reynolds Tobacco Co., 950 Reynolds Blvd., Winston-Salem, NC 27105, USA
SUMMARY The relatively volatile nature of the particulate matter fraction of e-cigarette aerosols presents an experimental challenge with regard to particle size distribution measurements. This is particularly true for instruments requiring a high degree of aerosol dilution. This was illustrated in a previous study, where average particle diameters in the 10–50 nm range were determined by a high-dilution, electrical mobility method. Total particulate matter (TPM) masses calculated based on those diameters were orders of magnitude smaller than gravimetrically determined TPM. This discrepancy was believed to result from almost complete particle evaporation at the dilution levels of the electrical mobility analysis. The same study described a spectral transmission measurement of e-cigarette particle size in an undiluted state, and reported particles from 210–380 nm count median diameter. Observed particle number concentrations were in the 109 particles/cm3 range. Additional particle size measurements described here also found e-cigarette particle size to be in the 260–320 nm count median diameter range. Cambridge filter pads have been used for decades to determine TPM yields of tobacco burning cigarettes, and collection of e-cigarette TPM by fibrous filters is predicted to be a highly efficient process over a wide range of filtration flow rates. The results presented in this work provide support for this hypothesis.
Described here is a study in which e-cigarette aerosols were collected on Cambridge filters with adsorbent traps placed downstream in an effort to capture any material passing through the filter. Amounts of glycerin, propylene glycol, nicotine, and water were quantified on the filter and downstream trap. Glycerin, propylene glycol, and nicotine were effciently captured (> 98%) by the upstream Cambridge filter, and a correlation was observed between filtration efficiency and the partial vapor pressure of each component. The present analysis was largely inconclusive with regard to filter efficiency and particle-vapor partitioning of water. [Beitr. Tabakforsch. Int. 26 (2014) 183–190] KEYWORDS: Electronic cigarette, aerosol, particle size, filtration efficiency ZUSAMMENFASSUNG Die relativ flüchtige Natur der Partikelfraktion von EZigaretten-Aerosol stellt hinsichtlich der Messungen zur Partikelgrößenverteilung eine experimentelle Herausforderung dar. Dies gilt im besonderen Maße für Geräte, die einen hohen Grad der Aerosolverdünnung erfordern. Dies wurde in einer vorangegangenen Studie dargestellt, in der die mittleren Partikeldurchmesser im Bereich von
*Received: 30rd June 2014 – accepted: 20th November 2014
Brought to you by | CAPES Authenticated Download Date | 1/19/16 5:50 PM
10–50 nm durch eine Methode elektrischer Beweglichkeit mit hoher Verdünnung bestimmt wurden. Die auf der Grundlage dieser Durchmesser errechneten Gesamtpartikelmassen (TPM) waren um Größenordnungen kleiner als die gravimetrisch ermittelten TPM-Werte. Es wurde davon ausgegangen, dass diese Diskrepanz von der fast vollständigen Partikelverdunstung bei den Verdünnungsstufen der elektrischen Beweglichkeitsanalyse herrührte. In derselben Studie wurde eine spektrale Transmissionsmessung der E-Zigaretten-Partikelgröße in unverdünntem Zustand beschrieben und Partikel mit einem medianen Durchmesser bezüglich der Anzahl (CMD) von 210–380 nm berichtet. Die beobachteten Partikelanzahlkonzentrationen lagen im Bereich von 109 Partikel/cm3. Mit zusätzlichen Partikelgrößenmessungen wurde hier außerdem festgestellt, dass die Größe der E-Zigarettenpartikel im Bereich von 260–320 nm medianem Durchmesser bezüglich der Anzahl (CMD) lag. Jahrzehntelang wurden Cambridge-Filter verwendet, um die TPM-Ausbeute von Tabakzigaretten zu bestimmen, und es ist zu erwarten, dass das Auffangen von E-Zigaretten-TPM mit Faserfiltern bei einem breiten Spektrum an Filtrationsflussraten ein hocheffizienter Prozess ist. Die in dieser Arbeit vorgestellten Ergebnisse stützen diese Hypothese. Darin wird eine Studie beschrieben, in der E-Zigaretten-Aerosol mit Cambridge-Filtern und nachgeschalteten adsorbierenden Abscheidern aufgefangen wurde, in dem Versuch, sämtliches den Filter passierendes Material einzufangen. Auf dem Filter und in den nachgeschalteten Abscheidern wurden die Mengen von Glycerin, Propylenglykol, Nikotin und Wasser quantifiziert. Glycerin, Propylenglykol und Nikotin wurden durch den vorgeschalteten CambridgeFilter effizient aufgefangen (> 98%), und zwischen der Filtrationseffizienz und dem Partialdampfdruck jeder Komponente wurde eine Korrelation beobachtet. Die vorliegende Analyse war hinsichtlich der Filtereffizienz und der Partikel-Dampf-Verteilung von Wasser in weiten Teilen nicht schlüssig. [Beitr. Tabakforsch. Int. 26 (2014) 183–190] RESUME La nature relativement volatile de la fraction de matière particulaire dans les aérosols de cigarettes électroniques représente un défi expérimental concernant les méthodes pour mesurer la distribution des tailles de ces particules. Cela est particulièrement vrai pour les instruments nécessitant un haut degré de dilution des aérosols. Ceci a été illustré dans une étude précédente, où une méthode de mobilité électrique à dilution élevée a permis de déterminer des diamètres moyens de particules dans la plage de 10 à 50 nm. Les masses de matière particulaire totale (MPT) calculées sur la base de ces diamètres présentaient des ordres de grandeur inférieurs à ceux des MPT déterminés par gravimétrie. Il a été supposé que cet écart était le résultat d’une évaporation presque complète des particules aux niveaux de dilution de l’analyse de la mobilité électrique. La même étude a décrit une mesure de la transmission spectrale des tailles des particules des cigarettes électroniques dans un état non dilué, et a rapporté des particules dont le diamètre médian était situé dans une
plage de valeurs de 210 à 380 nm. Les concentrations du nombre de particules observées étaient situées dans la plage des particules 109/cm3. Des mesures additionnelles de la taille des particules décrites ici ont également indiqué des tailles de particules de cigarettes électroniques situées dans la plage de valeurs comprise entre 260 à 320 nm pour le diamètre médian. Des tampons de filtres Cambridge ont été utilisés pendant des décennies pour déterminer des rendements de MPT de cigarettes incandescentes, et la collecte des MPT de cigarettes électroniques par des filtres fibreux devrait être un processus hautement efficace pour une large gamme de taux de flux de filtration. Les résultats présentés dans ce manuscrit fournissent un appui à cette hypothèse. L’étude décrite ici est une étude dans laquelle les aérosols de cigarettes électroniques ont été collectés sur des filtres Cambridge avec des pièges absorbants placés en aval dans un effort pour capturer n’importe quelle matière passant à travers le filtre. Des quantités de glycérine, de propylène glycol, de nicotine et d’eau ont été mesurées sur le filtre et sur le piège en aval. La glycérine, le propylène glycol et la nicotine ont été capturés avec efficacité (> 98%) par le filtre Cambridge en amont et une corrélation a été observée entre l’efficacité de la filtration et la pression partielle de vapeur de chaque composant. La présente analyse a été très peu concluante concernant l’efficacité du filtre et le partage particules-vapeur de l’eau. [Beitr. Tabakforsch. Int. 26 (2014) 183–190] INTRODUCTION Particle size distribution (PSD) measurements of mainstream tobacco smoke have been of interest to researchers in various fields for several decades (1–6). Accurate particle size distribution measurements provide a starting point for respiratory deposition calculations, although factors other than particle size also play a role in regional and total aerosol deposition (7–8). The particle removal efficiency of various types of filters is, in part, dependent on particle size (9–10). Additionally, insight into mechanistic smoke formation and transport effects can be gained by particle size analyses. However, the dynamic qualities of mainstream smoke present a considerable experimental challenge. In particular, a particle number density on the order of 109–1010 particles/cm3 and the presence of components across a range of volatilities have complicated size measurements. Often, mainstream smoke PSD measurements are preceded by significant dilution of the aerosol. This is done to minimize the effects of coagulation, which can result in significant and rapid changes in the PSD of the undiluted smoke. Aerosol dilution is also required to lower aerosol concentrations to within the operational range of some types of measurement instrumentation, e.g., electrical low pressure impactors and fast electric mobility analyzers. However, it has been established that significant amounts of particulate matter can evaporate under typical dilution levels, owing to the presence of volatile components in mainstream smoke (11–12). The result is that the PSD measured is not reflective of the PSD exiting the cigarette. “Vapor” is often used to describe the effluent from ecigarettes and this terminology appears to be entrenched in
184 Brought to you by | CAPES Authenticated Download Date | 1/19/16 5:50 PM
common parlance and can be found in numerous scientific documents. This is a technical inaccuracy and implies that only gas-phase material is produced. The observation of visually detectable light scattering from the effluent, which can be observed upon puffing an e-cigarette into a clear syringe, for example, unambiguously establishes the presence of a particulate phase. Therefore, the output from an e-cigarette is accurately described as an aerosol, which is composed of a particulate phase dispersed in a gaseous medium. Aerosols may be further classified according to their formation mechanism and particle size range, e.g., dust, fume, smoke, mist. E-cigarette aerosol is best described as a mist, which is an aerosol formed by condensation or atomization composed of spherical liquid droplets in the sub-micrometer to 200 µm size range (13). The gas phase of e-cigarette aerosols will be composed primarily of ambient atmospheric species, e.g., oxygen and nitrogen, drawn in and through the device during puffing. Additionally, components of the e-liquid1 used to generate the aerosol can exist at some level in an actual, non-condensed vapor phase. This distinction will need to be made clear to avoid confusion when discussing issues such as particle-vapor partitioning of e-cigarette aerosols. Partially owing to their newness, there is limited information available on reliable PSD measurements of e-cigarette aerosols. Furthermore, technical obstacles analogous to those encountered during tobacco burning cigarette aerosol measurements, i.e., high number concentrations and a particulate matter component containing volatile material, generally complicate accurate characterizations. One recent report on e-cigarette particle size and number concentration measurements by INGEBRETHSEN et al. (14) described a procedure based on the measurement of the wavelength dependence of transmitted light intensity through the aerosol, termed spectral extinction. Particle size information was extracted from the data by the best-fit comparisons to theoretical calculations. A particular advantage of their methodology is that no dilution of the aerosol was required, thus potential artifacts from particulate matter evaporation is eliminated. They examined both e-cigarette and tobacco burning cigarette aerosols and compared spectral transmission results to size measurements of the same aerosols made with a fast electrical mobility analyzer. They further assessed the reliability of each measurement by comparing aerosol-property-derived particulate matter mass to mass obtained by gravimetric Cambridge filter measurements. They observed that the particulate matter component of e-cigarette aerosol underwent nearly complete evaporation at the dilution levels required for fast electric mobility analysis, with DMS500 reported count mean diameters in the 20–30 nm range. Furthermore, particulate mass calculated from the DMS500 measured aerosol properties was orders of magnitude less than gravimetric filter collected mass. Conversely, spectral transmission measurements made in the undiluted state yielded particle count median diameters ranging from 210–390 nm and particle number concentrations were in the 109 particles/cm3 range. These values are comparable to those of tobacco burning cigarette
1
The colloquial term "e-liquid" denotes the aerosol-precursor liquid found in electronic cigarettes. As in the case of "e-cigarette", the term "e-liquid" is gaining acceptance in the scientific literature.
smoke (12, 15–17). Furthermore, aerosol mass calculated from these parameters was generally consistent with filtercollected gravimetric mass. With evidence to suggest that e-cigarette particle size is similar to particle size observed for tobacco burning cigarettes, and knowledge that high efficiency fibrous filters such as Cambridge pads are qualified at 0.3 µm (approximately the least efficiently captured size), it is expected that Cambridge pad sample collection methodology already in use for traditional cigarettes will be applicable for e-cigarette analyses. This work describes the results of a study where a cascade impactor was used to measure e-cigarette PSD. This was done in an effort to verify the measurements reported previously by INGEBRETHSEN et al. (14). Additionally a model-based, theoretical examination of Cambridge pad filtration efficiency as a function of particle size and flow rate is presented. The model-based predictions are largely confirmed from the results of an additional experimental study, where the fraction of e-cigarette-generated glycerin (GLY), propylene glycol (PG), nicotine (NIC), and water captured on a Cambridge pad filter was compared to the fraction captured on a downstream vapor trap. The data indicate that PG, GLY, and NIC largely reside in the condensed, particulate matter fraction of the aerosol and are efficiently captured by Cambridge filters under representative flow rates. Results on particle-vapor partitioning of water are largely inconclusive. EXPERIMENTAL Cascade impactor particle size distribution measurements An in-house built system was used to generate and collect aerosols from the e-cigarettes. The system is comprised of a solenoid valve, a needle valve, a MSP Model 135 Mini MOUDI impactor and a vacuum pump. The impactor requires a flow rate of 2 L/min, which is set using the needle valve and checked routinely using a Gilian Gilibrator. The solenoid valve is programmed to open for a target puff duration of 3 s, creating essentially a square wave, constant flow puff shape. Two e-cigarettes were connected to the inlet of the impactor by use of a tee and were sampled simultaneously. This was done in order to reduce the puff flow rate per cigarette to approximately 16.7 cm3/s. Thus, a 3 s puff duration resulted in a total puff volume of 50 mL per e-cigarette. Ideally, we would have preferred to employ a 55 mL puff volume of 3 s duration in order for the puffing regimen to match that of studies described later in the manuscript. However, the 2 L/min flow rate requirement of the cascade impactor, coupled with our desire not to introduce dilution or “make-up” air resulted in a 50 ml puff volume being employed. Particle size distributions were determined by collecting eight puffs total (four per e-cigarette) with a 30 s inter-puff interval. Three e-cigarette brands (designated E-cig A, B and C) were evaluated. E-cig A and E-cig B were both rechargeable models, with “cartomizer” type cartridges and E-cig C was a disposable model. All components were connected by conductive silicone rubber tubing to minimize particle loss during sampling. Aluminum foil substrates (37 mm in 185
Brought to you by | CAPES Authenticated Download Date | 1/19/16 5:50 PM
diameter), on which the particles are deposited, were weighed before and after each test to determine the particle size distribution and total mass using a calibrated microbalance with 0.01 mg resolution. The impactor consists of 10 stages with d50 cut-points of each stage at 0.056, 0.1, 0.18, 0.32, 0.56, 1.0, 1.8, 3.2, 5.6 and 10 µm. A lognormal fit was applied to the data using IGOR Pro 6 (WaveMetrics Inc., Portland, OR, USA) to determine the mass median aerodynamic diameter (MMAD) and the geometric standard deviation of the collected particles. A count median diameter (CMD) was then computed by incorporating the density of the particles, which was assumed to be the density of the liquid used in the ecigarette and using the appropriate Hatch-Choate equation. Filtration model The filtration model employed to generate the filter efficiency of a Borgwaldt 44 mm Cambridge filter required the following filter property input: filter diameter and thickness, effective filter fiber diameter and length, and fiber volume fraction. Filter thickness, diameter, and fiber volume fraction were available or could be determined from the manufacturer specification sheet. Fiber diameter was optically measured in-house. The effective fiber length utilized by the model was estimated by assigning a value that yielded a predicted filtration efficiency of 99.97% for 0.3 µm particles at a volumetric flow rate of 27.5 cm3/s (face velocity 1.8 cm/s). Single-fiber efficiencies were calculated for removal via diffusion, interception, impaction, and diffusion-interception. Overall filter efficiency was determined by summing the contribution of the various individual filtration mechanisms (9). Filtration efficiencies for a range of particle sizes between 7–800 nm were evaluated at flow rates ranging from 10–50 cm3/s.
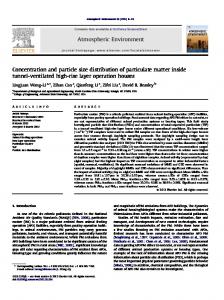
used under the 75 mL puff volume/80 puffs per sample evaluation. The XAD-4 trap contained 120 mg adsorbent resin (porous highly cross-linked polystyrene/divinylbenzene copolymer). All experimental variations were collected in triplicate and experiments were carried out under 60% RH and 24 °C conditions. Cambridge filter samples were extracted with 5 mL methanol. For the analysis of the trap content, the charcoal from the ORBO™-32 Small trap was transferred into a screw cap 1.5 mL GC vial, and extracted with 0.5 mL acetone. The content of the XAD-4 trap was transferred into a 4 mL screw cap vial and extracted with 1 mL of ethyl acetate. The extraction was done using a wrist-action mechanical shaker for 30 min. The analysis of GLY, PG, and NIC was performed using a Gas Chromatographic (GC) separation with flame-ionization detection of the extracts. Calibration curves developed for quantitation were linear in nature over the quantitation range with R2 values > 0.999. Limit of Quantitation (LOQ) values for GLY, PG, and NIC were 0.07, 0.08, and 0.10 µg/mL, respectively. The same extraction solutions described above were used for quantitation of water, which was made using GC separation with thermal conductivity detection. The LOQ was 10 µg/mL and the calibration curve R2 value was also > 0.999. Trace levels of water found in each solvent were accounted for in the analysis. Cambridge filters and adsorbent traps were also analyzed for water after being exposed to 40 and 80 blank puffs and the test sample values were corrected accordingly. RESULTS AND DISCUSSION Figure 1 presents representative impactor-collected data, namely a mass frequency distribution curve and corresponding lognormal fit to the data, and corresponding
Retention of glycerin, propylene glycol, nicotine, and water on Cambridge filter pads Two commercially available e-cigarettes were evaluated and will be designated E-cig A and E-cig B. E-cig A and Ecig B used for this portion of the study are consistent with the E-cig A and B used for the impactor PSD study. A Cerulean SM 450 smoking machine was used to generate puffs under two varying volume regimens: 55 mL or 75 mL puff volume, each of 3 s duration and 30 s inter-puff interval. These two puff volumes were chosen in order to evaluate Cambridge pad filtration efficiencies at variable filtration flow rates. The puff shape profile was a square wave, thus the e-cigarettes were evaluated under constant flow rates of 18.3 cm3/s and 25 cm3/s for the respective 55 mL and 75 mL puffs. Samples composed of both 40 puffs and 80 puffs were collected on a single Cambridge pad. A trap intended to capture any material passing through the filter was placed immediately downstream of the filter. Two types of adsorbent traps were utilized. One type was an ORBO™-32 Small trap containing charcoal in two sections indicated as A and B. Section A of the tube contained 100 mg adsorbent charcoal. Section B of the tube contained an additional 50 mg adsorbent charcoal and it was used as backup in case of breakthrough of the analytes. An XAD-4 trap was also employed; however, it was only
Figure 1. Mass frequency and cumulative mass distributions derived from impactor particle size distribution measurement of E-cig A. The data shown here is representative of each ecigarette brand evaluated.
186 Brought to you by | CAPES Authenticated Download Date | 1/19/16 5:50 PM
Table 1. Particle size distribution parameters determined from cascade impactor analysis. MMAD (nm)
CMD (nm)
GSD
Puff mass (mg/puff)
A
631
319
1.50
2.16
B C
487 534
262 261
1.52 1.52
3.07 1.95
E-cig
MMAD: mass mean aerodynamic diameter CMD: count mean diameter GSD: geometric standard deviation
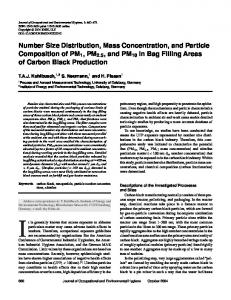
cumulative mass distribution. The data provided in Figure 1 is for E-cig A and is generally representative of each ecigarette brand sampled. Table 1 provides a particle size summary for all products evaluated in this study. As described in the Experimental, the PSD parameters provided in Table 1 were derived by fitting the mass frequency data to a lognormal function. Additionally, the puff mass provided in Table 1 was the cumulative mass of particulate matter collected on the various impactor stages. Both curves from Figure 1 indicate that essentially all (95%) aerosol mass is confined to the particle size range of 280–1420 nm. Two of the e-cigarettes evaluated for this study were previously measured via spectral extinction by INGEBRETHSEN et al. (14). Comparing their data generated using a 55 mL puff of 3 s duration with our current results in Table 1, collected with a 50 mL puff of 3 s duration reveals generally good agreement. Our CMD measurement of 262 nm for our E-cig B can be compared with 339 nm reported for INGEBRETHSEN et al. Brand A, as they were the same brand. One possible explanation for the observed difference in particle size between the current study and INGEBRETHSEN et al. is related to differences in gravimetric puff-mass-yield. Table 1 of the current study indicates a yield of 3.07 mg/puff, while INGEBRETHSEN et al. reported a gravimetric per-puff-mass-yield of 4.1 mg/puff. It may be hypothesized that a larger puff-mass-yield would correspond to a larger average particle size as more condensable material is apparently available for particle growth, although additional study in this area is needed. Closer agreement was found between our current E-cig C, which was the same brand as INGEBRETHSEN et al. Brand B, with CMD values of 261 and 265 nm observed, respectively (14). INGEBRETHSEN et al. did not provide data for our current E-cig A. Figure 2 demonstrates the predicted single fiber collection efficiency as a function of particle size for the four indicated capture mechanisms, along with overall filtration efficiency, under a filtration volumetric flow rate of 27.5 cm3/s (face velocity of 1.81 cm/s). Note that this flow rate corresponds to the average flow rate under a 55 mL volume, 2 s puff duration. Also, recall that the model input parameters were derived from the macroscopic filter properties of a 44 mm Cambridge filter. The trends illustrated are similar to other model predictions for fibrous high-efficiency filters. Notable from Figure 2 is that overall particle removal is essentially complete in our size range of interest. The INGEBRETHSEN et al. (14) reported e-cigarette particle size range of 210–390 nm count median diameter, combined with a geometric standard deviation of 1.4,
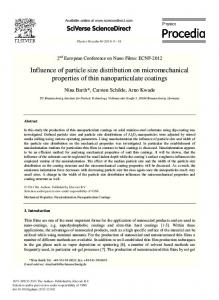
indicates a number distribution dominated by particles spanning the 75–800 nm size range. Also indicated is that filtration by diffusion and interception are the dominant removal mechanisms, with impaction being the least important removal mechanism. Figure 3 plots overall filtration efficiency at filtration flow rates ranging from 10–50 cm3/s (face velocities from 0.66–3.3 cm/s). Figure 3 demonstrates that capture efficiency decreases with increasing filtration flow rate. This is expected behavior for diffusion dominated filtration. Figure 3 also shows that particle size of minimum filtration efficiency, termed the most penetrating particle size, shifts to smaller sizes as the filtration velocity is increased, from approximately 550 nm at 10 cm3/s to 365 nm at 50 cm3/s. However, filtration efficiency of > 99% is predicted for even the most penetrating particle size at 50 cm3/s filtration flow rate. Thus, these model predictions indicate nearly complete filtration of particulate matter of the size reported for e-cigarette aerosols via a Cambridge pad method at flow rates corresponding to typical machine puffing conditions. However, the filtration efficiency predictions provided above do not take into account the influence of particlevapor partitioning, i.e., some vapor phase components of interest may be present and not be efficiently captured by mechanical filtration. Table 2 provides a summary of the fractions of GLY, PG, NIC and water quantified on the primary Cambridge filter and fractions quantified on the primary downstream adsorbent vapor traps. It is important to note that the values provided assume that each component was 1) completely captured on either the filter pad or downstream vapor trap, and 2) all material was effectively extracted from each sample matrix and accounted for by GC analysis. Analysis of the secondary vapor trap (Section B) revealed no presence of GLY or NIC, and only relative traces of PG and water. Analysis of replicate cartridge e-liquid solutions prior to testing showed that for E-cig A, PG, GLY, NIC and water made up 12.1, 69.5, 4.49, and 13.9% of the sum total of the components analyzed for here. Corresponding values
Figure 2. The predicted single-particle filtration efficiency for various removal mechanisms and overall removal incorporating the range of particle sizes that might be expected in e-cigarette effluent. Filter properties are consistent with a 44 mm Cambridge pad and the filtration flow rate was set at 27.5 cm3/s.
187 Brought to you by | CAPES Authenticated Download Date | 1/19/16 5:50 PM
Figure 3. Predicted overall particle filtration efficiency at a range of filtration flow rates.
for E-cig B were 49.9, 47.7, 1.58, and 1.76% PG, GLY, NIC and water, respectively. From Table 2 GLY is generally completely captured on the Cambridge filter for each e-cigarette type, and all flow rate, puff number and downstream trap-type combinations. Approximately 99.9% of total NIC quantified was extracted from the Cambridge filter when the ORBO™-32 Small trap was used as the downstream adsorbent. A similar value of 99.4% was found when the XAD-4 resin was used as trap material. Corresponding data for PG indicate 98.4–99.5% retention by the Cambridge filter. The general trends presented for GLY, PG, and NIC partitioning between the
Cambridge filter and adsorbent trap are clearly aligned with each component’s partial vapor pressure. That is, the higher vapor pressure of PG relative to GLY would result in an increased PG vapor fraction within the aerosol, which can pass through the filter pad and be captured on the vapor trap. Given that the vapor pressure of water is considerably higher than that of PG, it may be expected that a relatively higher fraction of water will be found in the vapor phase. However, it is seen from Table 2 that the filter/vapor trap fractionation data for water is largely inconclusive. Water is observed to be captured on the primary Cambridge filter pad at wide range of efficiencies, from ~ 20% to 100%, with no clear trends emerging for product, puff number analyzed or puff flow rate. These results are in stark contrast to the results for PG, GLY, and NIC partitioning, which were generally consistent for both e-cigarette types and other experimental variables. Analysis of blank, never used ORBO™-32 Small traps revealed a negligible amount of water present on the material as received. However, after being exposed to 20 or 80 “blank” puffs under each experimental condition, we observed highly variable amounts of water present that sometimes exceeded the water quantified during actual e-cigarette aerosol collection. This may indicate that alternate vapor adsorption materials will be more appropriate for water analyses. A convenient characteristic of e-cigarettes is that the mass of total aerosol former (e-liquid) consumed during puffing can be quantified gravimetrically. These quantities may then be compared with the corresponding TPM mass determined by filter collection. Additionally, given that the four components analyzed in this study are expected to make up the majority of the particulate matter fraction of
Table 2. Fractions of glycerin (GLY), propylene glycol (PG), nicotine (NIC) and water (WAT) quantified on the primary Cambridge filter and fractions quantified on the downstream adsorbent vapor traps. Flow rate 3 (cm /s)
E-cig A (%) on pad
E-cig A (%) on trap
E-cig B (%) on pad
E-cig B (%) on trap
Puffs
Analyte
25
80
GLY NIC PG WAT
99.999 99.869 98.366 88.206
0.001 0.131 1.634 11.794
100.000 99.892 98.851 100.000
0.000 0.108 1.149 0.000
25
20
GLY NIC PG WAT
100.000 99.942 98.941 51.146
0.000 0.058 1.059 48.854
100.000 99.969 99.343 100.000
0.000 0.031 0.657 0.000
18.3
80
GLY NIC PG WAT
100.000 99.915 98.869 89.316
0.000 0.085 1.131 10.684
100.000 99.923 99.240 69.155
0.000 0.077 0.760 30.845
18.3
20
GLY NIC PG WAT
100.000 99.962 99.377 46.818
0.000 0.038 0.623 53.182
100.000 100.000 99.503 20.608
0.000 0.000 0.497 79.392
25
80
GLY NIC PG WAT
99.999 99.409 98.748 98.947
0.001 * 0.591 * 1.252 * 1.053 *
* Indicates XAD-4 trap, all other trap values correspond to ORBO™-32 Small trap
188 Brought to you by | CAPES Authenticated Download Date | 1/19/16 5:50 PM
99.999 99.426 98.771 97.800
0.001 * 0.574 * 1.229 * 2.200 *
Table 3. Percent of material leaving the cartridge accounted for as gravimetric TPM and percent of gravimetric TPM mass accounted for by the four-component GC analysis. Flow rate 3 (cm /s) 25 25 25 25 18.3 18.3 18.3 18.3 25 25
Puffs
E-cig
80 80 20 20 80 80 20 20 80 80
A B A B A B A B A* B*
(%) cartridge mass (%) TPM mass loss captured as accounted for by TPM GC analysis 97 ± 0.29 105 ± 0.94 95 ± 5.10 103 ± 1.50 98 ± 5.30 107 ± 0.32 99 ± 15.10 105 ± 4.00 96 ± 1.60 103 ± 1.80
96 92 89 91 95 98 84 94 97 92
* Indicates XAD-4 trap, all other trap values correspond to ORBO™-32 Small trap
measurements made by a spectral transmission procedure and the cascade impactor measurements presented here (both under non-diluting conditions) suggest that the average particle size and number concentration of ecigarette aerosols are comparable to those of tobacco burning cigarette aerosols. Results of a model-based Cambridge pad filtration efficiency study predict near 100% capture of particles of a size consistent with those found in e-cigarette aerosols. Results of an experimental study support this prediction for PG, GLY, and NIC, indicating that the mass of these components largely resides in the condensed particulate phase. Information on the particle-vapor partitioning of water was generally inconclusive and may indicate that the vapor traps employed for this study are not suitable for water analyses. REFERENCES 1.
the aerosol, the mass sum of the analysis can be compared with filter-collected TPM values. Table 3 provides the results of both types of comparisons using data collected during the course of this work. There is a clear distinction between the two e-cigarettes evaluated with regard to the percent of material leaving the cartridge that was accounted for as filter-collected TPM. For E-cig A, a range of 96–99% of consumed aerosol former was accounted for as TPM. Corresponding values for E-cig B indicate that 3–7% more mass was determined as TPM relative to what was accounted for by cartridge mass loss measurements. We have routinely observed this behavior in previous analyses, and have determined that adsorption of ambient water by hygroscopic GLY and PG aerosol components, that were deposited on the filter pad during previous puffs, at least in part, contributes to this behavior. Furthermore, the original water content of the bulk, in-cartridge aerosol former solution will impact the magnitude of ambient water uptake, along with the relative humidity of the test environment. Recall from above that the e-liquid water fractions of E-cig A and E-cig B were 13.9% and 1.76%, respectively. Table 3 also demonstrates that 84–97% of the TPM is accounted for by total mass quantities of PG, GLY, NIC and water quantified from pad and vapor trap analyses. These values are reasonable, but are generally lower than the expected total fraction each of the four components analyzed for would contribute to total TPM. This discrepancy may be related to uncertainties in the analysis quantitation, or it may indicate incomplete trapping or extraction of material from the collection matrices. Additional work in this area is warranted.
2.
3. 4. 5. 6.
7.
8.
9.
CONCLUSIONS 10. It has previously been demonstrated that the characteristics of e-cigarette aerosols, i.e., high particle number density and particulate matter that can evaporate under high dilution conditions, will generally complicate PSD measurements of e-cigarette aerosols. However,
11.
Baker, R.R. and M. Dixon: The Retention of Tobacco Smoke Constituents in the Human Respiratory Tract; Inhal. Toxicol. 18 (2006) 255–294. Chang, P., L.K. Peters, and Y. Ueno: Particle Size Distribution of Mainstream Cigarette Smoke Undergoing Dilution; Aerosol Sci. Technol. 4 (1985) 191–207. Davies, C.N.: Cigarette Smoke: Generation and Properties of the Aerosol; J. Aerosol. Sci. 19 (1988) 463–469. Harris, E. and H.F. Kay: Size Distribution of Tobacco Smoke Particles; Nature 183 (1959) 741–742. Martonen, T.B.: Deposition Patterns of Cigarette Smoke in Human Airways; Am. Ind. Hyg. Assoc. J. 53 (1992) 6–18. Phalen, R.F., W.C. Cannon, and D. Esparaza: Comparison of Impaction, Centrifugal Separation and Electron Microscopy for Sizing Cigarette Smoke; in: Fine Particles, edited by B.Y.H. Liu, Academic Press, New York, USA, 1976, pp. 732–736. Ingebrethsen, B.J.: The Physical Properties of Mainstream Cigarette Smoke and their Relationship to Deposition in the Respiratory Tract; in: Extrapolation of Dosimetric Relationships for Inhaled Particles and Gases, edited by J.D. Crapo, Academic Press, New York, USA, 1989, pp. 125–140. Ingebrethsen, B.J. and S.L. Alderman: Coagulation of Mainstream Cigarette Smoke in the Mouth During Puffing and Inhalation; Aerosol Sci. Technol. 44 (2011) 1422–1428. Hinds, W.C.: Chapter 9: Filtration; in: Aerosol Technology: Properties, Behavior, and Measurement of Airborne Particles, 2nd Edition, John Wiley and Sons, New Jersey, USA, 1999, pp. 182–205. Lee, K.W. and B.Y.H. Liu: Experimental Study of Aerosol Filtration by Fibrous Filters; Aerosol Sci. Technol. 1 (1982) 35–46. Chen, B.T., J. Namenyi, H.C. Yeh, J.L. Mauderly, and R.G. Cuddihy: Physical Characterization of Cigarette Smoke Aerosol Generated from a Walton 189
Brought to you by | CAPES Authenticated Download Date | 1/19/16 5:50 PM
12.
13.
14.
15.
Smoke Machine; Aerosol Sci. Technol. 12 (1990) 364–375. Alderman, S.L. and B.J. Ingebrethsen: Characterization of Mainstream Cigarette Smoke Particle Size Distributions from Commercial Cigarettes using a DMS500 Fast Particulate Spectrometer and Smoking Cycle Simulator; Aerosol Sci. Technol. 44 (2011) 1409–1421. Hinds, W.C.: Chapter 1: Introduction; in: Aerosol Technology: Properties, Behavior, and Measurement of Airborne Particles, 2nd Edition, John Wiley and Sons, New Jersey, USA, 1999, pp. 1–14. Ingebrethsen, B.J., S.K. Cole, and S.L. Alderman: Electronic Cigarette Aerosol Particle Size Distribution Measurements; Inhal. Toxicol. 24 (2012) 976–984. Bernstein, D.M.: A Review of the Influence of Particle Size, Puff Volume, and Inhalation Pattern on the Deposition of Cigarette Smoke Particles in the Respiratory Tract; Inhal. Toxicol. 16 (2004) 675–689.
16.
17.
Kane, D.B., B. Asgharian, O.T. Price, A. Rostami, and M.J. Oldham: Effect of Smoking Parameters on the Particle Size Distribution and Predicted Airway Deposition of Mainstream Cigarette Smoke; Inhal. Toxicol. 22 (2010) 199–209. Adam, T., J. McAughey, C. McGrath, C. Mocker, and R. Zimmermann: Simultaneous On-line Size and Chemical Analysis of Gas Phase and Particulate Phase of Cigarette Mainstream Smoke; Anal. Bioanal. Chem. 394 (2009) 1193–1203.
Corresponding author: Steven L. Alderman R.J. Reynolds Tobacco Co. 950 Reynolds Blvd. Winston-Salem, NC 27105, USA E-mail:
[email protected]
190 Brought to you by | CAPES Authenticated Download Date | 1/19/16 5:50 PM