TECHNICAL PAPER
ISSN 1047-3289 J. Air & Waste Manage. Assoc. 55:772–783 Copyright 2005 Air & Waste Management Association
Particulate Emissions from Construction Activities Gregory E. Muleski and Chatten Cowherd, Jr. Midwest Research Institute, Kansas City, MO John S. Kinsey U.S. Environmental Protection Agency, Office of Research and Development, National Risk Management Research Laboratory, Research Triangle Park, NC
ABSTRACT Although it has long been recognized that road and building construction activity constitutes an important source of particulate matter (PM) emissions throughout the United States, until recently only limited research has been directed to its characterization. This paper presents the results of PM10 and PM2.5 (particles ⱕ10 m and ⱕ2.5 m in aerodynamic diameter, respectively) emission factor development from the onsite testing of component operations at actual construction sites during the period 1998 –2001. Much of the testing effort was directed at earthmoving operations with scrapers, because earthmoving is the most important contributor of PM emissions across the construction industry. Other sources tested were truck loading and dumping of crushed rock and mud and dirt carryout from construction site access points onto adjacent public paved roads. Also tested were the effects of watering for control of scraper travel routes and the use of paved and graveled aprons at construction site access points for reducing mud and dirt carryout. The PM10 emissions from earthmoving were found to be up to an order of magnitude greater than predicted by AP-42 emission factors drawn from other industries. As expected, the observed PM2.5:PM10 emission factor ratios reflected the relative importance of the vehicle exhaust and the resuspended dust components of each type of construction activity. An unexpected finding was that PM2.5 emissions from mud and dirt carryout were much less
IMPLICATIONS For many years there has been a scarcity of field data on PM10 and PM2.5 emissions from road and building construction activities, in spite of the recognized importance of this source category. The series of tests presented in this paper have provided the first directly measured PM10 and PM2.5 emission factors for important individual construction operations at actual construction sites.
772 Journal of the Air & Waste Management Association
than anticipated. Finally, the control efficiency of watering of scraper travel routes was found to closely follow a bilinear moisture model. INTRODUCTION Although it has long been recognized that road and building construction activity forms an important source of particulate matter (PM) emissions throughout the United States, until recently only limited research has been directed to its characterization. In the U.S. Environmental Protection Agency’s (EPA) emission factor handbook (AP42),1 Section 13.2.4, “Heavy Construction Activities,” remained unchanged for ⬃20 years from its original publication in 1975, because no new data had become available during that time. Furthermore, the field study supporting the original 1975 section used a test method that could characterize only area-wide effects on air quality.2 The 1975 emission factor for construction activities had the form: e ⫽ 2.7 megagram (Mg)/hectare-month of activity (1) e ⫽ 1.2 t/acre-month of activity where e represents total suspended particulate (TSP) matter emissions, generally regarded as the appropriate equivalent of PM30 (particles no larger than ⬃30 m in aerodynamic diameter).1 The 1975 TSP emission factor could neither distinguish overall variations in emissions between different phases (e.g., land clearing, earthmoving, and general construction) nor rank in importance different emission categories (e.g., material handling and general vehicle travel). Instead, all of the emissions from a particular construction site were “smeared” uniformly in both a spatial and temporal sense. In other words, this assumed that all of the areas within the construction site emit at the same level and that emissions are constant from the beginning to end of a construction project. Volume 55 June 2005
Muleski, Cowherd, and Kinsey To at least partially address shortcomings in the AP-42 estimation method for specific sites, the 1993 update supplemented the single-valued factor given above with a “unit operation” approach.3 Under this approach, construction activities could be broken down into generic operations (such as truck travel over unpaved surfaces, site preparation by graders or scrapers, or truck loading and dumping), and emissions from the generic operations could be estimated on the basis of factors in other sections of AP-42. The unit operation approach itself had drawbacks, because most of the factors had to be adapted from other industries—most notably, surface coal mining. Because of differences in how equipment is operated between different industries, there were concerns about how well emission factors based on tests in one industry can predict emission levels from another industry. In addition, the measurement techniques used to characterize many of the unit operations in other industries were generally not capable of successfully isolating an individual emission source. Subsequent application of the AP-42 estimation methods at several western U.S. construction sites4 suggested that earthmoving activities could easily account for 70 to 90% of the PM10 (particles ⱕ10 m in aerodynamic diameter or 10 mA) emissions estimated for any single construction site. In many cases, bringing
the site to final grade necessitates either bringing material into the site for fill or shipping excess cut material off-site. Besides the cut or fill operations, a variety of other operations at construction sites require the loading, transport, and unloading of aggregate material. Another important source of PM emissions is mud and dirt carryout on the tires of vehicles that exit from construction sites to adjacent paved roads where area traffic pulverizes and resuspends much of the tracked material. These studies reaffirmed the need to develop more specific emission factors for earthmoving and other construction operations to provide more reliable estimates. This paper summarizes the results of a multi-year research program undertaken by EPA’s National Risk Management Research Laboratory (NRMRL) to assess PM emissions from construction activities. The program first addressed the amount of dust generated and then the effectiveness of control measures applied to the emission sources at construction sites. These studies are summarized in Table 1. Except for the final series of measurements, the testing was performed by Midwest Research Institute (MRI). The final study to measure PM emissions from mud and dirt carryout was a joint undertaking by NRMRL and MRI, as described by Kinsey et al.5 Details of each study can also be found in the individual test reports.6 – 8
Table 1. Test matrix for construction PM emissions.
Date
Facility
Location
Equipment
Aug-Sept 1998
SFL
Menlo, KS
Pan scraper
Aug-Sept 1998
NCKTC
Beloit, KS
Elevating and pan scrapers; bulldozer; grader
Mar 1999
DFS
Grandview, MO
Sept 1999
NCKTC
Beloit, KS
Nov 1999
DFS
Grandview, MO
Single-axle dump truck; tractor with bucket Elevating and pan scrapers Pickup truck, dump truck
Oct 2000
Public paved roadsa
Overland Park, KS
a
Urban traffic including non-construction vehicles
Source Earthmoving: Scraper unloading Scraper loading Scraper transit Earthmoving: Scraper unloading Scraper loading Scraper loading/ assisted Scraper transit Grading Truck loading, dumping Earthmoving: Scraper transit Mud and dirt carryout Mud and dirt carryout
Surface Material
Control
Number of Tests
Native soil
Uncontrolled
9 9 2
Native soil
Uncontrolled
6 2 4 10 2
Crushed rock
Uncontrolled
5
Native soil
Uncontrolled Watering Asphalt apron, Gravel apron Uncontrolled PM10, PM2.5
Native soil, soil/sand mixture Construction dirt
4 15 11, 13 12, 6
Adjacent to main construction entrance to the 200-acre Sprint World Headquarters.
Volume 55 June 2005
Journal of the Air & Waste Management Association 773
Muleski, Cowherd, and Kinsey was collocated with one cyclone sampler for compariTEST METHODS The time-integrating exposure profiling test method was son purposes. used for measurement of mass emissions and particle size To determine vertical profiles of particle size distribudistributions generated by the source in comparison to tion, a second sampling system supplemented the mass background.2 This method has been recognized by EPA as exposure profiling system described above. The second the characterization technique most appropriate for the system also used a high-volume cyclone preseparator but broad class of open anthropogenic dust sources, such as in a different sampling configuration. Here, the cyclone material transfer and moving point sources.1 Because the was operated at a flow rate of 34 m3/hr (20 acfm) ahead of method isolates a single emission source while not artifia three-stage cascade impactor. At that flow rate, the cycially shielding the source from ambient conditions (e.g., clone and three stages exhibit D50 cut points of 15, 10.2, wind), the open source emission factors with the highest 4.2, and 2.1 mA. PM2.1 was used as a surrogate for PM2.5 quality ratings in EPA’s emission factor handbook AP-42 (particles ⱕ2.5 mA). are typically based on this approach. The exposure profilWind speed was monitored at two heights using R. M. ing method relies on simultaneous multipoint measureYoung Gill-type (model 27106) anemometers. Furtherment of both concentration and airflow (advection) over more, an R.M. Young portable wind station (model the effective area of the emission plume. This technique 05305) recorded wind speed and direction at the 3-m uses a mass flux measurement scheme similar to EPA height downwind. All of the wind data were accumulated Method 5 stack testing rather than requiring indirect into 5-min averages logged with a 26700 series R. M. emission rate calibration through the application of genYoung “programmable translator.” eralized atmospheric dispersion model.1 In addition to the aerometric measurements involvAll three of the scraper operations involved in earthing PM concentration and wind, at least one sample of moving (loading, unloading, and transit), as well as motor the emitting aggregate material (soil or crushed rock) was grading represent “moving point” sources that can be collected for each emission test. These samples were anatreated as a “line” sources following the path of vehicle lyzed for moisture content and silt content in a manner movement. As long as the distance traveled during the consistent with that required in AP-42 Appendixes C.1 cut/fill operation is substantially greater than the downand C.2.1 In this context, “silt” refers to particles that pass wind distance from the path to the sampling array, then a 200-mesh screen (74 m in physical diameter) upon dry only a single vertical array of samplers (“tower”) is necessieving. sary to characterize the vertical distribution of concentraTESTS OF UNCONTROLLED EARTHMOVING tion and wind speed in the plume, (see Figure 1).2 In Test Site Conditions contrast to the earthmoving tests, stationary truck loadIn August and September of 1998, a field-testing program ing and dumping are treated as “fixed-point” sources. In of earthmoving emissions was conducted at sites in Menlo this case, because the source plume cannot be assumed to and Beloit, KS.6 To address the logistical difficulties in be uniform along the horizontal crosswind direction, a anticipating earthmoving tests at active construction sites, two-dimensional sampling array is required. The primary air-sampling device in the exposure-profiling portion of the field program was a standard high-volume air sampler fitted with a cyclone preseparator. The cyclone exhibits an effective 50% cutoff diameter (D50) of ⬃10 mA when operated at a flow rate of 68 m3/hr (40 cfm).9 Thus, mass collected on the 20- ⫻ 25-cm (8- ⫻ 10-in.) backup filter represents a PM10 sample. During each mass flux profiling test, a Wedding & Associates highvol PM10 reference sampler Figure 1. Plume profiling tower. 774 Journal of the Air & Waste Management Association
Volume 55 June 2005
Muleski, Cowherd, and Kinsey Table 2, there was considerable variation in the loading/unAverage PM10 Emission loading PM10 emissions at the Factor kg/1000 m3 SFL site. For example, as the cut (lb/1000 yd3) deepened, emissions tended to become greater. The “yellow PM2.5/PM10 Scraper Site Soil Condition Loading Unloading dirt,” a highly unconsolidated Elevating SFL Uncompacted (14–40% silt) 0.46–0.57 soil with unusually high silt 䡠Yellow dirt 250 (430) 54 (91) content, resulted in very high 䡠Other 58 (98) 7.7 (13) emission levels during both Elevating NCKTC “Cut” material (5.3–8.3% silt) 2.8 (4.7) 1.3 (2.2) Highly variableb loading and unloading. On the Pana NCKTC “Cut” material (3.6–5.5% silt) 1.0 (1.7) 0.77 (1.3) Highly variableb other hand, when stockpiled material was reclaimed, emisa Dozer assisted during loading; bRatios at NCKTC varied from ⵑ0.2 to 0.9, depending on the height of the sions decreased with depth, bemeasurement, the type of scraper, and whether dozers assisted the scraper. cause the yellow dirt formed the program relied on “captive” operations in the sense that the top of the stockpile. Furthermore, the uppermost poroperations were largely controlled in orientation and setion of the stockpile not only had the best drainage but quencing during testing. The captive operations used scrapwas also the least compacted layer. ers of the same type that are typically used at construction Because soil at the NCKTC facility had been repeatsites. The most important implications of the captive nature edly moved as part of training exercises over the prior 15 of the tests are that sources are favorably oriented with years, it had many clods, and the mean grain size was respect to prevailing wind direction and that the total operlarger than the previously undisturbed land at SFL. Conational cycle (loading, unloading, and transportation) repsequently, the PM10 emissions from loading and unloadresents a fairly short period of time to facilitate testing. ing at NCKTC were much lower than at the Schwarz site. Emissions were characterized from scraper loading (cut), Silt contents for the NCKTC earthmoving tests ranged unloading (fill), and transport operations at North Central from 3.6 to 8.3%, whereas the corresponding range for Kansas Technical College (NCKTC) in Beloit, KS, and at the Schwarz tests was 14 – 40%. Schwarz Feed Lots (SFL) in Menlo, KS. At both Kansas test The results for scrapers and graders in transit at the sites, additional testing of the emissions generated by scrapKansas test sites are shown in Table 3. The transit test ers in transit was also conducted. Finally, tests of motor results were comparable between the two test sites. In grading were conducted at the NCKTC site. general, the emission factor for a loaded scraper in transit At SFL, a John Deere Model 860 elevating-type (“padis approximately twice that for an empty unit. dle”) scraper with a capacity of 11 m3 (15 yd3) loaded and The AP-42 generic equation factor for unpaved roads unloaded earth. Once a cut of approximate dimensions (Sec. 13.2.2) underpredicts the results in Table 3, generally 60 m long, 12 m wide, and 1 m deep (200 ft long, 40 ft by a factor of two to three.6 The underprediction most wide, and 4 ft deep) was completed and a stockpile was likely results from the fact that the travel surfaces tested formed, the stockpiled material was recovered and rehad not been improved in any fashion. Instead, the scrapplaced in the cut. The first sets of tests involved cuts of ers traveled directly over bare soil. The AP-42 emission cleared land, whereas the second set of tests involved cuts factor equation for scrapers in transit at surface coal mines of vegetated land. (Sec. 11.9) underpredicts the scraper transit emission facAt the NCKTC, testing was performed in conjunction tors by an order of magnitude.6 with “hands on” vocational training. As part of their training, students operating up to three scrapers formed a Test Results: Particle Size cut of approximate dimensions 80 m long, 20 m wide, The ratios of PM2.5:PM10 measured at the plume core (2 and 2 m deep (250 ft long, 70 ft wide, and 8 ft deep). After m) sampling height for scraper loading and unloading at the cut material was stockpiled at one location, the stuSFL are given in Table 3. The test runs at the SFL consisted dents replaced the stockpiled material in the cut made of three test series: movement of cleared pastureland into earlier in the day. a stockpile; replacement of the stockpiled material in the cut; and movement of vegetated pastureland into a stockTest Results: PM10 Emissions pile. Despite these variations in material, the ratio of A total of 49 profiling tests were conducted at the two PM2.5:PM10 remained remarkably constant throughout Kansas sites. The distribution of tests over various construction operations is shown in Table 1. As shown in the tests. Table 2. Scraper loading/unloading emission factors.
Volume 55 June 2005
Journal of the Air & Waste Management Association 775
Muleski, Cowherd, and Kinsey Table 3. Scraper transit emission factors.
Scraper Model Schwarz Feed Lots John Deere 860 (elevating) NCKTC Caterpillar 613 (elevating) Caterpillar 613 (elevating) Caterpillar 621 (pan) Grader
Transit PM10 Emission Factor kg/Vehicle-km (lb/vehicle-mi)
Empty/Loaded (weight in t)
Travel Speed kph (mph)
Average
Range
PM2.5:PM10
Loaded (42)
12 (8)
3.1 (11)
2.4–3.7 (8.4–13)
0.26 to 0.29
Empty (16) Loaded (29) Empty (34) NA (12)
24 (15) 19 (12) 24 (15) 6 (4)
2.2 (7.6) 4.2 (15) 1.5 (5.4) 8 (6.5)
1.4–3.1 (4.8–11) 3.9–4.5 (14–16) 1.5–1.6 (5.2–5.6) 1.7–1.9 (6.1–6.9)
0.12 to 0.30 0.12 to 0.30 0.12 to 0.30 0.24
The geometric mean PM2.5:PM10 ratio of 0.48 observed for scraper loading and unloading operations at SFL is much higher than what is typically found for fugitive dust sources, ranging from 0.15 to 0.25.10 This reflects a larger component of vehicle exhaust for scraper loading and unloading, because PM in vehicle exhaust lies almost entirely in the PM2.5 size range. The scraper loading and unloading tests at NCKTC showed more variation in PM2.5:PM10 ratios, with values ranging from ⬃0.2 to 0.9, depending on height of measurement and what types of scrapers were used. The highest ratios occurred when each scraper pass was associated with two dozer passes (one to push the scraper during loading and another to assist the next scraper), because of the large component of vehicle exhaust. At NCKTC, the PM2.5:PM10 ratios for the scraper transit tests ranged from 0.12 to 0.30, with an overall mean of ⬃0.21. Similarly, the two-grader tests exhibited an overall PM2.5:PM10 ratio of ⬃0.24. The two scraper transit tests at SFL exhibited PM2.5:PM10 ratios of 0.26 and 0.29. The PM2.5:PM10 ratios for scraper transit and grader operations were in the same range as found for most dust sources. In summary, the PM2.5:PM10 ratios were found to be significantly higher for the scraper loading and unloading operations than for the transit operation. This is likely the result of two factors: (1) there are increased diesel exhaust emissions during loading/unloading as compared with the free movement of the scraper at a fairly steady speed, and (2) the travel surface tends to be much drier than either the cut or fill area, thus increasing the amount of coarse-mode fugitive dust being emitted in comparison with the diesel exhaust component. To determine more quantitatively the contribution of diesel exhaust to PM10 emissions, quartz fiber filters from PM10 samplers at both Kansas test sites, representing a range of PM2.5:PM10 ratios, were selected for elemental carbon (EC) and organic carbon analysis using national Institute for Occupational Safety and Health 776 Journal of the Air & Waste Management Association
Method 5040.11 EC was attributed mostly to diesel exhaust. As presented by Kinsey et al.,5 these EC/organic carbon analyses confirmed that loading and unloading operations generated far more diesel particulate mass (per unit distance traveled) than did the transit operation between the cut and fill locations. Only limited visible exhaust was apparent during the transit tests, because the scrapers traveled at a fairly steady speed past the sampling location. Finally, as one would expect, dozer-assisted scraper operations resulted in more diesel emissions than nonassisted scraper loading operations.
TESTS OF CONTROLLED EARTHMOVING In the September 1999 field-testing program at NCKTC in Beloit, KS,6 the PM emission control efficiency of water applied to scraper travel surfaces was evaluated. Because of the generally short-term nature of travel routes at construction sites, operators throughout the United States commonly use water to control PM emissions rather than relying on more expensive and efficient chemical dust suppressants. Although PM emissions from watered unpaved roads had attracted attention since at least the early 1980s, only two tests of watering effectiveness had been conducted at construction sites12 before the 1999 field study. In addition to the simple scarcity of data specifically referenced to construction sites, there have been concerns about how well test results from long-term unpaved roadways can be applied to temporary travel routes at construction sites. Because temporary routes are not nearly as well constructed as roadways, available data may not accurately reflect the efficiency afforded by watering at construction sites. A total of 19 mass flux profiling tests of scraper transit watering effectiveness were conducted at NCKTC, distributed over two uncontrolled (201 and 601) and five controlled (301, 401, 601, 701, and 1001) “series.” The tests in Volume 55 June 2005
Muleski, Cowherd, and Kinsey Table 4. Average PM-10 control efficiency decay rates.
Test Series 301 401 501 701 1001
Water Applied L/m2 (gal/yd2)
Ambient Temp (F)
Relative Humidity (%)
Cloud Cover (tenths)
Intercept B (%)
Decay Rate (% - hrⴚ1)
5.0 (1.1) 0.95 (0.21) 1.4 (0.31) 0.63 (0.14) 2.4 (0.54)
55 57 59 62 57
50 58 34 37 71
8 8 4 0 3
99.4 99.5 99.4 99.8 99.9
6.71 7.68 13.7 12.4 2.65
TESTS OF TRUCK LOADING/DUMPING the uncontrolled series were conducted simultaneously, Testing of PM emissions from truck loading/dumping was using collocated profiling towers. On the other hand, the undertaken in March 1999.6 A “captive” truck loading controlled tests were staggered during the time after water application to track the decay in control efficiency as the and unloading operation was staged at MRI’s Deramus surface dried. Testing of watering effectiveness spanned a Field Station (DFS) in Grandview, MO. The operations range of common water application rates, as well as a involved first filling a single-axle dump truck with range of ambient conditions (such as relative humidity crushed rock from a stockpile using a small loader. Once [RH], cloud cover, and solar radiation) that could potenfull, the truck traveled to a nearby location where it untially affect evaporation rates. loaded. Control efficiency was determined as the percentage The emission factors for aggregate materials handling of reduction in the emission factor for each test compared measured at DFS are given in Table 5. These tests prowith the average uncontrolled PM10 emission factor of duced upper bounds (i.e., worst-case conditions) on the PM-10 emissions from truck loading and unloading oper0.412 kg/vehicle-km (1.46 lb/vehicle-mi). Average control ations at construction sites, for two reasons. First, both efficiency decay rates were determined by least-squares the loader (with 0.5 m3 [0.6 yd3] bucket) and the singleregression and are given in Table 4. The decay rate was found to be strongly negatively correlated with RH (effiaxle truck were smaller in capacity than industry norms. ciency decayed more slowly at higher humidity). Although the current version of the AP-42 equation for The study also compared control efficiency values aggregate material handling does not contain bucket size against a bilinear relationship contained in prior EPA as a correction parameter because of a cross-correlation guidance.13 Figure 2 plots the instantaneous control efficiency against the surface moisture content associated with each test. The steep slope at fairly low moisture values and the more shallow slope at high moisture levels are in keeping with our past studies, which found that control efficiency data can be successfully fitted by a bilinear function, based on a “normalized” surface moisture value.13 The normalization is performed by dividing by the uncontrolled (unwatered) surface moisture content for the unpaved travel route. In this case, the moisture data are normalized by 4%, which is the mean uncontrolled moisture value for the 1999 tests at Figure 2. Comparison of test data with bilinear model. NCKTC. Volume 55 June 2005
Journal of the Air & Waste Management Association 777
Muleski, Cowherd, and Kinsey with silt content, another available relationship can be used to estimate the effect of using a 0.5 m3 (0.6 yd3) bucket instead of a 2–5 m3 (3– 6 yd3) bucket more commonly found in the construction industry.16 Second, because the testing was to be performed under generally wet springtime conditions, the aggregate material for testing (a fine limestone product known locally as “buckshot”) was selected because of its reputation as a dusty stone product. Although it is dusty, buckshot is commonly used as aggregate added to asphalt, and so it represents a realistic worst case for testing emissions from aggregate material handling operations at construction sites. As shown in Table 5, truck loading emissions were more than an order of magnitude greater than truck unloading emissions. The loading operation occurs well above surrounding grade and is fully exposed to ambient winds. The end-dump unloading operation, on the other hand, occurs near the ground, and the truck bed at least partially shields the material from the wind. Finally, for the tested operations, the “dumping device capacity” for the loader was one-tenth the value for the dump truck. Additional particle size data were obtained from the truck loading and unloading tests at DFS. The PM2.5:PM10 ratios were found to be ⬃0.24 and 0.40 for the loading and unloading operations, respectively. Note that the loader orientation during the testing was such that its exhaust emissions were not mixed with the sampled dust plume. TESTS OF MUD AND DIRT CARRYOUT CONTROLS In November 1999, an additional testing program was conducted at the DFS.7 These tests explored an unwelcome consequence of watering unpaved travel surfaces at construction sites, namely, the increase in mud and dirt carryout onto surrounding paved streets. For construction projects that require imported fill or that need to truck out excess cut material, watered travel routes increase the amount of mud and dirt carried from the site and deposited on the public paved roads adjacent to the construction site. Thereafter, all vehicles (and not just those associated with the construction project) can emit PM from
the deposited material as it is abraded and entrained from the paved roads. Of particular interest in this testing was identifying the moisture level at which watering becomes “counterproductive” or the point at which any net decrease in onsite travel emissions from watering is more than offset by an increase in offsite emissions from trackout. Because of an anticipated larger test program involving directly measured PM emission from mud and dirt carryout, the mud and dirt carryout study at DFS relied on indirect measures of control efficiency: (a) surface soil samples from the unpaved access area leading to the paved surface, and (b) mud and dirt samples from the paved surface itself. In particular, the study paired moisture grab samples taken from the access area with samples of the total loading of loose material deposited on the paved road. Total mud and dirt loading rather than silt loading on the trackout road was measured because of the low opportunity for grinding the mud and dirt deposit into finer material. Sample collection and analysis for both the paved and unpaved surfaces followed the guidelines recommended in Appendixes C.1 and C.2, respectively, to EPA’s AP-42.1 Figure 3 plots the calculated total mass of mud and dirt carried from the native soil access area as a function of surface moisture content. The mass of material tracked out increases dramatically for moisture contents above ⬃10%. When Figures 2 and 3 are compared, it is clear that moisture contents ⬎10% provide little additional onsite dust control but result in significantly more offsite trackout. Thus, a 10% moisture content represents a reasonable first estimate of the point at which watering becomes counterproductive. The effectiveness of graveled and paved aprons in controlling mud and dirt trackout was determined in terms of percent reduction in total paved road surface loading in the immediate vicinity of the access point. The travel distance on the apron was 7.6 m (25 ft). Table 6 presents control efficiencies based on percent reduction in mean loading values. Little variation in control efficiency was observed, with values ranging from 42 to 48%. The combination of a gravel apron with the sand/soil mixture exhibited a discernible relationship between
Table 5. Truck loading/unloading test results.
a
Operation
Truck dumping onto ground Bucket loading truck a
PM10 Emission Factor kg/mg (lb/t)
Bucket Capacity m3 (yd3)
Average
Range
PM2.5:PM10
5 (6) 0.5 (0.6)
0.00030 (0.00060) 0.060 (0.12)
0.00015–0.00055 (0.00040–0.0011) 0.060–0.065 (0.12–0.13)
0.40 0.24
Silt content 8.9 –11.4%
778 Journal of the Air & Waste Management Association
Volume 55 June 2005
Muleski, Cowherd, and Kinsey
Figure 3. Total mud and dirt carryout per vehicle.
moisture of the access area surface and the amount of mud and dirt tracked onto the paved road. The gravel apron resulted in no net control when the sandy soil moisture content was higher than ⬃8%. Moreover, for moisture contents higher than ⬃8%, the gravel apron appeared to aggravate the amount of mud and dirt trackout from the sandy soil access area. This additionally supports the notion of 10% moisture representing a reasonable first-cut estimate of the point at which watering becomes counterproductive. TESTS OF MUD AND DIRT CARRYOUT EMISSIONS Test Site Conditions In October 2000, field testing was performed to directly characterize PM emissions from paved roads with increased surface loading because of mud and dirt carryout Table 6. Mud and dirt trackout control efficiency values.
Soil Type Native (clay) soil Sand/soil mixture
a
Control Measure 7.6 m (25 ft) Gravel Asphalt Gravel Asphalt
Control Efficiencya 46% 42% –b 48%
Based on reduction of total loading; bThis combination exhibited a significant relationship between access area moisture content and total mud and dirt trackout. See discussion in text. Volume 55 June 2005
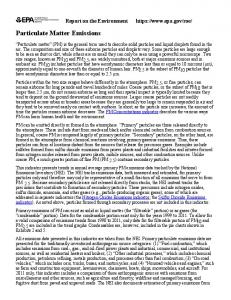
or “trackout” from active construction sites.8 Past EPA guidance presents mud and dirt carryout mean emission estimates for PM10 ranging from 5.4 to 16 g/vehicle.13,14 These estimates were determined by fitting measured surface loading values (i.e., mass of loose material present on the paved road surface) to a functional form, which was then substituted into EPA’s predictive emission factor equation.1 In contrast, the tests described below were designed to collect airborne PM as a basis for directly assessing PM10 and PM2.5 emissions because of carryout from active construction sites. The program had a secondary objective of assisting the EPA in characterizing the relative contribution of vehicle exhaust to the total PM2.5 emissions burden from the test road. To this end, six sets of airborne PM samples on prefired quartz filters were submitted for EC/organic carbon analysis. In addition, an ambient particulate carbon monitor was operated during selected test days. Testing was conducted at the largest construction project ever undertaken in metropolitan Kansas City. Construction of the Sprint World Headquarters Campus in Overland Park, KS, was a 5-yr project encompassing ⬃200 acres and resulted in 4 million square feet of office, retail, and service space. During the testing, traffic on the adjacent public street ranged from ⬃25,000 to 30,000 (2-axle equivalent) vehicles per week. Because the road surface loading (mass of loose material present per unit area of road surface) visibly varied along the length of a roadway affected by trackout, the PM emission rate also varied along the road. Thus, the roadway represented a nonuniformly emitting line source in that the emission strength varies along the road axis. For this reason, the exposure profiling method was adapted by obtaining measurements at distinct points along the length of the road. All of the tests involved eastbound traffic on 115th Street, between Outlook and Nall Avenue, with the following sampling locations (Figure 4) positioned in the road’s median. Location A was 70 m (230 ft) east of the access point (where trackout began on the public road); Location B was 148 m (487 ft) east of the access point; and Location C was 292 m (961 ft) east of the access point. Each sampling location was equipped with a four-sampler PM10 profiling tower. Additional sampling equipment at Location B included: (1) two Journal of the Air & Waste Management Association 779
Muleski, Cowherd, and Kinsey
Figure 4. Sampling locations near Sprint Complex.
Gill-type anemometers (R.M. Young model 27106), (2) an R.M. Young portable wind station (model 05305), and (3) an ambient carbon particulate monitor (Rupprecht & Patashnick series 5400). At Location B, a profiling tower with specially constructed hybrid PM10/PM2.5 samplers were operated during all of the test runs (see Figure 5).8 To avoid interference by large particles, intakes to the PM2.5 devices (lowvolume URG-2000 –30EH cyclones, fitted with 47-mm filter holders) were positioned below the PM10 cyclones and sampled a small portion of the total flow through the high-volume units. To ensure that the measurements reflected PM attributable to the source under construction, a hybrid combination PM10/PM2.5 sampler was also deployed at this location at a height of 3 m at an upwind sampling location. In addition to the time-integrated exposure profiling equipment, aerometric equipment was installed in a sampling trailer and operated by NRMRL during selected tests at Locations B and C. This included the following: (1)
Figure 5. Hybrid PM10/PM2.5 sampler. 780 Journal of the Air & Waste Management Association
two tapered elemental oscillating microbalances with inlets at 3- and 6-m heights, (2) an aerodynamic particle sizer with an inlet height of 3 m, (3) a scanning mobility particle sizer with an inlet height of 3 m, and (4) a wind monitor for speed and direction at the 3-m height. Details of this monitoring can be found in Kinsey et al.5 Surface samples were collected from various points along the length of the road to characterize the amount of loose material present per unit surface area. In addition, “background” samples that were unaffected by trackout from the construction site were also collected. Finally, traffic data were accumulated using pneumatic counters and visual observation during testing. Test Results: PM10 and PM2.5 A total of 12 PM10 and 6 PM2.5 exposure profiling tests were performed in test runs CC-1 through CC-6. Emission factors and surface material characteristics for each location are presented in Table 7. An additional run CC-7 was used to collect field blank filters, and runs CC-8 through CC-10 were conducted to collect additional PM2.5 filters for EC/organic carbon analysis. Those filters, as well as the quartz filters used on tests CC-4 through CC-6, were submitted for EC/organic carbon analysis, as described by Kinsey et al.5 The downwind PM10 concentrations were typically several times greater than the upwind concentration. Furthermore, the PM10 concentrations and exposure profiles showed sharp decreases over the height of the sampling array. In this case, the PM10 attributable to the source was easily separated from the upwind component. On the other hand, downwind PM2.5 concentrations were approximately equal to the upwind values and showed only slight variations in concentration as a function of height. Evaluation of the test data began with a comparison of the PM10 emission factors in Table 7 with the 65 data points underlying the AP-42 paved road emission factor equation.15 The emission factors obtained in this study fell near the median of the prior tests of freely moving vehicles on both public and industrial plant roads. Direct comparison of the results with AP-42 was limited, because the emission level along the street varied as a function of distance (i.e., tended to decrease with increasing distance from the access point) and as a function of time (i.e., tended to increase as material continued to be tracked out). Volume 55 June 2005
Muleski, Cowherd, and Kinsey Table 7. Emission factors and surface material properties.
Runa
Site
Total Loading (g/m3)
CC-1
Eastbound A Eastbound B Eastbound C Westbound C Eastbound A Eastbound B Eastbound C Westbound C Eastbound A Eastbound B Eastbound C Westbound C Eastbound A Eastbound B Eastbound C Westbound C Eastbound A Eastbound B Eastbound C Westbound C Eastbound A Eastbound B Eastbound C Westbound C
7.92 14.67 8.52 0.83 15.30 12.07 3.70 0.48 17.98 33.35 9.67 0.87 54.89 45.15 15.01 0.74 77.09 38.00 13.52 1.24 43.30 25.27 3.79 1.77
CC-2
CC-3
CC-4
CC-5
CC-6
Silt Content (%)
Silt Loading (g/m3)
PM10 Emission Factor g/Vehicle-km (g/Vehicle-mi)
PM2.5 Emission Factor g/Vehicle-km (g/Vehicle-mi)
5.79 4.84 8.28 17.05 3.74 5.52 8.75 16.69 9.36 9.97 11.05 25.25 8.66 9.39 9.94 25.59 8.31 6.25 8.88 16.19 5.97 5.79 14.08 22.24
0.46 0.71 0.54 0.14 0.57 0.67 0.32 0.08 1.68 3.33 1.07 0.22 4.75 4.24 1.49 0.19 6.41 2.38 1.20 0.20 2.58 1.46 0.53 0.39
– 8.82 (14.2) 2.2 (3.5) – 48.4 (30.1) 7.39 (11.9) – – 6.46 (10.4) 7.95 (12.8) – – – 30.6 (49.2) 18.6 (29.9) – – 19.1 (30.8) 11.6 (18.7) – 10.4 (16.4) 22.5 (36.2) – –
– 0.075 (0.12) – – – 0.758 (1.22) – – – 0.50 (0.80) – – – 0.24 (0.39) – – – 0.57 (0.92) – – – 1.14 (1.83) – –
a
An additional run (CC-7) was used to collect field blank filters, and runs CC-8 through CC-10 were conducted to collect additional PM2.5 filters for EC/organic carbon analysis.
which also shows the least-squares fit for the three The PM2.5 constituted a smaller fraction of PM10 than points. The area under the triangle formed by the two one would expect based on the AP-42 emission factor 1 axes and the regression line represents the mass of PM10 equation and the default a PM2.5:PM10 ratio of 0.25. The ratios developed from Table 7 range from ⬃0.01 to 0.10, with an overall (geometric) mean of 0.029. A likely explanation is that because of the high-speed traffic there was little opportunity for the tracked mud and dirt to be pulverized and for any PM2.5 to be disaggregated from coarser particles during the emission process. Discussion of the vehicle exhaust contribution to the PM2.5 fraction can be found in Kinsey et al.5 Because the roadway represented a nonuniformly emitting line source in that the emission strength varies along the road axis, it was necessary to accumulate the individual results from Locations A, B, and C into a single factor representing the mass emissions attributable to mud and dirt carryout. Mean, normalized emission factors for Locations A, B, and C, were plotted against the distance from access point. This is illustrated in Figure 6, Figure 6. Accumulation of point emission factors. Volume 55 June 2005
Journal of the Air & Waste Management Association 781
Muleski, Cowherd, and Kinsey emitted from an individual vehicle pass over the affected roadway. In this case: Area under regression line ⫽ 共24.3 g/vehicle-km兲 ⫻ 共0.433 km兲 / 2 ⫽ 5.3 g/vehicle
(2)
Based on the geometric mean ratio (2.9%) of PM2.5:PM10 emission factors in Table 7, the corresponding PM2.5 trackout emission factor is ⬃0.2 g/vehicle. The test report8 also presented an alternative method of aggregating individual test results into a single factor representing carryout emissions. This second method produced a value between 5.3 and 6.3 g/vehicle, which lends credence to the use of 6 g/vehicle as a reasonable PM10 carryout emission factor. In summary, each vehicle pass over the affected roadway results in ⬃6 g of PM10 being emitted (over a distance of ⬃430 m [1400 ft]). To place this number in context, note that substitution of the average background silt loading (i.e., westbound C in Table 7) in the AP-42 emission factor1 yields a PM10 emission factor of ⬃0.6 g/vehiclekm. Thus, in terms of PM10 emissions, the 430 m (1400 ft) of trackout-affected roadway is “equivalent” to ⬃10 km (6 mi) of roadway not affected by trackout. In terms of PM2.5 emissions, the equivalent length is slightly over 2 km (1.2 mi). Note that the trackout PM10 emission factor of 6 g/vehicle obtained in this study corresponds approximately to the 30th percentile of the 19 data points underlying EPA guidance values. On the other hand, the trackout emission factor of 0.2 g/vehicle obtained in this study is lower (by a factor of 2) than the smallest of the 19 PM2.5 data points included in the AP-42 paved road database.14 CONCLUSIONS Because of the uniqueness of construction activities as dust-producing sources, PM10 emission factors borrowed from other industries are generally found to be inapplicable to construction sources. In addition, the observed PM2.5:PM10 ratios often fall outside the range of those published for most fugitive dust emission source categories, that is, typically between 0.15 and 0.25. The conclusions below can be drawn from the field testing results and data comparisons generated in this series of field studies. Earthmoving (Scraper Operations) PM10 emissions from earthmoving using scrapers are dominated by the transit mode. A typical transport distance 300 – 600 m (1000 –2000 ft) will produce ⬃10 times 782 Journal of the Air & Waste Management Association
the mass of PM10 emissions as is produced by the loading and unloading operations. PM10 emissions from the loading/unloading of scrapers can vary from ⬃0.5 to 500 kg per 800 m3 (1–1000 lb per 1000 yd3), depending on the bulk properties of the soil being moved and the type of equipment being used. Scraper loading/unloading emissions exhibit PM2.5: PM10 ratios that are highly variable, depending on measurement height, the type of scraper used, and whether dozers assisted the scrapers. The geometric mean ratio of 0.48 is typically much higher than the ratios for scrapers in transit, which cluster around 0.25. The higher ratios measured for scraper loading/unloading stem from the increased diesel exhaust component observed during scraper loading/unloading operations. The scraper transit PM10 emission factor equation from the AP-42 section on surface coal mining underpredicts emissions from scrapers in transit at construction sites, by an order of magnitude. This reflects the poorly compacted nature of construction travel routes in comparison with scraper travel routes in surface coal mining. Similarly, the AP-42 generic unpaved road equation underpredicts PM10 emission by a factor of 2–3. Watering can provide a high level of PM10 control efficiency for scraper transit emissions. Average control efficiency remained above 75% ⬃2 hours after watering. The average PM10 efficiency decay rate for watering was found to vary from ⬃3 to 14% per hour. The decay rate depends on RH in a manner consistent with the effect of humidity on the rate of evaporation. Test results for watered scraper transit routes show a steep increase in control efficiency with a doubling of surface moisture and little additional control efficiency at higher moisture levels. This is in keeping with past studies, which found that control efficiency data can be successfully fitted by a bilinear function. Truck Loading and Dumping Emissions from truck loading were found to be 100 times greater than emissions from truck dumping. This reflects the much smaller capacity of the loader in comparison with the truck bed and the fact that the loading operation occurs at a higher elevation above ground with greater exposure to ambient winds. Mud and Dirt Carryout Tests of mud and dirt trackout indicate that a 10% soil moisture content represents a reasonable first estimate of the point at which watering becomes counterproductive. The control efficiencies afforded by graveling or paving of a 7.6-m (25-ft) access apron are in the range of 40 –50%. Using eq 2, mud and dirt trackout from an active construction project under warm dry conditions was Volume 55 June 2005
Muleski, Cowherd, and Kinsey found to result in an average of 5.3 g of PM10 emissions for every vehicle passing over the affected roadway. Alternately, a more conservative value of 6 g/vehicle can also be used for emissions inventory purposes. Placed in the context of “equivalent road length,” the length of roadway affected by trackout, 430 m (1400 ft), was found to be the PM10 emission equivalent of 10 km (6 mi) of unaffected roadway. The 5.3 g/vehicle for PM10 emissions is at the lower end of the range of previous EPA estimates of 5.5–13 g/vehicle. For the conditions tested in this study, trackout is far more important in terms of PM10 emissions than PM2.5 emissions. The value of 0.2 g/vehicle for PM2.5 emissions is far lower than prior EPA estimates. This is believed to be at least partially the result of the high average vehicle speed of 73 km/hr (45 mph), which did not permit pulverization of the tracked material and disaggregation of the PM2.5 component of PM10 during the emission process. The average PM2.5:PM10 of 0.029 is an order of magnitude smaller than the default ratio of 0.25 for paved roadways.
7.
8.
9. 10. 11. 12. 13.
14.
15.
16.
091 (NTIS PB2000 –101-11); U.S. Environmental Protection Agency, Research Triangle Park, NC, 1999. Muleski, G.E.; Cowherd, C. Jr. Particulate Emissions from Controlled Construction Activities; EPA-600/R-01– 031 (NTIS PB2001–107255); U.S. Environmental Protection Agency, Office of Air Quality Planning and Standards, Research Triangle Park, NC, 2001. Muleski, G.E.; Page, A.; Cowherd, C. Jr. Characterization of Particulate Emissions from Controlled Construction Activities: Mud/Dirt Carryout; EPA-600/R-03– 007; U.S. Environmental Protection Agency, Office of Air Quality Planning and Standards, Research Triangle, NC, 2003. Baxter, T. E.; Lane, D. D.; Cowherd, C. Jr.; Pendleton, F. Calibration of a Cyclone for Monitoring Inhalable Particulates. J. Environ. Eng. 1986, 112, 468. Cowherd, C. Jr.; Kuykendal, W. Fine Particle Components of PM10 from Fugitive Dust Sources; Paper 97-WP96.04; Presented at the Annual Meeting of the Air & Waste Management Association, 1997. Watson, J.G.; Chow, J.C. Particle and Gas Measurement on Filters. In Sampling of Environment Materials for Trace Analysis (Markert B., Ed), pp. 83–115; VCH: Weinheim, New York, Tokyo, 1994. Kinsey, J.S.; Englehart, P.; Jirik, A.L. Study of Construction Related Dust Control; Contract No. 32200 – 07976-01, Minnesota Pollution Control Agency, Roseville, MN, 1983. Cowherd, C.; Muleski, G.E.; Kinsey, J.S. Control of Open Fugitive Dust Sources; EPA-450/3– 8-008 (NTIS PB89 –103691); U.S. Environmental Protection Agency, Office of Air Quality Planning and Standards, Research Triangle Park, NC, 1988. Dunkins, R.; Cowherd, C. Jr. Fugitive Dust Background and Technical Information Document for Best Available Control Measures; EPA-450/2– 92-004 (NTIS PB93–122273); U.S. Environmental Protection Agency, Office of Air Quality Planning and Standards, Research Triangle Park, NC, 1992. Muleski, G.E.; Cowherd, C. Jr. Emission Factor Documentation for AP-42, Section 13.2.1 Paved Roads, U.S. Environmental Protection Agency; Office of Air Quality Planning and Standards; Research Triangle Park, NC, 1993. Caterpillar. Caterpillar Performance Handbook; 23rd ed.; Peoria, IL,1992.
REFERENCES 1. U.S. Environmental Protection Agency. Compilation of Air Pollutant Emission Factors, AP-42, Fifth Edition; Office of Air Quality Planning and Standards, Research Triangle Park, NC 1995. 2. Cowherd, C. Jr.; Axetell, K. Jr.; Guenther C.M.; Jutze G.A. Development of Emission Factors for Fugitive Dust Sources; EPA-450/3–74/037 (NTIS PB93–122273); U.S. Environmental Protection Agency, Office of Air Quality Planning and Standards, Research Triangle Park, NC, 1974. 3. Midwest Research Institute. Background Documentation for AP-42 Section 11.2.4, Heavy Construction Operations; EPA Contract No. 68-D0 – 0123, Work Assignment No. 44; U.S. Environmental Protection Agency, Office of Air Quality Planning and Standards, Research Triangle Park, NC, 1993. 4. Muleski, G.E.; Garman, G. Improvement of Specific Emission Factors (BACM Project No. 1); Prepared for South Coast Air Quality Management District, Contract 95040; Diamond Bar, CA, 1996. 5. Kinsey, J.S.; Linna, K.; Squire, W.C.; Muleski, G.E.; Cowherd, C. Jr. Characterization of Fugitive PM2.5 Emissions from Construction Mud/ Dirt Carryout. J. Air & Waste Manage. Assoc., submitted for publication. 6. Muleski, G.E.; Cowherd, C. Jr. Emission Measurements of Particle Mass and Size Emission Profiles from Construction Activities; EPA-600/R-99 –
Volume 55 June 2005
About the Authors Gregory E. Muleski and Chatten Cowherd, Jr., are principal engineer and principal advisor, respectively, at Midwest Research Institute, Kansas City, MO; John S. Kinsey is with the U.S. Environmental Protection Agency, Office of Research and Development, National Risk Management Research Laboratory, Research Triangle Park, NC. Address correspondence to: Chatten Cowherd, Jr., Midwest Research Institute, 425 Volker Blvd., Kansas City, MO 64110; e-mail:
[email protected].
Journal of the Air & Waste Management Association 783