ABSTRACT. Sugar Beets (Beta vulgaris L. cv F58-554H1) were cultured hydroponically in growth chambers. Leaf orthophosphate (Pi) levels were varied ...
Received for publication October 25, 1988 and in revised form February 10, 1989
Plant Physiol. (1989) 90, 820-826
0032-0889/89/90/0820/07/$01 .00/0
Leaf Phosphate Status, Photosynthesis and Carbon Partitioning in Sugar Beet II.
Diurnal Changes in Sugar Phosphates, Adenylates, and Nicotinamide Nucleotides 1. Madhusudana Rao, A. Raviraj Arulanantham, and Norman Terry* Department of Plant and Soil Biology, University of California, Berkeley, California 94720 ABSTRACT
intermediates to starch and sucrose) may limit the rate of photosynthesis under certain conditions (15, 24, 27, 33). In part I of this series (22), we showed that the reduction in the rate of photosynthesis in low-P leaves did not appear to be due to effects on RuBPCase activity, suggesting that low-P effects on photosynthesis were mediated through RuBP regeneration. This same study showed that the activities of several other key enzymes of the Calvin cycle were significantly affected by low-P (22). Based on these and other results (20, 21), we proposed that the decrease in photosynthesis with low-P may be due to the diversion offixed carbon from RuBP regeneration toward starch synthesis (21, 22). This hypothesis is further explored in the present study by measuring changes in leaf metabolites. We show that low-P decreased photosynthesis through an effect on RuBP regeneration and that this effect is not due to ATP and NADPH limitation. Because very few studies monitor the changes in the levels of leaf metabolites over time during the 24 h cycle, and because biochemical pathway patterns may change with time during the light and dark (e.g. starch and sucrose syntheses and degradations), we followed the changes in leaf metabolites diurnally.
Sugar Beets (Beta vulgaris L. cv F58-554H1) were cultured hydroponically in growth chambers. Leaf orthophosphate (Pi) levels were varied nutritionally. The effect of decreased leaf phosphate (low-P) status was determined on the diumal changes in the pool sizes of leaf ribulose 1,5-bisphosphate (RuBP), 3phosphoglycerate (PGA), triose phosphate, fructose 1,6-bisphosphate, fructose-6-phosphate, glucose-6-phosphate, adenylates, nicotinamide nucleotides, and Pi. Except for triose phosphate, low-P treatment caused a marked reduction in the levels of leaf sugar phosphates (on a leaf area basis) throughout the diumal cycle. Low-P treatment decreased the average leaf RuBP levels by 60 to 69% of control values during the light period. Low-P increased NADPH levels and NADPH/NADP+ ratio but decreased ATP; the ATP/ADP ratio was unaffected. Low P treatment caused a marked reduction in RuBP regeneration (RuBP levels were half the RuBP carboxylase binding site concentration) but did not depress PGA reduction to triose phosphate. These results indicate that photosynthesis in low-P leaves was limited by RuBP regeneration and that RuBP formation in low-P leaves was not limited by the supply of ATP and NADPH. We suggest that RuBP regeneration was limited by the supply of fixed carbon, an increased proportion of which was diverted to starch synthesis.
MATERIALS AND METHODS Plant Culture Sugar beets (Beta vulgaris L. cv F58-554H 1) were cultured hydroponically in growth chambers at 25°C, 500 ,umol. m-2 . s-' PFD and a 16 h photoperiod (28). Low-P and control plants were obtained by growing the plants at Pi concentrations of 0.05 and 1.0 mm, respectively (22). All measurements were carried out using recently expanded leaves.
Photosynthesis is inhibited in plants grown with an insufficient supply of Pi (3-6, 9, 19, 22, 25, 29). Photosynthetic CO2 fixation in low-P plants may be limited by either RuBPCase' activation or by RuBP regeneration (4, 5, 22). RuBP regeneration in turn may be limited by ATP supply, either because low-P treatment diminishes photosynthetic electron transport capacity, or because there is insufficient Pi available for the phosphorylation of ADP to ATP. With regard to the latter point, several researchers have proposed that the rate of Pi regeneration (from the conversion of phosphorylated
Leaf Sampling and Extraction of Metabolites Samples were prepared after 8 h of continuous darkness at 25°C in the growth chamber for the extraction of leaf metabolites in intact leaf tissue. The plants were then illuminated in the growth chamber at 500 ,mol m-2 * s' PFD and samples were prepared at 2, 4, 6, 10, and 16 h after illumination and 2 and 8 h after darkness. At each time point, four leaf discs (3.88 cm2 each) were punched and frozen rapidly in liquid N2 using a custom-built leaf punch machine. Adenylates (ATP, ADP, AMP), oxidized nicotinamide nucleotides (NADP+, NAD+), RuBP, PGA, triose-P, FBP, F6P, and G6P were
'Abbreviations: RuBPCase, ribulose 1,5-bisphosphate carboxylase/oxygenase; ADPG, adenosine 5'-diphosphoglucose; F6P, fructose-6-phosphate; FBP, fructose 1,6-bisphosphate; G3P, glyceraldehyde-3-phosphate; G6P, glucose-6-phosphate; IMP, inosine 5'-monophosphate; K.,, catalytic constant; PGA, 3-phosphoglycerate; FA, assimilatory force; Ru5P, ribulose 5-phosphate; RuBP, ribulose 1,5bisphosphate; triose-P, dihydroxyacetone phosphate + glyceraldehyde-3-phosphate; UDPG, uridine 5'-diphosphoglucose.
820
821
LEAF PHOSPHATE EFFECTS ON CARBON METABOLISM
extracted by grinding the leaf material in 12% HC104 (four leaf discs/4 mL) in a liquid N2-cooled mortar and pestle. The extracts were left for 1 h on ice and centrifuged at l0,OOOg for 10 min at 4°C. The supernatant was then neutralized with 10 N KOH. The KC104 precipitate was removed from the extract by centrifugation in a microfuge (Eppendorf: model 5414). Reduced nicotinamide nucleotides (NADPH, NADH) were extracted in 1 N NaOH instead of HC104. The extracts were boiled for 5 min and rapidly cooled before centrifugation. The supernatants were neutralized with 6 N HCI. All the extracts except for leaf adenylates were decolorized with activated charcoal (20 mg/1.2 mL) before centrifugation.
RESULTS Diumal Changes in Leaf Sugar-P
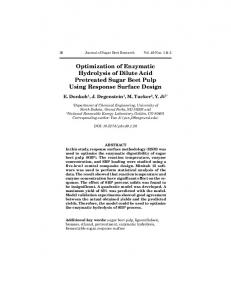
Leaf RuBP levels in control plants increased to high levels in less than 2 h and then remained fairly constant with time up to 16 h (Fig. 1). With the onset of darkness, RuBP levels decreased substantially within 2 h. RuBP levels in low-P leaves changed similarly with time. However, low-P treatment caused a marked reduction in RuBP during the light: it decreased the average leaf RuBP levels (over 2-16 h) by 60 to 69% of control values on a leaf area basis during the light period. Low-P treatment did not affect RuBP levels in darkness.
Assay of Metabolites
RuBP was determined by 14C incorporation into PGA as described in Badger et al. (2) using purified RuBP carboxylase (Sigma). Assays were run in 300 gL total volume (100 mM Bicine-NaOH [pH 8.0], 20 mM MgCl2, 13 mM NaH'4CO3 (50 Bq nmol-'), 50 ,g of purified RuBP carboxylase [EC 4.1.1.39] with 100 uL of sample per assay. Duplicate assays were run for 30 min at room temperature; the reactions were terminated by adding 0.2 mL of 6 N acetic acid. The samples were dried under an air stream and counted by liquid scintillation spectrometry. PGA was determined as described in Usuda (31). The reaction mixture contained: 40 mm HepesKOH (pH 7.8), 5 mM ATP, 0.2 mM NADH, 5 mM phosphocreatine, 10 units/mL of creatine phosphokinase (EC 2.7.3.2), 5 units/mL of NAD-G3P dehydrogenase (EC 1.2.1.12), and 5 units/mL of PGA-kinase (EC 2.7.2.3). The reaction was initiated by the addition of an aliquot of sample. Triose phosphates were determined by the addition of 5 units/mL triose phosphate isomerase (EC 5.3.1.1) and 0.4 units/mL glycerophosphate dehydrogenase (EC 1.1.1.8) to the assay medium containing: 50 mM Hepes-KOH (pH 8.0), 20 mM MgCL2, 10 mm KCI, 1 mm EDTA, 0.3 mM NADH, and an aliquot of sample (14). FBP, F6P, and G6P levels were determined in an assay consisting of: 50 mM Hepes-KOH (pH 7.6), 5 mM MgCl2, 1 mM EDTA, 0.2 mM NADP+, an aliquot of sample, and the sequential addition of 0.2 units/mL glucose6-P dehydrogenase (EC 1.1.1.49) for determining G6P, 0.4 units/mL phosphoglucoisomerase (EC 5.3.1.9) for determining F6P, and 0.05 units/mL of FBPase (EC 3.1.3.11) for determining FBP (14). Leaf adenylates were determined according to Fader and Koller (8). Leaf nicotinamide nucleotides were determined according to Maciejewska and Kacpereska (16). The leaf Pi levels were estimated as described before (9). By grinding leaf samples in the mortar with and without addition of standards, the percentage recovery of each metabolite was estimated. The recovery of the various metabolites in the above procedure was higher than 78%. The data presented are not corrected for calculated loss of metabolites. Chemicals All compounds used were purchased from Sigma Chemical Co. with the exception of NaH'4C03 (Amersham).
Leaf PGA levels in control leaves changed with time in a manner similar to the changes with time for RuBP but the changes were much less pronounced (Fig. 1 B). In low-P leaves, PGA levels exhibited no significant increase with time. Unlike RuBP, PGA levels were markedly diminished by low-P treatment in darkness as well as light. These results show that lowP treatment decreased leaf PGA more than the leaf RuBP: during the light period, the average PGA level was decreased by 79% while in darkness it was decreased by 69%. Low-P treatment had much less effect on leaf triose-P levels (Fig. IC) than it did on PGA and RuBP levels. On average,
I
O
4
8 12 16 4 TIME IN HOURS
8
Figure 1. Effect of low-P treatment on the diumal changes in RuBP (A), PGA (B), and triose-P (C) levels in sugar beet leaves. Values are mean ± SD for three replications. (0), Control; (0), low-P. The mean Chl content of leaves for control and low-P treatment were 428 mgm-2 and 529 mg. m2, respectively. Note that 10 zmoI . m2 of a metabolite is equivalent to 23.4 and 18.9 nmol * mg-1 Chi for control and low-P leaves, respectively. This content is equal to an intracellular concentration of 0.94 mm (control) and 0.76 mm (low-P) if confined to the chloroplast or cytosol with a volume of 25 IL * mg-' Chi.
822
RAO ET AL.
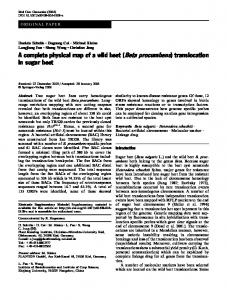
the triose-P levels in light were slightly lower in low-P versus control leaves, and in darkness there was no difference between the two treatments: the average light values were 20 and 14 ,umol m-2 in control and low-P leaves, respectively. Low-P treatment decreased PGA much more than it decreased RuBP as is illustrated by the changes in PGA/RuBP ratio (Fig. 2A). Despite the reduction in PGA, low-P treatment had little effect on the level of triose-P and the triose-P/PGA ratio was much higher in low-P leaves (Fig. 2B). The RuBP/ triose-P ratio was lower in low-P leaves over most of the light period but there was no difference in darkness (Fig. 2C). The data show that FBP increased during the first 2 h of illumination and then remained fairly constant with time during the next 14 h (the variations with time are not statistically significant) (Fig. 3A). With the onset of darkness, FBP in low-P leaves decreased to its minimum night level within 2 h while in control leaves it required longer than 2 h for this to occur. The changes with time for FBP mirrored those for RuBP. Low-P treatment decreased the level of leaf FBP both in light and darkness: the average FBP level in the light decreased by 41% while the average dark level decreased by 58%. The changes with time and low-P treatment for F6P and G6P (Fig. 3, B and C) were similar to those for PGA (Fig. 1) in that there were relatively small increases in the light in control plants, and in that low-P treatment decreased dark values of these metabolites substantially. Low-P treatment had a much greater effect on F6P and G6P levels than it did on FBP levels (Fig. 3, B and C). If one averages the data over 2 to 16 h of the light period, low-P treatment decreased F6P
6 4
(a aLA-
2 0
n r< u.O (5 0-
&- 04 L°0
00.2
U)
6
0
4 m
3'0
E 20 M
10 0 cF30
E
control
20o Low P
E E0
(_0
CmSi 90
Control
0w
E 60 0~
677 0
0
HT F
4
ZnGPARKtA
8 12 16 4 TIME IN HOURS
8
Figure 3. Effect of low-P treatment on the diurnal changes in FBP (A), F6P (B), and G6P (C) levels in sugar beet leaves. Values are mean ± SD for three replications. (0), Control; (40), low-P.
by 64% and G6P by 77%. The F6P and G6P data also differed
Diumal Changes in Leaf Adenylates
0
LU
E
A
from the FBP data in that there was much less change between light and dark. By comparing the average light value (data from 2-16 h of light) with the average dark value (data at beginning of light period and at the end of the dark period), we determined that there were significant increases (on illumination) for F6P (but not G6P) in control as well as in lowP leaves. The average light FBP/F6P ratio in low-P leaves was increased by 63% while the G6P/F6P ratio was decreased by 32% when compared to control values. The data with time were too variable to determine precisely how F6P and G6P changed with time but they suggest that, in control leaves, both these hexose phosphates increased over the first 4 h of light and that they remained high for 2 h of darkness before dropping to their minimum night values.
a] m
cr
Plant Physiol. Vol. 90, 1989
2
o o
4
8 12 16 4 TIME IN HOURS
8
Figure 2. Effect of low-P treatment on the diurnal changes in the ratios of PGA/RuBP (A), triose-P/PGA (B), and RuBP/triose-P (C) in sugar beet leaves. (0), Control; (0) low-P.
Low-P treatment decreased leaf ATP (Fig. 4A) and total adenylates (Fig. 4C) appreciably but had little effect on the ATP/ADP ratio (Fig. 4B). In control leaves ATP levels increased over the first 2 h then remained fairly constant with time until darkness when there was a slow decline. In low-P leaves, ATP levels appeared to increase slowly with time over the first 10 h of the light period, then become constant before declining slowly in darkness. Somewhat similar patterns with time for each treatment occurred for total adenylates. The average ATP value over 2 to 16 h of light was 22.5 ,Omol. m2; the average total adenylate value over the same period was 46 ,umol. m2. With low-P treatment, the average
LEAF PHOSPHATE EFFECTS ON CARBON METABOLISM
A 24 -
AR'Ke * DDARK
L IG H T
//A
~~~~Control
-
-r a. E
o
1.
16
a-
0