Seismograph stations of Rocky Mountain Front (RMF), Continental Dynamics of the Rocky Mountains .... 2002; Karato et al., 1998; Mainprice and Silver, 1993].
Passive Source Seismology of the Rocky Mountain Region Anne Sheehan, Vera Schulte-Pelkum, Oliver Boyd, and Charles Wilson CIRES and Department of Geological Sciences, University of Colorado at Boulder, Boulder, CO
Two recent passive source (earthquake) seismic experiments have produced a teleseismic and regional event data set which provides constraints on the structure of the crust and upper mantle beneath the Colorado Rocky Mountains and two major Precambrian province boundaries. The passive source component of the Continental Dynamics of the Rocky Mountains (CD-ROM) experiment included two dense north-south linear arrays of broad-band seismometers straddling Precambrian province boundaries in Colorado, Wyoming, and New Mexico. The Rocky Mountain Front (RMF) experiment included thirty broadband seismometers spaced uniformly throughout Colorado. Results from a spectrum of seismological imaging and inversion techniques indicate that the Cheyenne Belt Archean-Proterozoic boundary in southern Wyoming has signatures in both the crust and upper mantle, while the Yavapai-Mazatzal province boundary is less clearly defined. Studies of data from the RMF experiment show pronounced low seismic velocities in the crust and upper mantle beneath the Rocky Mountains, and high attenuation (low Q) in the mantle. Techniques of passive source seismology used with RMF and CD-ROM experiment data are described here, along with reference to corresponding studies. [this volume]. The Rocky Mountain Front (RMF) passive source seismic experiment provides further information on the lithospheric structure beneath a broad area of the southern Rocky Mountains, and two papers from that experiment are described here. Techniques in this volume include P-wave seismic travel-time tomography [Yuan and Dueker, this volume], receiver functions [Zurek and Dueker, this volume], shear wave splitting [Fox and Sheehan, this volume], Pn travel times [Lastowka and Sheehan, this volume], shear wave attenuation tomography [Boyd and Sheehan, this volume], and surface wave tomography [Li et al., this volume].
1. INTRODUCTION The Continental Dynamics of the Rocky Mountains (CDROM) experiment was designed to explore the geology and geophysics of the lithosphere along a transect from Wyoming to New Mexico. Particular emphasis was placed upon the study of proposed Precambrian suture zones which may document the growth and stabilization of the continent. The project included a coordinated set of seismic experiments, utilizing both active and passive source techniques. This paper provides an overview of the passive seismic experiments (those using naturally occurring earthquake sources), including the techniques, their limitations, resolution, and the models that result from their interpretation. Active source experiments (those utilizing energy actively put into the ground, through explosions or other means) are described in Prodehl et al.
2. PASSIVE SOURCE EXPERIMENTS IN THE ROCKIES The Program for Array Seismological Studies of the Continental Lithosphere (PASSCAL) of the Incorporated Research Institutions of Seismology (IRIS), funded by the US National Science Foundation, provides individual investigators use of portable, autonomous, digital seismographs with sensitive
Book Title Book Series Copyright 2004 by the American Geophysical Union 10.1029/Series#LettersChapter# 1
2
PASSIVE SOURCE SEISMOLOGY OF THE ROCKY MOUNTAIN REGION
broad-band seismometers. Instruments from this facility were used for both CD-ROM and RMF experiments. The broadband seismometers are capable of recording both teleseisms and regional earthquakes with very high fidelity. Relatively large numbers of instruments can be deployed in an array concentrated geographically over the structures of interest, and the array dimensions can be designed according to imaging density and resolution criteria. The passive source component of the Continental Dynamics of the Rocky Mountains (CD-ROM) experiment consisted of two north-south lines of broadband seismometers crossing major Precambrian province boundaries in Colorado, New Mexico, and Wyoming. The seismometers were deployed starting in April 1999 and removed in June 2000. The northern seismic line extended from Rawlins, Wyoming to Steamboat Springs, Colorado and traversed the ancient suture zone between the Archean Wyoming province and the Proterozoic Yavapai province. The southern line extended from the San Luis Basin in Colorado to Las Vegas, New Mexico and crossed the suture zone between the Yavapai province to the north and the younger Mazatzal province to the south. The southern line is also very proximal to the Rio Grand rift and the recent tectonism in the Jemez lineament. The deployment consisted of 25 instruments across the northern suture zone and 23 across the southern suture zone. The spacing between stations was approximately 10 km. Three-component sensors capable of recording teleseisms across a broad frequency band were installed at all sites, including 27 STS-2 seismometers, 15 CMG3T seismometers and six CMG40T seismometers. The sampling rate of the experiment ranged from 10 to 20 samples/second. The sampling rate was reduced because inclement weather would prevent the sites from being visited in the winter; therefore a lower sampling rate was needed in order to preserve field disk space. The CD-ROM line was supplemented by the Laramie real time array. The Laramie array consisted of 30 broadband seismometers at a station spacing of 1.6 kilometers, deployed from June 2000 to May 2001. The line crosses the Cheyenne Belt near Laramie, Wyoming (Figure 1). Each station in the Laramie Array consisted of Guralp 40-T seismometers recording at 1, 40 and 100 samples per second. The data were telemetered to the University of Wyoming in real time. The Rocky Mountain Front experiment consisted of a deployment of thirty-five broadband (CMG3-ESP and STS2) seismometers distributed throughout Colorado and extending into eastern Utah and western Kansas (Figure 1). The stations were deployed from May through December of 1992. Station spacing was approximately 75 km. Data was collected from each station in both continuous (10 samples per second) and triggered (20 samples per second) data streams. Numerous studies utilizing data from the Rocky Mountain Front
array have been published, including shear wave velocity tomography [Lee and Grand, 1996], surface wave tomography [Li et al., 2002], receiver functions [Sheehan et al., 1995], shear wave splitting [Savage et al., 1996; Savage and Sheehan, 2000], and deep discontinuity structure [Dueker and Sheehan, 1998; Gilbert and Sheehan, 2004]. Other recent passive seismic source seismic experiments in the Rocky Mountain and Colorado Plateau regions include the Lodore array [Crosswhite and Humphreys, 2003], the Deep Probe experiment [Crosswhite et al., 1999], the Colorado Plateau – Great Basin Experiment [Sheehan et al., 1997], and the RISTRA experiment [Wilson and Aster, 2003] (Figure 1). 3. RECEIVER FUNCTIONS The isolation of conversions from compressional to shear waves on teleseismic waveforms can be used to determine crust and mantle velocity discontinuity structure beneath seismic stations using a technique referred to as receiver function analysis [Burdick and Langston, 1977; Langston, 1977; Langston, 1979]. An incident P wave from a distant earthquake generates converted shear waves at boundaries with impedance contrasts, such as the Moho. The delay time between the direct P arrival and the converted S wave, called Ps, is related to the velocity and depth to the conversion point. The near vertical incidence of teleseismic P allows the separation of the P and converted S wave because the converted shear wave is large on the radial component of the seismogram and the vertical component is dominated by the incident P wave. The P wave record on the vertical component provides a reference for the earthquake source and path effects, and receiver function analysis involves the deconvolution of the vertical component from the radial in order to enhance the nearreceiver mode conversions. Typically, the most significant converted arrivals are those from the Moho, but conversions from velocity discontinuities in the mid-crust and in the mantle transition zone are also common. Basic receiver function analysis assumes that the seismic structure of the crust and upper mantle are isotropic and comprised of flat lying planar interfaces. In the presence of anisotropy and dipping layers these assumptions are not accurate [ Bostock, 2003; Levin and Park, 1997; Savage, 1998]. With a good back-azimuth distribution of recorded events, the presence of these more complicated structures may be recognized by changes in timing and amplitude of the converted phases. High density passive seismic arrays stretching tens to thousands of kilometers have become the foundation of many modern receiver function studies [e.g., Dueker and Sheehan, 1997; Rondenay et al., 2000a, 2000b; Zurek and Dueker, this
SHEEHAN ET AL. 3
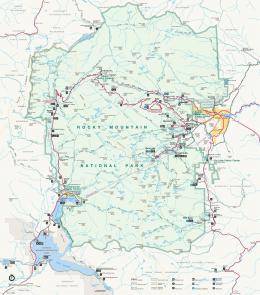
Figure 1. Seismograph stations of Rocky Mountain Front (RMF), Continental Dynamics of the Rocky Mountains (CDROM), Laramie Array, Deep Probe, RISTRA, and Colorado Plateau-Great Basin broadband passive source seismic PASSCAL experiments. Open circles indicate RMF station locations, diamonds denote CD-ROM station locations, inverted triangles Laramie Array stations, filled triangles RISTRA stations, squares Colorado-Plateau Great Basin stations, unfilled triangles Deep Probe stations, and filled circles Lodore stations.
volume] in order to combat signal generated noise and to determine high resolution lithospheric structure. Seismic arrays recording multiple observations of the same conversion point from many teleseismic events allows the employment of techniques such as common conversion point stacking or seismic migration [e.g., Bank and Bostock, 2003; Wilson et al., 2003]. All of these seismic imaging approaches begin with the assumption of a seismic velocity model. The calculated receiver functions are then back projected along their theoretical ray paths to restore the converted energy to the point of conversion. Multiple samples from different directions of the same conversion point are required to recover the amplitude of the original conversion. In theory, the amplitude of the conversion should provide information about the variation in seismic properties across a conversion interface. The location restoration and amplitude recovery problem can be formulated as a forward problem (common conversion point stacking) or as an inverse problem (seismic migration) and the choice of technique depends upon factors including the geometry of the imaging target, the array geometry, and the signal quality.
With data from deployments such as the RMF and CDROM experiments, receiver function analysis provides a plan view of crustal thickness variations and cross sections of detailed discontinuity variations, which can then be interpreted in terms of the major structural trends exhibited in the geology. Gilbert and Sheehan [2004] use data from RMF, CD-ROM, Deep Probe, and other passive source studies for a crustal receiver function study throughout the western United States building upon previous studies of Sheehan et al. [1995] and others. They find a crustal thickness of 50 km beneath the Rockies in northern Colorado, thinning to 40 km in southern Colorado. Detailed crustal images from CD-ROM have been presented in Dueker et al. [2001] and Karlstrom et al. [2002]. The Moho along the southern CD-ROM line was found to be fairly flat, with a thickness of approximately 40 km, and a slight thickening to the north. The receiver function results from the CD-ROM north line are more complex. A thick crust of ~50 km is found in northern Colorado, thinning to 40–45 km just south of the Colorado/Wyoming border. The Moho appears to be imbricated about 30 km north of the Cheyenne belt suture. Crust to the north of the Cheyenne
4
PASSIVE SOURCE SEISMOLOGY OF THE ROCKY MOUNTAIN REGION
belt is of ~40 km thickness. In this volume, Zurek and Dueker present images of lithospheric receiver function discontinuities from the CD-ROM arrays. They argue for sub-crustal discontinuities to 150 km depth beneath the Proterozoic lithosphere immediately south of the Cheyenne belt and to 100 km beneath the Jemez lineament based upon layering observed to those depths. Mid-crustal features are also imaged under the Cheyenne belt, and correspond with CD-ROM reflection profiles [Morozova et al., 2002; Karlstrom et al., 2002]. 4. TOMOGRAPHY: P, S, AND SURFACE WAVES Three papers appearing in this volume use passive wave seismic tomography to examine crustal and upper mantle thermal and compositional structure. Tomographic problems are inversions of a large set of linear equations. An observation, such as P-wave travel time, is ideally the effect of a seismic attribute integrated over space, e.g. P-wave velocity integrated over the path the seismic wave has traveled. The equations are usually of the form d=Gm where d is the data vector, such as a set of observations like P-wave travel times, m is the model vector which contains a set of model parameters such as P-wave slowness in the upper mantle, and G is the path kernel, a j by k matrix with, in this case, the distance traveled in k model bins for j observations. A solution for m may be obtained by various methods [Iyer and Hirahara, 1993]. The solution is usually determined in a least squares sense, e.g. the solution tries to minimize the squares of the residuals between predicted and observed data. The solution may be damped and/or weighted and solved by gaussian elimination, singular value decomposition, or other methods. Some caution should be used when interpreting tomographic images. For example, variability in the measurements will affect the model regardless of whether the measured variation originated from within the model. A related problem is the assumption that the measured attribute is due to variations along the presumed seismic ray path [Dahlen et al., 2000a; 2000b]. Finally, anomalies within the tomographic model tend to bleed along regions of poor ray coverage. Structures that dip away along ray paths at the edge of tomographic models should be viewed with skepticism. Though dependence between model parameters can be observed in the resolution matrix, checkerboard tests are a useful guide to estimate the quality of features in the tomographic model. In this method, a synthetic model is generated and using the incomplete ray coverage of the real data, synthetic data are produced. The synthetic data are then inverted to see how well the input checkerboard model is recovered. Interdependence of model parameters and poorly resolved regions can be seen easily with this technique.
4.1. Body Wave Velocity Tomography In Yuan and Dueker [this volume] upper mantle compressional and shear wave images from the CD-ROM experiment are presented. Two major anomalies are found. Beneath the Cheyenne belt along the CD-ROM North Line, a north dipping high velocity feature from the Moho to 200 km depth is found. Travel time modeling suggests that a significant portion of the dipping high velocity anomaly is due to anisotropy with a dipping fast axis. Shear wave splitting measurements [Fox and Sheehan, this volume] are also consistent with this dipping seismic anisotropic model. Beneath the Jemez lineament along the CD-ROM South Line, a 100-km wide low velocity anomaly is imaged between the Moho and 100 km depth. 4.2. Attenuation Tomography Utilizing the Rocky Mountain Front (RMF) broadband seismic dataset, Boyd and Sheehan [this volume] derive the shear wave attenuation structure underlying the Southern Rocky Mountains and surrounding areas. Attenuation is measured using differential spectra of teleseismic S phase waveforms. Calculations of intrinsic attenuation coupled with current velocity models aids in the determination of temperature, partial melt distributions, and compositional variation [Karato, 1993]. A north-south zone of high shear wave attenuation (low Q) is found in the mantle in south central Colorado, along the northern reaches of the Rio Grande rift, and coincides with a region of low shear wave velocity [Lee and Grand, 1996]. The correlation between the velocity and attenuation models can be used to distinguish between thermal, compositional, and melt anomalies. Beneath the High Plains the combined velocity and attenuation variations are consistent with slight increases in temperature to the west, while beneath the southwest Rockies, the presence of compositional variations and partial melt are required to explain the observations. 4.3. Surface Wave Tomography Li et al. [this volume] present a tomographic inversion of Rayleigh surface wave phase velocities from the RMF dataset across the southern Rocky Mountains. Previous surface wave work with the RMF data [Lerner-Lam et al., 1998] showed large shear wave velocity variations across the Rocky Mountain Front, with lower velocities beneath the Rockies than beneath the High Plains. Li et al. [this volume] use the technique of Forsyth et al. [1998] and Li [2001], where the wavefield is represented as the sum of two interfering plane waves, and invert amplitude and phase data for phase velocity, then invert the phase velocity for shear velocity structure. They do not find a lithospheric lid beneath the Rocky Mountains, and
SHEEHAN ET AL. 5
find low mantle velocities beneath the Rockies to at least 150 km. Beneath the Great Plains a fast lithosphere is found to a depth of 150 km. The Colorado Plateau is found to have a fast seismic lid to 100 km depth, with low velocities below 100 km, similar to results reported by Lastowka et al. [2001]. The surface wave tomography results are broadly consistent with the RMF shear body wave tomography work of Lee and Grand [1996] but differ in some details, particularly with respect to the depth extent of the velocity anomalies. There are some differences between the surface wave derived crustal thicknesses and the receiver function and refraction based crustal thicknesses [Sheehan et al., 1995; Keller et al., 1998]. These are explained in part by the large lateral variations in crustal wave speeds allowed by the Li et al. model and differences in lateral and vertical resolution between surface wave and receiver function techniques. Li et al. [this volume] do not f ind low upper mantle velocities beneath west-central Colorado near Aspen to the extent reported by Dueker et al. [2001], but instead find unusually low crustal velocities there. A tomographic study with denser station distribution in central Colorado may be needed to resolve the depth extent and nature of the Aspen anomaly. 5. VELOCITIES OF UPPERMOST MANTLE (Pn) Lastowka and Sheehan [this volume] report interstation Pn velocities from the CD-ROM array. The Pn portion of the waveform arrives first in the distance range 2 to 16 degrees and represents high frequency seismic energy propagating in the uppermost mantle. It has been modeled successfully both as a whispering gallery phase [Menke and Richards, 1980] and as a mantle-lid refraction [Sereno and Orcutt, 1985]. Lastowka and Sheehan [this volume] measure Pn velocities using an interstation method. The Pn arrival times of two stations along the same great circle path from an event are measured, differenced, and the distance between the stations is divided by the differential time. The interstation method reduces errors due to hypocenter mislocation. For the southern CDROM line, Pn is measured by constructing a travel time curve of all of the southern line stations that recorded a single earthquake in Mexico, which happened to be along the same great circle line as the stations. Such a measurement is more robust than individual interstation measurements. Low Pn velocities of 7.8 ± 0.1 km/s were found beneath the southern CD-ROM array, consistent with low upper mantle velocities and the absence of a mantle lid. This low velocity is consistent with the high heat flow in the Rio Grande rift and the evidence for modern rifting. These data provide independent confirmation of the low upper mantle velocities from P wave tomography found along the CD-ROM south line by Yuan and Dueker [this volume]. Measurements of Pn
made in northern Colorado and in Wyoming are near the global average Pn value of 8.1 km/s, suggesting an intact mantle lid. 6. MANTLE ANISOTROPY Most passive source techniques, such as tomography and receiver function analysis, provide an image of the current structure of the crust and mantle. In contrast, the measurement of seismic anisotropy has the potential to give information on the dynamic state of the Earth. Olivine, the constituent mineral in the upper mantle, is highly anisotropic, and orients itself systematically during deformation under conditions that allow dislocation creep. Thus, mantle anisotropy can give images of strain in the mantle due to current processes, or provide a history of past deformation [Blackman et al., 2002; Karato et al., 1998; Mainprice and Silver, 1993]. The most popular method to measure seismic anisotropy is through shear wave splitting. The polarization of a shear wave is perpendicular to its direction of propagation. When a shear wave enters an anisotropic region, its initial polarization may be at an angle to the medium’s fast and slow axes, and the component oscillating along the fast axis will propagate faster than the component polarized along the slow axis. Eventually, the fast component will separate from the slow component, so that the single incident shear phase is split into two phases with identical shape. In a medium with hexagonal or orthorhombic anisotropic symmetry, the fast and slow symmetry axes and therefore the corresponding split shear phases are orthogonal to each other. Shear wave splitting techniques measure the time delay between the fast and slow phase, delta t, and the polarization azimuth of the fast phase, φ [e.g., Silver and Chan, 1988, 1991] The phases most commonly used for this process are the core phases SKS and SKKS. These phases convert from shear to compressional motion in the fluid outer core, and after conversion back to shear, travel steeply from the core-mantle boundary to the seismic station. The analysis is simpler than for teleseismic S since information about source-side anisotropy is removed on the core leg. However, measured SKS and SKKS splitting can still stem from anywhere between the core-mantle boundary and the station. By making measurements at several stations from a number of different source areas, some depth constraints can be obtained by determining the overlap of different ray paths [Alsina and Snieder, 1995]. Near the Rocky Mountain region, previous studies have found fast orientations which were interpreted in terms of asthenospheric flow beneath the Snake River Plain [Schutt et a.l, 1998] and the Rio Grande rift [Sandvol et al., 1992]. Closer to the Rocky Mountain Front, Schutt and Humphreys [2001] and Savage et al. [1996] found more complex splitting
6
PASSIVE SOURCE SEISMOLOGY OF THE ROCKY MOUNTAIN REGION
signatures, with fast orientations dependent on backazimuth of the incident shear phase, rapid lateral variation of observations between stations, and many null measurements. A null measurement, i.e. no observation of splitting, occurs when the incident shear phase is already polarized along one of the symmetry axes of the medium, or if it is propagation along the single symmetry axis in a hexagonal medium, or if the medium is isotropic. Savage et al. [1996] favor a vertically aligned hexagonal symmetry to explain null measurements and inconsistent splitting results seen in the Rocky Mountain Front experiment. Other possible explanations given by Savage et al. [1996] are depth-dependent anisotropy, orthorhombic symmetry, plunging axes of anisotropy, and lateral variations. In this volume, Fox and Sheehan analyze shear wave splitting using a larger data set from the CD-ROM and Laramie arrays. They find consistent fast orientations that correlate with absolute plate motion in southern Colorado and New Mexico, similar to that seen by Li et al. [this volume] using seismic surface waves. To the north of the Cheyenne belt, Fox and Sheehan [this volume] find a complex pattern with backazimuthal dependence along both the CD-ROM and Laramie arrays in southern Wyoming. With the large number of stations and events and good azimuthal coverage, they are able to perform hypothesis testing for layered anisotropy and plunging symmetry axes, and arrive at a preferred model with a steeply plunging axis of symmetry that may be related to a highvelocity anomaly seen in a tomographic inversion for the area [Yuan and Dueker, this volume]. 7. CONCLUSION Detailed passive seismic studies of the Rocky Mountains provide much information on the crust and mantle beneath this complex orogenic region. Data from the Rocky Mountain Front experiment have been used to determined large scale structure, and data from the CD-ROM experiment provide details of Precambrian province boundaries. Studies using the Rocky Mountain Front data show that the crust is thick beneath the Rocky Mountains and the western Great Plains, and that P and S wave velocities in the mantle beneath the Rockies are low. Seismic attenuation is high in this region, consistent with both compositional and thermal origins for the velocity and attenuation heterogeneity. Data from the CDROM array show a high velocity body in the mantle dipping to the north beneath the Cheyenne belt. The presence of this feature is also detected with seismic shear wave splitting, and it has a strong anisotropic signature with plunge to the northeast. Beneath the Jemez lineament low velocities are found in the upper mantle with both seismic body wave tomography and Pn travel times.
Acknowledgments: We thank Jason Crosswhite and Ken Dueker for their efforts with the CD-ROM field program and Lynda Lastowka and Otina Fox for CD-ROM data management. We thank Art Lerner-Lam for leading the Rocky Mountain Front (RMF) experiment. Both RMF and CD-ROM experiments utilized seismic equipment from the IRIS PASSCAL instrument pool and we thank staff from the Lamont and New Mexico PASSCAL instrument centers for their assistance.
REFERENCES Alsina, D., and R. Snieder, Small-scale sublithospheric continental mantle deformation: Constraints from SKS splitting observations, Geophys. J. Int., 123, 431–448, 1995. Bank, C.-G., and M. G. Bostock, Linearized inverse scattering of teleseismic waves for anisotropic crust and mantle structure: 2. Numerical examples and application to data from Canadian Stations, J. Geophys. Res., 108(B5), 2259, doi:10.1029/2002JB001951, 2003. Blackman, D. K., H. R. Wenk, and J. M. Kendall, Seismic anisotropy in the upper mantle: 1. Factors that affect mineral texture and effective elastic properties, G-Cubed, 3(9), 8601, doi:10.1029/2001GC000247, 2002. Bostock, M.G., Linearized inverse scattering of teleseismic waves for anisotropic crust and mantle structure: 1. Theory, J. Geophys. Res., 108(B5), doi:10.1029/2002JB001950, 2003. Boyd, O. S. and A. F. Sheehan, Attenuation tomography beneath the Rocky Mountain Front: Implications for the physical state of the upper mantle, in AGU Monograph on the Lithospheric Structure of the Rocky Mountains, K. Karlstrom and G. R. Keller, eds., in press (this volume), 2004. Burdick, L. J., and C. A. Langston, Modeling crustal structure through the use of converted phases in teleseismic body waveforms, Bull. Seismol. Soc. Am., 67, 677–692, 1977. Crosswhite, J. A., and E. D. Humphreys, Imaging the mountainless root of the 1.8 Ga Cheyenne belt suture, Geology, 31, 2003. Crosswhite, J. A., K. Dueker, and G. Humphreys, The Lodore, Deep Probe and CDROM Teleseismic Arrays; Imaging and ArcheanProterozoic Suture Using Receiver Function Stacking, Geological Society of America, 1999 annual meeting, Abstracts with Programs - Geological Society of America, 31, 129, 1999. Dahlen, F.A., S.-H. Hung, and G. Nolet, Frechet kernels for finitefrequency traveltimes – I. Theory, Geophys. Jour. Int., 141, 157–174, 2000a. Dahlen, F.A., S.-H. Hung, and G. Nolet, Frechet kernels for finitefrequency traveltimes – II. Examples, Geophys. Jour. Int., 141, 175–203, 2000b. Dueker, K. G. and A. F. Sheehan, Mantle discontinuity structure from midpoint stacks of converted P and S waves across the Yellowstone hotspot track, J. of Geophys. Res., 102(B4), 8313–8327, 1997. Dueker, K. G., and A. F. Sheehan, Mantle discontinuity structure beneath the Colorado Rocky Mountains and High Plains, J. Geophys. Res., 103, 7153–7169, 1998. Dueker, K., H. Yuan, and B. Zurek, Thick Proterozoic lithosphere of the Rocky Mountain region, GSA Today, 11, 4–9, 2001. Forsyth, D. W., S. Webb, L. Dormann, and Y. Shen, Phase velocities of Rayleigh waves in the MELT experiment on the East Pacific
SHEEHAN ET AL. 7 Rise, Science, 280, 1235–1238, 1998. Fox, O. and A. F. Sheehan, Shear wave splitting beneath the CDROM transects, in AGU Monograph on the Lithospheric Structure of the Rocky Mountains, K. Karlstrom and G. R. Keller, eds., in press (this volume), 2004. Gilbert, H. J., and A. F. Sheehan, Images of crustal thickness variations in the intermountain west, J. Geophys. Res., in press, 2004. Gilbert, H. J., A. F. Sheehan, K. G. Dueker, and P. Molnar, Receiver functions in the western United States, with implications for upper mantle structure and dynamics, J. Geophys. Res., 108(B5), doi:10.1029/2001JB001194, 2003. Iyer, H. M., and K. Hirahara, Tomography using both local earthquakes and teleseisms; velocity and anisotropy; theory, in Seismic tomography; Theory and practice, Chapman & Hall, London, 493–518, 1993. Karato, S., Importance of anelasticity in the interpretation of seismic tomography, Geophys. Res. Lett., 20, 1623–1626, 1993. Karato, S., S. Zhang, M. E. Zimmerman, M. J. Daines, D. L. Kohlstedt, Experimental studies of shear deformation of mantle materials: Towards structural geology of the mantle, Pageoph., 151, 589–603, 1998. Karlstrom, K. E., S. A. Bowring, K. R. Chamberlain, K. G. Dueker, T. Eshete, E. A. Erslev, G. L. Farmer, M. Heizler, E. D. Humphreys, R. A. Johnson, G. R. Keller, S. A. Kelley, A. Levander, M. B. Magnani, J. P. Matzel, A. M. McCoy, K. C. Miller, E. A. Morozova, F. J. Pazzaglia, C. Prodehl, H. M. Rumpel, C. A. Shaw, A. F. Sheehan, E. Shoshitaishvili, S. B. Smithson, C. M. Snelson, L. M. Stevens, A. R. Tyson, and M. L. Williams, Structure and evolution of the lithosphere beneath the Rocky Mountains: Initial results from the CD-ROM experiment, GSA Today, v. 12, no. 3, p. 4–10, March 2002. Keller, G. R., C. M. Snelson, A. F. Sheehan, and K. G. Dueker, Geophysical studies of crustal structure in the Rocky Mountain region: a review, Rocky Mtn. Geol., 33,217–228,1998. Langston, C.A., Corvalis, Oregon, crustal and upper mantle receiver structure from teleseismic P and S waves, Bull. Seismol. Soc. Am., 67, 713–724, 1977. Langston, C. A., Structure under Mount Rainier, Washington, inferred from teleseismic bodywaves, J. Geophys. Res., 84, 4749–4762, 1979. Lastowka, L. A., and A. F. Sheehan, CDROM interstation Pn study across the Rio Grande Rift, in AGU Monograph on the Lithospheric Structure of the Rocky Mountains, K. Karlstrom and G. R. Keller, eds., in press (this volume), 2004. Lastowka, L. A., A. F. Sheehan, and J. M. Schneider, Seismic evidence for partial lithospheric delamination model of Colorado Plateau uplift, Geophys. Res. Lett., 28, 1319–1322, 2001. Lee, D. K., and S. P. Grand, Upper mantle shear structure beneath the Colorado Rocky Mountains, J. Geophys. Res., 101, 22,233–22,244, 1996. Lerner-Lam, A. L., A. F. Sheehan, S. Grand, E. Humphreys, K. Dueker, E. Hessler, H. Guo, D. Lee, M. Savage, Deep Structure beneath the Southern Rocky Mountains from the Rocky Mountain Front Broadband Seismic Experiement, Rocky Mountain Geology, 33, 199–216, 1998.
Levin, V., and J. Park, Crustal anisotropy in the Ural Mountains from teleseismic receiver functions, Geophys. Res. Lett., 24;11, 1283–1286, 1997. Li, A., Crust and mantle discontinuities, shear wave velocity structure, and azimuthal anisotropy beneath North America, Ph. D. dissertation, Brown University, 2001. Li, A., D. W. Forsyth, and K. M. Fischer, Rayleigh wave constraints on shear-wave structure and Azimuthal Anisotropy Beneath the Colorado Rocky Mountains, in AGU Monograph on the Lithospheric Structure of the Rocky Mountains, K. Karlstom and G. R. Keller, eds., in press (this volume), 2004. Li, A., D. W. Forsyth, and K. M. Fischer, Evidence for shallow isotastic compensation of the southern Rocky Mountains from Rayleigh wave tomography, Geology, 30, 683–686, 2002. Mainprice, D. and P. G. Silver, Constraints on the interpretation of telesiesmic SKS observations from kimberlite nodules from the subcontinental mantle, Physics of the Earth and Planetary Interiors, 78, 257–280, 1993. Menke, W. H. and P. G. Richards, Crust mantle whispering gallery phases: a deterministic model of teleseismic Pn wave propagation, J. Geophys. Res., 85, 5416–5422, 1980. Morozova, E. A., Wan, X., Chamberlain, K. R., Smithson, S. B., Morozova, I. B., Boyd, N. K., Johnson, R. A., Karlstrom, K. E., Tyson, A. R., and Foster,C. T., Geometry of Proterozoic sutures in the central Rocky Mountains from seismic reflection data: Cheyenne belt and Farwell Mountain structures, Geophys. Res. Lett., 29, 1639, 10.1029/2001GL013819, 2002. Prodehl, C., G. R. Keller, R. A. Johnson, C. Snelson, and H. M. Rumpel, Background and overview of previous controlled source seismic studies, in AGU Monograph on the Lithospheric Structure of the Rocky Mountains, K. Karlstrom and G. R. Keller, eds., in press (this volume), 2004. Rondenay, S., M. Bostock, T. Hearn, D. White, H. Wu, G. Senechal, S. Ji, and M. Mareschal, Teleseismic studies of the lithosphere below the Abiti-Grenville Lithoprobe transect, Can. J. Earth Sci., 37(2–3), 415–426, 2000a. Rondenay, S. G., M. G. Bostock, T. M. Hearn, D. J. White, and R. M. Ellis, Lithospheric assembly and modification of the SE Canadian Sheild: Abitibi-Grenville teleseismic experiment, J. Geophys. Res., 105, 13,735–13,754, 2000b. Sandvol, E., J. Ni, S. Ozalaybey, and J. Schlue, Shear wave splitting in the Rio Grande rift, Geophys. Res. Lett., 19, 2337–2340, 1992. Savage, M. K., Lower crustal anistropy or dipping boundaries? Effects on receiver functions and a case study in New Zealand, J. Geophys. Res., 103, 15,069–15,087, 1998. Savage, M. K., and A. F. Sheehan, Seismic anisotropy and mantle flow from the Great Basin to the Great Plains, western United States, J. Geophys. Res., 105, 13,715–13,734, 2000. Savage, M. K., A. F. Sheehan, and A. Lerner-Lam, Shear wave splitting across the Rocky Mountain Front, Geophysical Research Letters, I (B17), 2267–2270, 1996. Schutt, D. L. and E. D. Humphreys, Evidence for a deep asthenosphere beneath North America from western United States SKS splits, Geology, 29, 291–294, 2001.
8
PASSIVE SOURCE SEISMOLOGY OF THE ROCKY MOUNTAIN REGION
Schutt, D., E. D. Humphreys, and K. Dueker, Anisotropy of the Yellowstone hot spot wake, eastern Snake River Plan, Idaho, Pure Appl. Geophys., 151, 443–462, 1998. Sereno, T.J. and J. Orcutt, Synthesis of realistic oceanic Pn waves trains, J. Geophys. Res., 90, 12,755–12,776,1985. Sheehan, A. F., G. A. Abers, C. H. Jones, A. L. Lerner-Lam, Crustal thickness variations across the Colorado Rocky Mountains from teleseismic receiver functions, J. Geophys. Res., 100, 20,391–20,404, 1995. Sheehan, A. F., C. H. Jones, M. K. Savage, S. Ozalaybey, and J. M. Schneider, Contrasting lithospheric structure beneath the Colorado Plateau and Great Basin: Initial results from Colorado Plateau - Great Basin PASSCAL experiment, Geophys. Res. Lett., 24, 2609–2612, 1997. Silver, P. G., and W. W. Chan, Shear Wave Splitting and Subcontinental Mantle Deformation, J Geophys. Res., 96 (B10), 16,429–16,454, 1991. Silver, P. G., and W. W. Chan, Implications for continental structure and evolution from seismic anisotropy, Nature, 335, 34–39, 1988. Wilson, D. and Aster, R., Imaging crust and upper mantle seismic structure in the southwestern United States using teleseismic receiver functions, The Leading Edge, 22, 232–237, 2003. Wilson, C. K., C. H. Jones, and H. J. Gilbert, Single chamber silicic
magma system inferred from shear wave discontinuities of the crust and uppermost mantle, Coso geothermal area, California, J. Geophys. Res., 108, 1–16, 2003. Yuan, H., and K. Dueker, Upper mantle tomographic Vp and Vs images of the Middle Rocky Mountains in Wyoming, Colorado, and New Mexico: Evidence for a thick heterogeneous chemical lithosphere, in AGU Monograph on the Lithospheric Structure of the Rocky Mountains, K. Karlstrom and G. R. Keller, eds., in press (this volume), 2004. Zurek, B. and K. Dueker, Lithospheric Stratigraphy beneath the Southern Rocky Mountains, USA, in AGU Monograph on the Lithospheric Structure of the Rocky Mountains, K. Karlstrom and G. R. Keller, eds., in press (this volume), 2004. Oliver Boyd, CIRES and Department of Geological Sciences, University of Colorado at Boulder, Boulder, CO. Vera Schulte-Pelkum, CIRES and Department of Geological Sciences, University of Colorado at Boulder, Boulder, CO. Anne Sheehan, CIRES and Department of Geological Sciences, University of Colorado at Boulder, Boulder, CO. Charles Wilson, CIRES and Department of Geological Sciences, University of Colorado at Boulder, Boulder, CO.