View Article Online View Journal
PCCP Physical Chemistry Chemical Physics
Accepted Manuscript
This article can be cited before page numbers have been issued, to do this please use: T. Zhou, S. V. Zybin, W. A. Goddard, T. Cheng, S. Naserifar, A. Jaramillo-Botero and F. Huang, Phys. Chem. Chem. Phys., 2018, DOI: 10.1039/C7CP07321F. Volume 18 Number 1 7 January 2016 Pages 1–636
PCCP Physical Chemistry Chemical Physics www.rsc.org/pccp
This is an Accepted Manuscript, which has been through the Royal Society of Chemistry peer review process and has been accepted for publication. Accepted Manuscripts are published online shortly after acceptance, before technical editing, formatting and proof reading. Using this free service, authors can make their results available to the community, in citable form, before we publish the edited article. We will replace this Accepted Manuscript with the edited and formatted Advance Article as soon as it is available. You can find more information about Accepted Manuscripts in the author guidelines.
ISSN 1463-9076
PERSPECTIVE Darya Radziuk and Helmuth Möhwald Ultrasonically treated liquid interfaces for progress in cleaning and separation processes
Please note that technical editing may introduce minor changes to the text and/or graphics, which may alter content. The journal’s standard Terms & Conditions and the ethical guidelines, outlined in our author and reviewer resource centre, still apply. In no event shall the Royal Society of Chemistry be held responsible for any errors or omissions in this Accepted Manuscript or any consequences arising from the use of any information it contains.
rsc.li/pccp
Page 1 of 27
Physical Chemistry Chemical Physics View Article Online
Published on 03 January 2018. Downloaded by California Institute of Technology on 03/01/2018 17:23:19.
Predicted Detonation Properties at the Chapman-Jouguet State for Proposed Energetic Materials (MTO and MTO3N) from Combined ReaxFF and Quantum Mechanics Reactive Dynamics Tingting Zhou,a,b Sergey V. Zybin,b William A. Goddard III,b* Tao Cheng,b Saber Naserifar,b Andres Jaramillo-Botero,b and Fenglei Huangc a
Institute of Applied Physics and Computational Mathematics, Beijing, 100094, P. R. CHINA.
b
Materials and Process Simulation Center, 139-74, California Institute of Technology, Pasadena, California, 91125, USA. E-mail:
[email protected]. c
State Key Laboratory of Explosion Science and Technology, Beijing Institute of Technology, Beijing, 100081, P. R. CHINA. Abstract: The development of new energetic materials (EMs) with improved detonation performance but low sensitivity and environmental impact is of considerable importance for applications in civilian and military fields. Often new designs are difficult to synthesize so predictions of performance in advance is most valuable. Examples include MTO (2,4,6-triamino1,3,5-triazine-1,3,5-trioxide) and MTO3N (2,4,6-trinitro-1,3,5-triazine-1,3,5-trioxide) suggested by Klapötke as candidate EMs but not yet successfully synthesized. We propose and apply to these materials a new approach, RxMD(cQM), in which ReaxFF Reactive Molecular Dynamics (RxMD) is first used to predict the reaction products and thermochemical properties at the Chapman Jouguet (CJ) state for which the system is fully reacted and at chemical equilibrium. Quantum mechanics dynamics (QMD) is then applied to refine the pressure of the ReaxFF predicted CJ state to predict a more accurate final CJ point, leading to a very practical calculation that includes accurate long range vdW interactions needed for accurate pressure. For MTO, this RxMD(cQM) method predicts a detonation pressure of PCJ = 40.5 GPa and a detonation velocity of DCJ = 8.8 km/s, while for MTO3N it predicts PCJ = 39.9 GPa and DCJ = 8.4 km/s, making them comparable to HMX (PCJ = 39.5 GPa, DCJ = 9.1 km/s) and worth synthesizing. This firstprinciples-based RxMD(cQM) methodology provides an excellent compromise between computational cost and accuracy including the formation of clusters that burn too slowly, providing a practical mean of assessing detonation performances for novel candidate EMs. This RxMD(cQM) method that links first principles atomistic molecular dynamics simulations with macroscopic properties to promote in silico design of new EMs should also be of general applicability to materials synthesis and processing. Keywords: energetic materials; CJ state, detonation; ReaxFF; quantum mechanics dynamics
1
Physical Chemistry Chemical Physics Accepted Manuscript
DOI: 10.1039/C7CP07321F
Physical Chemistry Chemical Physics
Page 2 of 27 View Article Online
DOI: 10.1039/C7CP07321F
Determining the detonation performance and sensitivity of energetic materials (EMs) under conditions of high pressure and high temperature are essential to the field of detonation science. Due to their wide applications in civil and military fields, detonation physics and chemistry have been the focus of intensive experimental and theoretical investigations for more than a century.1-3 Detonation is a shock-induced reaction wave propagating at supersonic speeds within an EM.1-3 Chapman4 and Jouguet5,6 (CJ) were first to develop a hydrodynamic theory of detonation based on the assumption of an infinitesimally thin reaction zone. Then Zel‟dovich,7 von Neumann,8 and Doering9 (ZND) extended these ideas by considering more complex structures of the detonation front, including the leading shock wave and the following extended reaction zone. The Zeldovich-von Neumann-Döring (ZND) model provides a classical description of an ideal one-dimensional detonation wave in which the detonation front is considered to be planar.13 The propagation of a shock wave in the fresh explosive is associated with a sudden increase in pressure and temperature, bringing the system to a point on the unreacted Hugoniot curve (the ZND state). Chemical reactions then start to occur, bringing the system from the ZND state to a point on the Hugoniot curve that describes a mixture of detonation products. The states in the reacting material follow the expansion pathway along the Rayleigh line down to the CJ state, where the system is presumed to be fully reacted and at chemical equilibrium. This CJ state, corresponding to the tangential point between the Rayleigh line and the Hugoniot curve, is the only point on the fully reacted Hugoniot curve that could support a stationary behavior of the reactive wave. From this point, the system expands isentropically, with a decrease in both pressure and temperature. ZND theory successfully predicts detonation velocity and physical properties at the CJ point that agree well with experiment. The determination of the Hugoniot curve and the CJ state is particularly important for providing critical properties and product kinetics to compare performance and to provide input into macro-scale continuum simulations of EMs. The processes within the detonation fronts of condensed explosives can occur on very small spatial-temporal scales (nanometer and picosecond) while producing pressures up to several tens of Gigapascal and temperatures up to several thousand Kelvin.1-3 This detonation wave consumes the explosive at velocities several times the speed of sound in the quiescent material, resulting in the ultra-fast release of chemical energy. Because these phenomena occur in the bulk of an optically impenetrable material, it is extremely difficult to accurately measure the detonation properties experimentally making it difficult to obtain an atomistic understanding of the reaction mechanisms in the hot compressed materials. These laboratory challenges have stimulated developments of theoretical models, such as vibrational perturbation theory10 and integral equation theory11-13. These approaches predict the detonation properties by minimizing the Gibbs free energy while requiring conservation of the total number of elements constituting the chemically reacting species. These analyses require accurate equations of state for the reactive mixture plus other physical parameters for the un-shocked material such as heats of formation and density.14 These requirements limit the predictive capabilities of these methods. Moreover, they do not provide information about the chemical and physical atomistic processes under the detonation condition. The spatial and temporal scales and characteristics involved in the detonation process of EMs are ideal for microscopic approaches such as Monte Carlo (MC) and reactive molecular dynamics (MD), providing insight into atomic-level phenomena. Brennan and Rice14
2
Physical Chemistry Chemical Physics Accepted Manuscript
Published on 03 January 2018. Downloaded by California Institute of Technology on 03/01/2018 17:23:19.
1. Introduction
Page 3 of 27
Physical Chemistry Chemical Physics View Article Online
demonstrated the applicability of reactive MC simulation for calculating the shock Hugoniot properties of liquid NO and liquid N2. Hervouët et al.15 calculated the Hugoniot curves for inert nitromethane as well as detonation products, and thermodynamic properties at the CJ state using reactive MC. Bourasseau et al.16,17 applied this method to calculate the thermodynamic and chemical equilibria of mixtures of detonation products on the Hugoniot curve for several usual EMs. Although reactive MC method does not require interaction potentials that simulate bond breaking or bond formation, it does require a priori the set of chemical equations driving the system to obtain the product species from the detonation in order to determine the chemical equilibrium of a system.16,17 MD simulations of chemically sustained shock waves require many-body potentials capable of simultaneously following the chemical reaction dynamics of thousands of atoms in a rapidly changing environment while including the exothermic chemical reactions proceeding along chemically reasonable reaction pathways from cold solid-state reactants to hot gas-phase products.18,19 By using reactive interaction potentials or force fields capable of describing bond breaking and bond formation within in a detonation wave, Reactive MD (RxMD) methods provide a practical approach to obtain the chemical equilibrium of the final shocked state including the Hugoniot curve and the CJ state without assuming or predefining reaction pathways and detonation products. Brenner et al.18 was first to study the shock-induced chemistry in a two-dimensional (2D) semi-infinite energetic molecular solid using RxMD with a very simplified reactive force field, obtaining results consistent with experiment and with classical continuum theory of planar detonations. Rice et al.20 determined the equation of state of an energetic crystal using MD simulations at various equilibrium conditions corresponding to the volumes and temperatures appropriate to the detonation and the CJ state. Zhakhovsky et al.19 investigated the 2D cellular as well as transverse and three-dimensional (3D) pulsating detonations in solid EMs using MD simulations. Recently, we21 developed the ReaxFF reactive molecular dynamics to CJ state (Rx2CJ) protocol to predict the CJ state for materials which we validated by predicting the CJ state and detonation products for three typical EMs (RDX, HMX, and PETN), all in good agreement with experimental results. Such demonstrations are not fully satisfactory because we knew the experimental data prior to the calculations. Much more convincing is to predict the detonation behavior prior to the experiments. This is the task we undertake here. A major challenge in the field of EMs is to develop safe and environmentally green but high energy explosives for utilization in industry and national defense.22,23 The design of new EMs that are more stable, less sensitive, and environmentally friendly while meeting or exceeding the performance of benchmark EMs such as RDX and HMX is of particular interest. Based on these goals, Klapötke et al.24 recently designed two molecules MTO (2,4,6-triamino-1,3,5-triazine1,3,5-trioxide) and MTO3N (2,4,6-trinitro-1,3,5-triazine-1,3,5-trioxide) as candidates for green high energy explosives with low sensitivity and high detonation performance. They24 used empirical method (EXPLO5) and estimated that MTO would have a density of 1.859 g/cm3 with detonation velocity of DCJ = 8.979 km/s, making it comparable to HMX (ρ = 1.89 g/cm3, DCJ = 9.11 km/s) and RDX (ρ = 1.77 g/cm3, DCJ = 8.64 km/s). Furthermore, they used empirical model and estimated the impact sensitivity (IS) of 30 J, much better than HMX (IS = 7 J) and RDX (IS = 7.5 J).24 However, successful synthesis of these two promising compounds has not yet been achieved.
3
Physical Chemistry Chemical Physics Accepted Manuscript
Published on 03 January 2018. Downloaded by California Institute of Technology on 03/01/2018 17:23:19.
DOI: 10.1039/C7CP07321F
Physical Chemistry Chemical Physics
Page 4 of 27 View Article Online
To understand the stability of MTO and MTO3N, we predicted the molecular and crystal structures using Monte Carlo methods and density functional theory (DFT) as reported previously.25 Then we studied the initial reaction mechanisms for thermal decomposition using quantum mechanics dynamics simulations.26 These simulations suggested that MTO3N would have good thermal stability while MTO would exhibit intermolecular hydrogen transfer processes that might lead to higher sensitivity.26 In this paper we predict the performance of MTO and MTO3N by using ReaxFF Reactive Molecular Dynamics (ReaxFF-RxMD) to predict the Chapman-Jouguet state of a sustaining detonation wave. Here the detonation products are predicted directly from the reactive dynamics simulation of the complex chemical reactions starting from initial reactant to the thermodynamic conditions of the CJ state, with no assumptions about composition of the products. Since ReaxFF was optimized by comparison to quantum mechanics (QM) results to describe reactions without consideration of the long range nonbond (NB) interactions, we then follow the RxMD with quantum mechanics dynamics (QMD) simulations using the PBE-D3 flavor of DFT known to accurately describe the long range NB interactions to correct the predicted CJ point and properties. This combined RxMD and QMD procedure, RxMD(cQM), requires a total of 250 ps of RxMD simulation on a system with ~2500 atoms to predict the initial CJ point followed by 250 ps of RxMD simulation and 10 ps of QMD simulation on a system with ~150 atoms to correct the CJ point from QM NB interactions. This provides a practical level of first-principles based calculations whereas a full QMD on the ~2500 atom system for 250 ps is currently enormously far from practicality. In section 2, we illustrate the usage of ReaxFF-RxMD to predict the detonation performance at CJ state and the combination of RxMD and QMD to enhance the accuracy of the ReaxFF predicted results, demonstrating that simulation based design can be done in silico. In section 3, we discuss the results. We conclude in Section 4 that the detonation performances for MTO and MTO3N are excellent, comparable to benchmark energetic material HMX, making them very promising to proceed to synthesize. 2. Methodology and simulation details 2.1 ReaxFF reactive force field The ReaxFF reactive force field27-29 adjusts the charge and bond-orders dynamically as the reactions proceed, with all parameters taken directly from QM calculations. ReaxFF provides an accurate description of bond breaking and bond formation, including a smooth transition from nonbonded to bonded systems. Thus, it is capable of describing complex reactive processes with no ad hoc assumptions about reaction products. ReaxFF-RxMD has been applied successfully to study chemical reactions for hydrocarbons,27,30 polymers,31 high explosives,28,29,32-38 and metals39-41 under various conditions. It provides accuracy at nearly the level of QM, with computational costs at nearly the level of non-reactive MD simulations. It has been applied to investigate the decomposition mechanisms and dynamical responses of EMs under extreme conditions such as shock and shear, describing the complex sequences of reactions and multiple intermediates at an atomistic-level not available experimentally or from quantum mechanics.28,29,32-38 In this paper we first use ReaxFF to predict the atomistic evolution of the chemical reactions and products as the system builds up the detonation wave to define the CJ state (standard empirical methods such as Cheetah must assume the reaction product mixture). In addition, ReaxFF caclulations36-38 can be carried out on
4
Physical Chemistry Chemical Physics Accepted Manuscript
Published on 03 January 2018. Downloaded by California Institute of Technology on 03/01/2018 17:23:19.
DOI: 10.1039/C7CP07321F
Page 5 of 27
Physical Chemistry Chemical Physics View Article Online
DOI: 10.1039/C7CP07321F
Published on 03 January 2018. Downloaded by California Institute of Technology on 03/01/2018 17:23:19.
2.2 Shock Hugoniot properties According to the classical ZND model, the thermodynamic quantities of material in an initial un-shocked state and final shocked state are related by the equations of mass, momentum, and energy conservation across the shock front as2
0 D ( D u),
(1)
P P0 0uD,
(2)
1 1 2 e PV ( D u )2 e0 PV D , (3) 0 0 2 2
where ρ is the density, D is the velocity of the detonation wave propagating through the material, u is the velocity of the products behind the detonation wave, P is the pressure, e is the specific internal energy, and V = 1/ρ is the specific volume. The term „„specific‟‟ refers to the quantity per unit mass, while the subscript „„0‟‟ refers to the quantity in the initial un-shocked state. Using Eq. (1) and Eq. (2), the Hugoniot function satisfying Eq. (3) can be written as 1 H g 0 e e0 ( P P0 )(V0 V ). 2
(4)
The detonation velocity D can then be calculated by solving Eq. (1) and Eq. (2), leading to P P0 0 D 2 (1
V ). V0
(5)
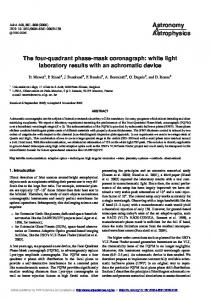
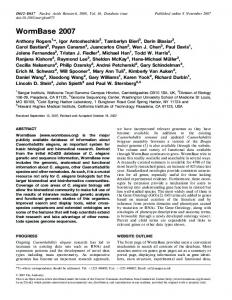
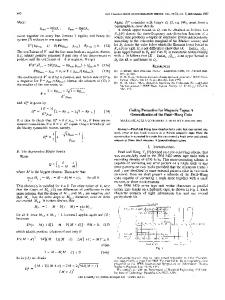
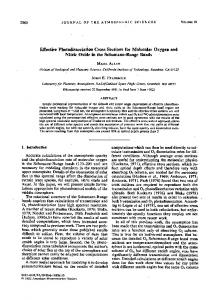
The set of parameters for which Hg = 0 determines the Hugoniot curve of shocked states in the unreacted material and the states along the Rayleigh line in the reacting material. Rayleigh line is a straight line connecting points corresponding to the initial and final states on a graph of pressure versus volume for a substance subjected to a shock wave. The CJ state is the tangent point between the fully reacted Hugoniot curve and the Rayleigh line. 2.3 The Rx2CJ protocol for using ReaxFF reactive dynamics to determine the CJ state The Rx2CJ procedure to obtain the fully reacted Hugoniot curve and the CJ state using RMD is as follows: 2.3.1 Predicting the properties of the initial un-shocked state The initial un-shocked state of MTO (MTO3N) was obtained by optimizing the predicted crystal structure at ambient condition (T = 300 K, P = 1 atm). To do this, we started with the unit cell25 predicted by the PBE-D2 flavor of DFT that includes a good description of NB interacctions and extended it by 6 × 4 × 3 (2 × 4 × 4) times in the a, b, and c directions as shown in Fig. 1, leading to 2592 (2304) atoms in the extended cell. The atoms within the structure were relaxed with energy minimization, followed by constant-volume constant-temperature molecular dynamics (NVT-MD) equilibration at T = 300 K for 10 ps. Thereafter, an isothermal-isobaric molecular dynamics (NPT-MD) simulation at 298K and 1 atm was performed for 60 ps to relax internal stresses and to obtain the equilibrated crystal structure. The properties including
5
Physical Chemistry Chemical Physics Accepted Manuscript
condensed-phase systems with millions of atoms for sufficiently long time to elucidate practical issues of hot spot formation and crack initiation.
Physical Chemistry Chemical Physics
Page 6 of 27 View Article Online
DOI: 10.1039/C7CP07321F
Fig. 1 Crystal structures of MTO (a) and MTO3N (b) from Ref. 25. The space group of the crystal is P21 for MTO and P21/C for MTO3N. The C, H, N, and O atoms are represented by gray, white, blue, and red balls, respectively.
2.3.2 Predicting the properties at the final reacted states In order to locate a single point on the Hugoniot curve for the mixture of detonation products, we performed a set of NVT-MD simulations over a range of temperatures. Typically four to six points with different densities are selected to include both Hg > 0 and Hg < 0 for each specific temperature. Thus, for each temperature we obtain a family of Hugoniot values as a function of the density. We find that ~250 picosecond MD simulation leads to a steady state in which the products are in equilibrium. This is used to determine the pressure P and the internal energy e of the final reacted states. The Hugoniot values Hg are then determined using Eq. (4). 2.3.3 Predicting the fully reacted Hugoniot curve and the CJ state At each temperature, the relation between Hg and V/V0 is fitted to a polynomial that is interpolated to find the volume compression ratio V/V0 satisfying Hg = 0. From the Hg ~ V/V0 curves at various temperatures, we find several points at Hg = 0 that determine the fully reacted Hugoniot curve. After this Hugoniot curve is obtained, the CJ state is determined as the tangential point between the Rayleigh line and the Hugoniot curve. The derivative of the pressure with respect to the volume at the CJ point along the Hugoniot curve equals the slope of the Rayleigh line. The Hugoniot curve is described by a quadratic polynomial as P a0 a1 (
V V ) a2 ( ) 2 . V0 V0
(6)
The Rayleigh line is expressed as P a(
V ) b. V0
(7)
As the shock wave evolves from the undisturbed material and the initial pressure P0 is small compared with P after shock, the Rayleigh line starts from the point at (1, 0). Therefore, the Rayleigh line can be written as
6
Physical Chemistry Chemical Physics Accepted Manuscript
Published on 03 January 2018. Downloaded by California Institute of Technology on 03/01/2018 17:23:19.
equilibrium density ρ0, specific volume V0, pressure P0, and internal energy e0 at this initial unshocked state is derived by averaging the simulated results over the last 10 ps.
Page 7 of 27
Physical Chemistry Chemical Physics View Article Online
DOI: 10.1039/C7CP07321F
V ) a. V0
(8)
Published on 03 January 2018. Downloaded by California Institute of Technology on 03/01/2018 17:23:19.
Since the Rayleigh line is tangent to the Hugoniot curve, we have a a1 2a2 (
V ). V0
(9)
Using Eq. (6), (8), and (9), we obtain the volume compression ratio at the CJ state as
VCJ a a 1 1 0 1 . V0 a2
(10)
PCJ is derived by substituting VCJ/V0 into Eq. (6). Using PCJ and VCJ/V0, the detonation velocity at the CJ state (DCJ) described in Eq. (5) is determined from
DCJ
PCJ P0 . VCJ 0 (1 ) V0
(11)
The temperature at CJ state (TCJ) is then obtained using VCJ/V0 in the functional form of the T ~ V/V0 curve. From Eq. (2), the particle velocity behind the detonation wave is expressed as u
P P0 . 0 D
(12)
At the CJ state, the relative velocity between detonation velocity and particle velocity equals the sound speed CS,1-3 leading to
CS DCJ uCJ .
(13)
We have previously compared these predicted detonation parameters at the CJ state to experimental measurements of detonation velocity and detonation pressure for known EMs to validate the Rx2CJ computational process for predicting CJ state from atomistic simulations.21 Herein we use Rx2CJ to predict the performance of EMs prior to synthesis and characterization, providing the basis for in silico design of new EMs for specific applications. All RxMD simulations in this study were performed using the ReaxFF reactive force field implemented in the Large-Scale Atomic/Molecular Massively Parallel Simulator (LAMMPS).42 A time step of 0.1 fs and periodic boundary condition were applied. We used the ReaxFF-lg form of ReaxFF, in which London dispersion is damped with the low gradient correction,29 to improve the accuracy of the predictions on crystal structure and density for EM crystals. 2.4 Quantum mechanics dynamics (QMD) simulation Because it is currently impractical to perform quantum mechanics dynamics (QMD) simulations on large systems with ~2500 of atoms for 250 picoseconds, we built a small supercell containing 8 MTO3N or 8 MTO molecules (144 atoms) and performed MD simulations for tens of picoseconds. We first compressed the system to the density at the predicted CJ state from the RxMD simulations, and then heated it from 20 K to 300 K within 2
7
Physical Chemistry Chemical Physics Accepted Manuscript
P a(
Physical Chemistry Chemical Physics
Page 8 of 27 View Article Online
Published on 03 January 2018. Downloaded by California Institute of Technology on 03/01/2018 17:23:19.
ps followed by equilibration at 300 K for 2 ps. Finally, we heated the system to the CJ temperature and equilibrated the system at the CJ state for 30 ps. Here we used the NVT ensemble with the temperature controlled by the Nose-Hoover thermostat with a time constant of 50 fs. We used a time step of 1 fs for integrating the equations of motion. We employed the VASP 5.4.4.43 ported to GPU to perform the QMD simulations. The electronic exchange-correlation interactions were treated with the generalized gradient approximation (GGA), using the Perdew–Burke–Ernzerhof (PBE)44 functional form. The London dispersion was corrected by the D3 method with Becke-Johnson damping.45 The energy cutoff for the plane wave expansion was 500 eV, which is adequate for these QMD simulations. Convergence is considered to be reached if the energy and force differences are within 10-5 eV for electronic iterations and 10-3 eV/Å for ionic relaxations, respectively. Reciprocal space was sampled with the Г-centered Monkhorst-Pack scheme using only the gamma point for the supercell MD simulations. 3 Results and discussion 3.1 Validation of the ReaxFF description for MTO and MTO3N The equilibrium lattice parameters at 298 K and 1 atm for MTO and MTO3N crystals predicted by NPT-MD simulations are summarized in Table 1 and compared with the results from DFT calculations.25 The relative errors are less than 2 %, indicating that ReaxFF provides an accurate description of the crystal structures for MTO and MTO3N. The predicted densities at 300 K are 1.898 g/cm3 for MTO and 2.067 g/cm3 for MTO3N, which are 1% to 2% smaller than DFT (since the MD is at 300 K whereas the DFT is at 0 K). These densities are comparable to that for HMX (1.91 g/cm3), suggesting that MTO and MTO3N are potential high energy materials. Table 1 The equilibrium lattice parameters for MTO and MTO3N crystals predicted by ReaxFF NPT-MD simulations at ambient condition and by DFT calculations at zero temperature MTO MTO3N Lattice parameters ReaxFF-lg DFT(PBE-D2)* ReaxFF-lg DFT(PBE-D2)a a (Å) 4.520 (0.33 %) 4.505 19.322 (0.48 %) 19.229 b (Å) 6.935 (0.33 %) 6.912 8.960 (0.48 %) 8.917 c (Å) 10.032 (0.34 %) 9.998 8.398 (0.48 %) 8.358 β (˚) 104.365 (0) 104.365 144.294 (-0.09 %) 144.417 ρ0 (g/cm3) 1.898 (-1.04 %) 1.918 2.067 (-1.76 %) 2.104 * from Ref. 25. The relative errors are shown are in parentheses.
The energy release during thermal decomposition is very important for determining the Hugoniot value. To validate the accuracy for ReaxFF, we compared the ReaxFF heats of reaction with DFT (B3LYP/6-311G**++). We find that ReaxFF-lg underestimates the reaction energies for MTO and MTO3N, probably because the parameterization did not account for the aromatic nitroxide of MTO and MTO3N. We corrected this by adding the reaction energies to the original training set (see Table S1 of the ESI) and using GARFfield46 to re-optimize the three parameters associated with lone pair and over/under coordination energy penalties for nitrogen and nitrogenoxygen bond interactions. These parameters were selected based on the chemical environments for nitrogen in MTO and MTO3N that were not present in the training set for ReaxFF-lg. The reaction energies calculated by the re-optimized force field (denoted as ReaxFFMTO) are shown in Table 2 and compared with those from ReaxFF-lg and DFT. The new ReaxFFMTO force field significantly improves the predicted reaction energies for MTO and MTO3N and is used
8
Physical Chemistry Chemical Physics Accepted Manuscript
DOI: 10.1039/C7CP07321F
Page 9 of 27
Physical Chemistry Chemical Physics View Article Online
Published on 03 January 2018. Downloaded by California Institute of Technology on 03/01/2018 17:23:19.
hereafter. We here stress that one need to check the transferability/applicability of the force field when applying it to new materials with specific structures that have not been taken into account originally. The reaction energies about the mixtures of MTO and MTO3N included in Table 2 and Table S1 provide more QM data to check the accuracy of the force field and to parameterization. Although these energies are not a must for the current study on separate molecule, using a more overall training set to optimize the force field would broaden its application, making it possible to study the mixed system using the same force field. Table 2 Reaction energies of several relevant reactions for MTO and MTO3N calculated by ReaxFFMTO, ReaxFF-lg, and DFT DFT(B3LYP/ ReaxFF-lg ReaxFFMTO Reactions 6-311G**++) (kcal/mol) (kcal/mol) (kcal/mol) MTO3N → 3CO2+3N2+1.5O2 -217.81 -356.75 -372.77 MTO3N → 3CO+3N2+3O2 27.67 -111.27 -81.46 2(MTO3N) → 5CO2+CO+6N2+3.5O2 -353.79 -631.67 -645.08 MTO → 3N2+3H2O+3C -167.87 -224.46 -180.26 MTO → 3N2+3CO+3H2 27.40 -29.16 -72.74 2MTO → 6N2+3CO2+3CH4 -151.77 -264.90 -394.88 2MTO → 6N2+3CO2+1.5C2H6+1.5H2 -162.49 -275.62 -362.81 MTO3N+MTO → 6CO2+3H2+6N2 -435.89 -631.39 -732.79 MTO3N+MTO → 4CO2+CO+C+3H2O+6N2 -447.96 -643.47 -638.17 MTO3N+2(MTO) → 4CO2+CO+4C+6H2O+9N2 -615.84 -867.93 -817.63 MTO3N+2(MTO) → 7.5CO2+1.5C+6H2+9N2 -545.88 -797.96 -775.40 2(MTO3N)+MTO → 9CO2+3H2O+9N2 -819.65 -1154.09 -1160.40 2(MTO3N+MTO) → 9CO2+3C+6H2O+12N2 -987.52 -1378.55 -1338.50 2(MTO3N)+3MTO → 9CO2+6C+9H2O+15N2 -1155.40 -1603.01 -1517.30
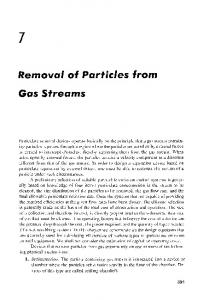
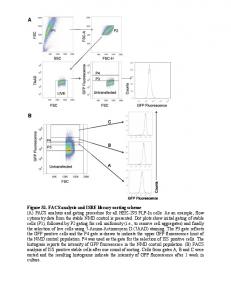
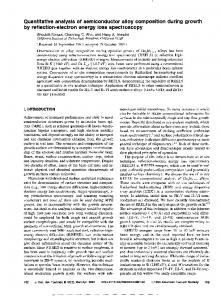
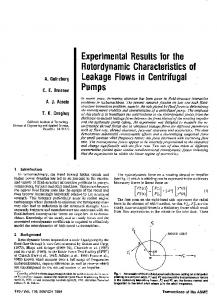
3.2 The Hugoniot curve and the CJ state To reach the equilibrium steady state of the final reacted state, we carried out 250 ps RxMD simulation for each of the 25 cases needed to determine the CJ state. Fig. 2 shows the time evolutions of energy (total energy (Etot) and potential energy (Epot)), pressure, and temperature for MTO at V/V0 = 0.65 and T = 2700 K and for MTO3N at V/V0 = 0.65 and T = 4000 K. The energy decreases exponentially during the first tens of picoseconds, due to the fast energy release from violent exothermic chemical reactions. During the next 100 ps, the energy decreases slowly to reach an equilibrium steady state, with formation of stable compositions of final products. As discussed below some carbon-oxygen-nitrogen residues (clusters) remain on this time scale. These may eventually burn off partially, but at time scales too long to play a role in determining the CJ state. The pressure and temperature reach equilibrium within the first 150 ps. Therefore, we averaged the data over the last 100 ps to obtain the properties of the reacted states. The final products also reach the equilibrium during the last 100 ps, as shown in Fig. S1 of the ESI.
9
Physical Chemistry Chemical Physics Accepted Manuscript
DOI: 10.1039/C7CP07321F
Physical Chemistry Chemical Physics
Page 10 of 27 View Article Online
DOI: 10.1039/C7CP07321F
-1300
3400
MTO V/V0 = 0.65, T = 2700 K
(a2)
MTO V/V0 = 0.65, T = 2700 K
(a3)
3200
70
3000
60
2600
-1600
2400
50
-1700
2800
2200 0
50
100
150
200
40
250
2000 0
50
100
t (ps)
150
200
250
-1300
50
100
MTO3N V/V0 = 0.65, T = 4000 K
5000
Etot Epot
MTO3N V/V0 = 0.65, T = 4000 K
(b2)
150
200
250
t (ps)
70
-1200 (b1)
0
t (ps)
MTO3N V/V0 = 0.65, T = 4000 K
(b3)
60 4500
-1500
50 T (K)
P (GPa)
-1400 4000
40
-1600
-1800
3500
30
-1700
0
50
100
150 t (ps)
200
250
20
0
50
100
150 t (ps)
200
250
3000
0
50
100
150
200
250
t (ps)
Fig. 2 Time evolution of the energy (total energy Etot and potential energy Epot), pressure, and temperature for the large super cells of MTO (a1, a2, a3) and MTO3N (b1, b2, b3). For MTO, the volume compression ratio is V/V0 = 0.65 and the temperature is T = 2700 K; for MTO3N, V/V0 = 0.65 and T = 4000 K. The energies were normalized by the number of the initial reactant molecules (144 molecules for MTO and 128 molecules for MTO3N).
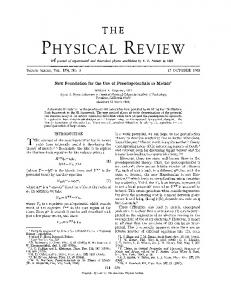
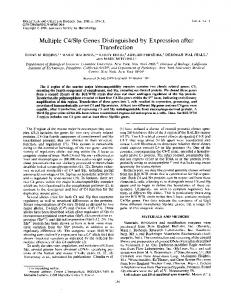
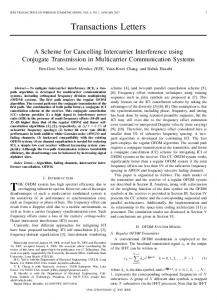
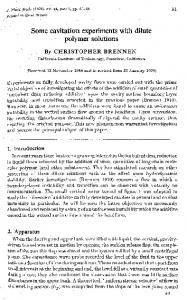
The Hugoniot value for each equilibrium reacted state was calculated by Eq. (4) and plotted in Fig. 3. For each specific temperature, the Hugoniot values at various volume compression ratios were fitted to a polynomial. The intersection of these fitted curves with the Hg = 0 line (the dashed line shown in the figure) provides the points along the Hugoniot curve for the fully reacted state. Thus, the ~25 sets of NVT decomposition studies lead to five points along the Hugoniot curve for each system. Since the temperatures for MTO is much lower than that for MTO3N to reach the Hg = 0, we were concerned that the lower temperature might not lead to sufficient decomposition of the reactant, which in turn would affect the energy release and the Hugoniot value. Therefore, we performed an additional three RMD simulations for MTO at V/V0 = 0.75, in which the system was first heated up to 4100 K (the highest temperature performed for MTO3N) and kept for 150 ps to ensure full decomposition, then it was cooled down to 2700, 2500, and 2300 K within 5 ps, respectively, and kept at these temperatures for ~ 250 ps to reach equilibration. We found that this additional heating procedure led to little change in the Hugoniot value as shown in Table S2 of the ESI and hence did not affect the the CJ results.
10
Physical Chemistry Chemical Physics Accepted Manuscript
-1500
T (K)
P (GPa)
Energy per MTO (kcal/mol)
Etot Epot
-1400
-1800
Energy per MTO3N (kcal/mol)
Published on 03 January 2018. Downloaded by California Institute of Technology on 03/01/2018 17:23:19.
80
MTO V/V0 = 0.65, T = 2700 K
(a1)
Page 11 of 27
Physical Chemistry Chemical Physics View Article Online
DOI: 10.1039/C7CP07321F
1500 2000
MTO3N
MTO
0
T=2300K T=2400K T=2500K T=2600K T=2700K
-1000
0.60
0.65
0.70
0.75
0.80
0.85
500 0 T=3700K T=3800K T=3900K T=4000K T=4100K
-500 -1000
0.90
-1500 0.55
0.60
0.65
V/V0
0.70 V/V0
0.75
0.80
0.85
Fig. 3 The relation between the Hugoniot value (Hg) and the volume compression ratio (V/V0) at five different temperatures for MTO and MTO3N. For each specific temperature, the Hugoniot values at various volume compression ratios were fitted to a polynomial. The intersections of the fitted curves with the Hg = 0 line (the dashed line) provide the points along the Hugoniot curve of the fully reacted state.
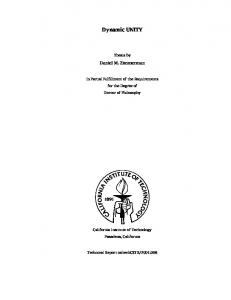
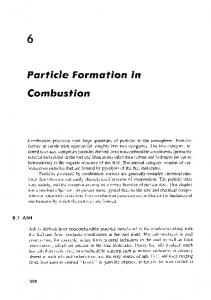
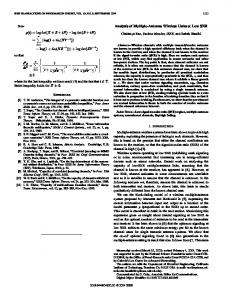
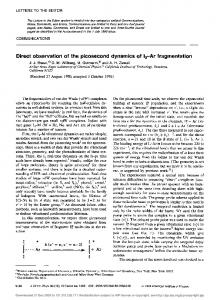
The volume compression ratios and corresponding pressures of the five points satisfying Hg = 0 are shown in Fig. 4, describing the Hugoniot curve of the fully reacted state. The quadratic polynomial describing the evolution of pressure as a function of volume was fitted to this curve. The fitted parameters were then used to obtain the CJ state according to Eq. (6) ~ (13), as discussed in Sec. 2.3. In each case there are points bracketing the CJ point to provide accurate results. The relation between temperature and volume compression ratio is also well described by a quadratic polynomial, as illustrated in Fig. 5, from which the temperature at the CJ state is derived. 60
70 60 50 40
MTO
40
CJ point
30
Rayleigh line
10
10 0 0.6
CJ point
30 20
Rayleigh line
20
MTO3N
P=a0+a1*n+a2*n*n a0=448.0 a1=-1038.88 a2=644.72 n=V/V0
50
P (GPa)
P=a0+a1*n+a2*n*n a0=1024.09 a1=-2455.90 a2=1521.75 n=V/V0
0.7
0.8 V/V0
0.9
1.0
0
0.6
0.7
0.8 V/V0
0.9
1.0
Fig. 4 The Hugoniot curve of the fully reacted state and the CJ point for MTO and MTO3N. The CJ point (represented by the red dot) is the tangent point of the Rayleigh line to the Hugoniot curve fitted to a quadratic polynomial. The volume compression ratio and the corresponding pressure at the CJ point are V/V0 = 0.756 and PCJ = 37.036 GPa for MTO and are V/V0 = 0.711 and PCJ = 35.275 GPa for MTO3N.
11
Physical Chemistry Chemical Physics Accepted Manuscript
Hugoniot value (J/g)
Hugoniot value (J/g)
1000
-2000
P (GPa)
Published on 03 January 2018. Downloaded by California Institute of Technology on 03/01/2018 17:23:19.
1000
Physical Chemistry Chemical Physics
Page 12 of 27 View Article Online
DOI: 10.1039/C7CP07321F
3000
4500
2700
4000
T (K)
T (K)
Published on 03 January 2018. Downloaded by California Institute of Technology on 03/01/2018 17:23:19.
2400 CJ point
2100
T=b0+b1*n+b2*n*n b0=24450.89 b1=-56297.14 b2=35745.35 n=V/V0
1800
1500 0.6
CJ point
3500
3000
2500 0.7
0.8 V/V0
0.9
T=b0+b1*n+b2*n*n b0=20407.70 b1=-44858.45 b2=30100.61 n=V/V0
1.0
0.6
0.7
0.8 V/V0
0.9
1.0
Fig. 5 The relation between temperature and volume compression ratio for the five points satisfying Hg = 0. These points are fitted to a quadratic polynomial to obtain the temperature at the CJ point (the red dot) of TCJ = 2318 K for MTO and TCJ = 3730 K for MTO3N.
Table 3 summarizes the detonation properties at the CJ state for MTO and MTO3N, compared with those for TATB, HMX, RDX, and PETN. For MTO, the predicted detonation velocity is DCJ = 8.958 km/s at 0 = 1.898 g/cm3, in excellent agreement with DCJ = 8.979 km/s at 0 = 1.859 g/cm3 estimated from empirical calculation using EXPLO5.24 The density (0 = 1.898 g/cm3), detonation velocity (DCJ = 8.958 km/s), detonation pressure (PCJ = 37.036 GPa), and detonation temperature (TCJ = 2318 K) for MTO are comparable to those for the benchmark explosive of HMX, indicating excellent detonation performance of this new EM. The accuracy of the empirical method is highly dependent on the assumption about the compositions of the equilibrium detonation products. Among which, whether it takes the formation of large carbon clusters into account plays an important role. Although the empirical detonation velocity of MTO agrees with the simulated one, it is difficult to make a full comparison of the results from the two methods since the detonation pressure and temperature calculated by the empirical method are unavailable. For MTO3N, the predicted DCJ = 7.685 km/s is comparable to that for TATB while the predicted PCJ = 35.375 GPa is comparable to that for HMX. Although MTO3N does not exhibit the highest DCJ and PCJ, it does show a much higher detonation temperature (TCJ = 3730 K) than other EMs considered here. Combined with the good impact sensitivity24 and thermal stability,26 MTO and MTO3N are promising new EMs. As discussed elsewhere,26 we expect MTO3N to be less sensitive than MTO. Table 3 Detonation properties at the CJ state for MTO and MTO3N, in comparisons HMX, RDX, and PETN Density DCJ PCJ TCJ Cs 3 (g/cm ) (km/s) (GPa) (K) (km/s) MTO ReaxFF 1.898 8.958 37.036 2318 6.780 (0.153) (1.414) (37) (0.073) EXPLO5a 1.859 8.979 MTO3N ReaxFF 2.067 7.685 35.275 3730 5.464 (0.165) (1.522) (63) (0.074) TATB Exp.b 1.876 7.791 31.5 Sim.c 1.895 8.411 32.6 1887 HMX ReaxFFd 1.86 8.401 32.68 2680
with those for TATB,
VCJ/V0 0.756 (0.004) 0.711 (0.004)
12
Physical Chemistry Chemical Physics Accepted Manuscript
MTO3N
MTO
Page 13 of 27
Physical Chemistry Chemical Physics View Article Online
DOI: 10.1039/C7CP07321F
Exp.b Sim.c ReaxFFd
1.767 1.80 1.72
(0.223) 9.11
(3.43) 39.5
8.266 (0.198) 8.604
28.62 (4.77) 33.79
(58) 2364 2700 (56)
7.44 (0.209) 7.975
To verify that the CJ point predicted by quadratic polynomial fitting is reliable, we performed an additional NVT-MD simulation at the CJ state (V = VCJ, T = TCJ). The predict pressure under this condition is P=36.356 GPa for MTO and is P=35.261 GPa for MTO3N, which are in good agreement with the extrapolated values. The predicted Hugoniot values are 17.10 J/g for MTO and 12.83 J/g for MTO3N, both close to zero. The energy, pressure, and temperature reach equilibrium within the timescale of these simulations as shown in Fig. S2 of the ESI. 3.3 Detonation products at the CJ state In addition to the detonation parameters, a great deal of information can be extracted from the RxMD simulations about the chemical reaction products at the CJ state and about the kinetic processes to get there. To extract product information, we carried out a bond-order based molecular fragment analysis. Our algorithm of molecular recognition in the fragment analysis uses the connectivity matrix and bond orders calculated by ReaxFF 32,33 at 0.1 ps intervals. In this analysis, the bond-order cutoff values for various atom pairs used to identify the molecular fragments in the system are tabulated in Table S3 of the ESI. Thus, any two fragments are considered as separate molecules if the bonds between them have bond orders smaller than the cutoff values. After determining the molecular fragments, the molecular recognition algorithm assigns a unique identification number to each fragment to trace the reaction pathways. MTO3N
3.0
N2 CO3 NO
CO2 NO2
O O2
2.5 2.0 1.5 1.0 0.5 0.0
0
20
40
60 t (ps)
80
100
2.5 N2 H2O HO
MTO Number of products per MTO
3.5
2.0
H3N CO2
H2N2 H
1.5
1.0
0.5
0.0
0
20
40
60
80
100
t (ps)
13
Physical Chemistry Chemical Physics Accepted Manuscript
1.891 1.90 1.76
2587 22.47 2460 (3.09) (40) Exp.b 1.67 30.6 Exp.e 1.77 33.5 2833 a from Ref. 24; b from Ref. 47; c from Ref. 48; d from Ref. 21; e from Ref. 49. The values in parentheses are errors. PETN
Number of products per MTO3N
Published on 03 January 2018. Downloaded by California Institute of Technology on 03/01/2018 17:23:19.
RDX
Exp.e Sim.c ReaxFFd
Physical Chemistry Chemical Physics
Page 14 of 27 View Article Online
DOI: 10.1039/C7CP07321F
The main detonation products over the last 100 ps RMD simulation at the CJ state are shown in Fig. 6 and the averaged values of these products are tabulated in Table 4. For MTO3N, N2 and CO2 are the dominant detonation products, followed by O and CO3. A few other molecules such as O2, NO2, and NO are also observed. We also found a few short chains containing C, N, and O with an overall composition of C2.08N2.49O5.14. This is different from TATB where lots of carbonaceous clusters are formed and from RDX, HMX, and PETN where moderate amounts are formed.21,32 This rather complete decompositions to generate small detonation products releases a great deal of energy, resulting in the high calculated detonation temperature TCJ = 3730 K for MTO3N. Carbon trioxide is not observed in the products for other EMs, but we observed a large number of CO3 for MTO3N. This is produced mainly by the reaction of carbon dioxide with atomic oxygen, which we find to be reversible, leading to a dynamical equilibrium of CO3. The reasons why MTO3N forms large amounts of CO3 may be because: (1) the composition of MTO3N molecule (C3N6O9) exhibits a high ratio of oxygen while the nitrogen atoms favor the formation of N2 without the consumption of oxygen, leaving abundant oxygen atoms available to oxidize CO2; (2) the extremely high pressure and high temperature at the CJ state (PCJ = 35.275 GPa, V/V0 = 0.711, TCJ = 3730 K) helps promote the reaction of CO2 with O.50 Indeed we found that decreasing the volume compression ratio to 20 % (V/V0 = 0.8) reduces the amount of CO3 by 24.75 %. Thus, the CO3 exists for briefly in the reaction zone and decomposes after the volume expansion. Table 4 Detonation products at the CJ state for the large cells of MTO and MTO3N MTO3N MTO (C3N6O9) (C3H6N6O3) Products (mol/mol) N2 2.60 1.63 CO2 1.73 0.20 NH3 0.99 H2O 0.32 O 1.04 CO3 1.01 H2N2 0.33 NO2 0.18 O2 0.13 H 0.13 NO 0.12 HO 0.10 C(s)a 2.24 b Carbon cluster (%) C 88.89 H 17.01 N 12.15 O 66.20 a Total number of carbons in three biggest clusters for MTO: C272H94N74O187, C30H18N13O23, and C20H7N4O20. The structures of the three clusters are shown in Fig. S3 of the ESI. b Number of atoms (% of system total) in carbonaceous clusters. For example, there are 88.89 % × 432 = 384 carbon atoms in clusters.
14
Physical Chemistry Chemical Physics Accepted Manuscript
Published on 03 January 2018. Downloaded by California Institute of Technology on 03/01/2018 17:23:19.
Fig. 6 The main detonation products over the last 100 ps MD simulation at the CJ state for the large super cells of MTO (144 molecules) and MTO3N (128 molecules). The numbers of all chemical species were normalized by the number of initial reactant molecules
Page 15 of 27
Physical Chemistry Chemical Physics View Article Online
The formation of large carbon clusters for MTO suppresses the generation of gaseous products and complete energy release, leading to a lower detonation temperature. Alternatively, it may be that the low CJ detonation temperature hinders the thorough decomposition of MTO. To verify this, we heated the system from TCJ (2318 K) to 4100 K (the highest temperature considered in this study) and performed a 250 ps NVT-MD simulation at V = VCJ and T = 4100 K. We find that instead of forming large carbon clusters, the system generates numerous small chains composed of C, H, N, and O, reducing the size of carbon clusters (the three largest ones are: C134H16N23O57, C30H3N5O16, and C27H4N6O13). Furthermore, we find smaller species such as H, HO, O, NH2, and NH formed under this condition. These results confirm that the generation of large carbon clusters at the CJ state is related to the relatively lower temperature. The products with relatively high concentrations at V = VCJ and T = 4100 K are presented in Fig. S4 of the ESI. 3.4 Verification and correction of the CJ state using Quantum Mechanics In order to verify the accuracy of the detonation properties at the CJ state predicted by ReaxFF, we carried out QMD simulations at the PBE-D3 level expected to accurately predict the van der Waals NB interactions of the gaseous species. The QMD simulations were performed on smaller systems with 144 atoms for both MTO and MTO3N for tens of picoseconds. Since the detonation temperature (T = 2318 K) for MTO predicted by ReaxFF is rather low, we first heated the system from 300 K to 4100 K within 20 ps and kept it at this temperature for 10 ps to ensure thorough decomposition. Then, the system was cooled down to the detonation temperature over a period of 5 ps and equilibrated at this temperature for 30 ps. For MTO3N, the system was heated directly to the detonation temperature (T = 3730 K) within 20 ps and then equilibrated at this temperature for 30 ps. To make a direct comparison, the same simulations on the small system were carried out using RxMD. 70 (a1)
-2300
6000 MTO_QMD
(a2)
MTO_QMD
5000
50
-2500
4000
40
T (K)
P (GPa)
-2400
2000
20
1000
10 0 0
10
20
30 40 t (ps)
50
60
3000
30
-2600
-2700
MTO_QMD
(a3)
60
0
10
20
30 40 t (ps)
50
60
0
0
10
20
30 40 t (ps)
50
60
15
Physical Chemistry Chemical Physics Accepted Manuscript
For MTO, we find that N2 and NH3 dominate the detonation products, followed by H2O and H2N2, and a few CO2, H, and HO molecules. In contrast to MTO3N, the amount of CO2 is small, and no CO3 or CO molecules are observed, even though the number of carbon atoms in each MTO3N molecule is the same as in one MTO molecule. This is because the decomposition of MTO leads to the formation of large molecular clusters dominated by carbon, resulting in carbon-poor gaseous products. These carbon clusters, such as C272H94N74O187, C30H18N13O23, and C20H7N4O20 shown in Fig. S3 of the ESI, also capture a large amount of oxygen with lesser amounts of hydrogen and nitrogen. Thus 88.89 % of the carbon atoms are in clusters as are 66.20 % of the oxygen, 17.01 % of the hydrogen, and 12.15 % of ths nitrogen, much higher than for RDX, HMX, and PETN.21 The composition and the ratios of the clusters for MTO are very similar to those for TATB,32 which may be because that the MTO and TATB molecules exhibit the same composition with a planar molecular structure.
Epot (kcal/mol)
Published on 03 January 2018. Downloaded by California Institute of Technology on 03/01/2018 17:23:19.
DOI: 10.1039/C7CP07321F
Physical Chemistry Chemical Physics
Page 16 of 27 View Article Online
DOI: 10.1039/C7CP07321F
70 (b1)
6000 MTO_RxMD
(b2)
MTO_RxMD
-1700
4000 T (K)
P (GPa)
Epot (kcal/mol)
5000
50 40
2000 1000
10 -1900
0
10
20
30 40 t (ps)
50
0
60
3000
30 20
-1800
0
10
20
30 40 t (ps)
50
0
60
0
10
20
30 40 t (ps)
50
60
Fig. 7 Time evolutions of potential energy, pressure, and temperature for MTO from QMD (a1, a2, and a3) and RxMD (b1, b2, and b3) simulations on the small cell (8 molecules). The compressed system (V/V0 = 0.756) was first heated from 300 K to 4100 K within 20 ps and kept at this temperature for 10 ps to make through decomposition. Then, the system was cooled down to the detonation temperature (2318 K) over a period of 5 ps and equilibrated at this temperature for 30 ps. -2600
6000
70 MTO3N_QMD
(a1)
(a2)
5000
50
-2700
4000 T (K)
P (GPa)
Epot (kcal/mol)
-2650
MTO3N_QMD
(a3)
MTO3N_QMD
60
40
3000
30 2000 20
-2750
1000
10 -2800
0
10
20
30
40
0
50
0 0
10
20
t (ps)
30
40
50
0
10
20
MTO3N_RxMD
(b2)
5000 4000 T (K)
P (GPa)
50
-1700
50
MTO3N_RxMD
(b3)
MTO3N_RxMD
60 -1600
40
6000
70 (b1)
30 t (ps)
t (ps)
-1500
Epot (kcal/mol)
Published on 03 January 2018. Downloaded by California Institute of Technology on 03/01/2018 17:23:19.
-1600
MTO_RxMD
(b3)
60
40
3000
30 2000 20
-1800
1000
10 -1900
0
10
20
30 t (ps)
40
50
0
0 0
10
20
30 t (ps)
40
50
0
10
20
30
40
50
t (ps)
Fig. 8 Time evolutions of potential energy, pressure, and temperature for MTO3N from QMD (a1, a2, and a3) and RxMD (b1, b2, and b3) simulations on the small cell (8 molecules). The compressed system (V/V0 = 0.711) was heated directly from 300 K to the detonation temperature (3730 K) within 20 ps and then equilibrated at this temperature for 30 ps.
Fig. 7 and Fig. 8 present the time evolutions of potential energy, pressure, and temperature for MTO and MTO3N from QMD and RxMD, showing that these properties reach equilibrium after 55 ps for MTO and after 40 ps for MTO3N. (This is verified by extended 70 ps QMD simulations as shown in Fig S5 of the ESI.) Therefore, we used the last 10 ps data to obtain the averaged values, which are collected in Table 5. In comparison with ReaxFF, QM leads to lower detonation properties for MTO but higher detonation properties for MTO3N. The detonation pressure and the corresponding detonation velocity for MTO are PCJ = 32.12 GPa and DCJ = 8.328 km/s from QMD and are PCJ = 36.364 GPa and DCJ = 8.861 km/s from RxMD. For MTO3N, the detonation pressure and the corresponding detonation velocity are PCJ = 43.334 GPa and DCJ = 8.517 km/s from QMD and are PCJ = 35.738 GPa and DCJ = 7.735 km/s
16
Physical Chemistry Chemical Physics Accepted Manuscript
-1500
Page 17 of 27
Physical Chemistry Chemical Physics View Article Online
Table 5 Detonation parameters for MTO and MTO3N predicted from pure QMD and RxMD simulations MTO (small system) MTO3N (small system) Detonation parameters QMD RxMD QMD RxMD PCJ (GPa) 32.120 36.364 43.334 35.738 (2.612) (5.856) (2.910) (6.429) DCJ (km/s) 8.328 8.861 8.517 7.735 (0.332) (0.687) (0.281) (0.699) The values in parentheses are estimated uncertainties.
Although the QMD simulations reach equilibrium after tens of picoseconds, they take much longer computational time than that for RxMD simulations on the small systems. For example, the computational time for MTO3N to finish 10 ps QMD simulation is ~120 hours using 7 CPU cores and 1 GPU, while it takes ~ 4 hours using 1 CPU core to do 10 ps RxMD simulation, a ratio of 30:1. Since the GPU doubles the computational performance, the QMD simulation requires 420 (2×7×30) more resources than RxMD. To accelerate the computational process, we recommend to first perform 250 ps RxMD simulation and then use the final equilibrated structure as the initial state to perform 10 ps additional QMD simulation. We denote this combined calculation as RxMD(cQM) to differentiate from pure QMD. The RxMD(cQM) should result in more accurate pressure than ReaxFF due to the more accurate description of nonbond interactions by QM. 70
-1500 (a1)
6000
(a2)
MTO_RxMD
(a3)
MTO_RxMD
60 50
-1700
4000 T (K)
P (GPa)
Epot (kcal/mol)
-1600
40
2000 1000
10 -1900
0 0
50
100
150
200
250
0
50
100
-2480
200
0
250
0
50
100
150
200
250
t (ps)
70
3500 MTO_CJ state_QMD following RxMD
(b2)
MTO_CJ state_QMD following RxMD
(b3)
MTO_CJ state_QMD following RxMD
60
-2500
3000 50
-2540 -2560
40
T (K)
P (GPa)
-2520
30
2500
2000
20 1500
-2580 -2600
150 t (ps)
t (ps)
(b1)
3000
30 20
-1800
MTO_RxMD
5000
10 0
2
4
6 t (ps)
8
10
0
1000 0
2
4
6 t (ps)
8
10
0
2
4
6
8
10
t (ps)
17
Physical Chemistry Chemical Physics Accepted Manuscript
from RxMD. For the reaction products at the CJ state, QMD leads to formation of larger carbon clusters with fewer gas-phase species for MTO, resulting in a lower CJ pressure. For MTO3N, the QMD leads to formation of more NO and CO2, while RxMD forms more CxNyOz (x = 1~4, y = 1~10, z = 1~9) compounds, leading to a higher pressure for QMD. The reaction product distributions predicted from QMD and RxMD at various times for MTO and MTO3N are compared in Table S4 and S5. The algorithm used to analyze the chemical reactions during QMD simulations is the same as the one for RxMD simulations.
Epot (kcal/mol)
Published on 03 January 2018. Downloaded by California Institute of Technology on 03/01/2018 17:23:19.
DOI: 10.1039/C7CP07321F
Physical Chemistry Chemical Physics
Page 18 of 27 View Article Online
-1500
6000
70
(a1)
(a2)
MTO3N_RxMD
(a3)
MTO3N_RxMD
60 50
-1700
4000 T (K)
P (GPa)
Epot (kcal/mol)
-1600
40
2000 1000
10 -1900
0
50
100
150
200
0
250
0
50
100
150
200
0
250
0
50
100
t (ps)
t (ps)
150
200
250
t (ps) 5500
70
-2560
(b2)
MTO3N_CJ state_QMD following RxMD
(b1)
3000
30 20
-1800
MTO3N_RxMD
5000
(b3)
MTO3N_CJ state_QMD following RxMD
60
5000
50
4500
40
4000
MTO3N_CJ state_QMD following RxMD
-2640
-2680
T (K)
P (GPa)
-2600
30
3500
20
3000
10
2500
-2720
-2760
0 0
2
4
6
8
10
0
t (ps)
2
4
6 t (ps)
8
10
2000
0
2
4
6
8
10
t (ps)
Fig. 10 Time evolutions of potential energy, pressure, and temperature for the small cell of MTO3N (8 molecules) during the 250 ps RxMD simulation (a1, a2, and a3) and the following 10 ps QMD simulation (b1, b2, and b3). For RxMD: the compressed system (V/V0 = 0.711) was heated directly from 300 K to the detonation temperature (3730 K) within 20 ps and then equilibrated at this temperature for 230 ps; the total simulation time is 250 ps. For QMD: the final equilibrated structure from RxMD is used as the initial state and equilibrated for 10 ps at the CJ state (V/V0 = 0.711, T = 3730 K).
Fig. 9 and 10 show the thermal properties for MTO and MTO3N during the 250 ps RxMD simulations and the following 10 ps QMD simulations. Obvious changes occur within the first 50 ps of RxMD and within the first 4 ps of QMD. To attain high accuracy, we used the last 100 ps of RxMD data and the last 4 ps of QMD data to obtain the average values, which are summarized in Table 6. We find that RxMD(cQM) leads to better agreement with the RxMD predicted detonation properties for MTO, compared to pure QMD shown in Table 5. However, for MTO3N the results from RxMD(cQM) are almost the same as those from pure QMD. Table 6 Detonation parameters for the small cells of MTO and MTO3N predicted from 250 ps RxMD simulation and the following 10 ps QMD simulation (RxMD(cQM)), in comparisons with those for large systems predicted from RxMD simulations
Detonation parameters PCJ (GPa) DCJ (km/s)
MTO Small system RxMD(cQM) RxMD 37.723 35.035 (2.382) (5.626) 9.025 8.698
Large system RxMD 7.036 (1.414) 8.958
MTO3N Small system Large system RxMD(cQM) RxMD RxMD 43.073 35.305 35.275 (2.971) (6.440) (1.522) 8.491 7.688 7.685
18
Physical Chemistry Chemical Physics Accepted Manuscript
Fig. 9 Time evolutions of potential energy, pressure, and temperature for the small cell of MTO (8 molecules) during the 250ps RxMD simulations (a1, a2, and a3) and the following 10 ps QMD simulation (b1, b2, and b3). For RxMD: the compressed system (V/V0=0.756) was first heated from 300 K to 4100 K within 20 ps and kept at this temperature for 10 ps to make through decomposition; the system was then cooled down to the detonation temperature (2318 K) over a period of 5 ps and equilibrated at this temperature for 215 ps; the total simulation time is 250 ps. For QMD: the final equilibrated structure from RxMD is used as the initial state and equilibrated for 10 ps at the CJ state (V/V0 = 0.756, T = 2318 K).
Epot (kcal/mol)
Published on 03 January 2018. Downloaded by California Institute of Technology on 03/01/2018 17:23:19.
DOI: 10.1039/C7CP07321F
Page 19 of 27
Physical Chemistry Chemical Physics View Article Online
DOI: 10.1039/C7CP07321F
(0.153)
(0.288)
(0.672)
(0.165)
Table 7 and 8 compare the products distributions at the CJ sate for MTO and MTO3N predicted from pure QMD, RxMD(cQM), and RxMD simulations. Compared to pure QMD, RxMD(cQM) leads to more gas phase products and smaller carbon clusters for MTO, which are more close to the results from RMD. This can explain why the detonation properties predicted from the RxMD(cQM) agree better with those from RxMD. But the carbon clusters predicted from RxMD(cQM) still attract more nitrogen and hydrogen atoms compared to those from RxMD (as shown in Table S6). For MTO3N, the products distributions predicted from RxMD(cQM) are more consistent with those from pure QMD. Table 7 The number of reaction products at the CJ state for the small cell of MTO predicted from pure QMD, RxMD(cQM), and RxMD simulations, in comparisons with those for large system predicted from RxMD simulation Small system Large system t = 65 ps t = 10 ps t = 250 ps t = 250 ps (following RxMD) pure-QMD RxMD RxMD(cQM) RxMD RxMD Products N2 7 12 15 15 13 /8 MTO H2O 2 4 2 3 3 NH3 1 6 4 11 8 CO2 1 2 0 2 2 HO 0 1 1 2 1 H 0 0 1 0 1 H2 0 1 0 0 0 N2H 0 0 0 0 1 N2H2 0 3 0 2 3 C2O4 0 1 0 0 0 CH3NO2 1 0 1 0 0 CH2O3 0 0 1 0 0 Clusters (%)a C 91.67 83.33 91.67 91.67 88.89 H 64.58 27.08 43.75 6.25 17.01 N 66.67 25.00 18.75 6.25 12.15 O 79.17 45.83 66.67 62.50 66.20 a Number of atoms (% of system total) in carbonaceous clusters. For example, there are 91.67 % × 24 = 22 carbon atoms in clusters. Table 8 The number of reaction products at the CJ state for the small cell of MTO3N predicted from pure QMD, RxMD(cQM), and RxMD simulations, in comparisons with those for large system predicted from RxMD simulation
Products /8 MTO3N N2 CO2 CO3 NO2
Small system t = 50 ps t = 10 ps (following RxMD) pure-QMD RxMD RxMD(cQM) 15 15 15 20 9 14 2 4 2 5 1 3
t = 250 ps
Large system t = 250 ps
RxMD 19 10 4 2
RxMD 21 13 9 1
19
Physical Chemistry Chemical Physics Accepted Manuscript
Published on 03 January 2018. Downloaded by California Institute of Technology on 03/01/2018 17:23:19.
(0.281) (0.672) The values in parentheses are errors.
Physical Chemistry Chemical Physics
Page 20 of 27 View Article Online
NO N2O O O2 N2O2 C2O4 C2O5 CO4 CNO4 C3O7 N3O2 CN2O3 N4O2 C2N2O6 CN5O6 C2O3 C4O9 CN4O4
9 2 0 0 0 0 1 0 0 0 0 0 0 0 0 0 0 0
1 1 2 0 0 1 1 1 0 1 1 0 1 1 1 0 0 0
10 1 0 1 0 0 0 0 1 0 0 1 0 0 0 1 1 0
2 0 1 2 1 1 3 1 0 0 0 0 0 0 0 0 0 1
1 1 7 1 1 1 0 0 0 0 0 0 0 0 0 0 0 0
The results predicted from RxMD for small systems are also compared to those for large systems in Table 6, 7, and 8. For both MTO and MTO3N, we find that ReaxFF leads to similar detonation performance and products distributions for both sizes, although the small systems exhibit larger errors due to larger fluctuations of pressure. The much shorter computational time for the small system compared to the large system provides an opportunity to reduce the computational cost of long time MD simulations. For example, for MTO3N it takes about 12 hours to finish 10 ps RxMD using 4 CPU cores for the large system, which is ~3 times of that for a small system using 1 CPU core. The differences in detonation parameters and products between ReaxFF and QM lead to a discrepancy in the energy release, thus the Hugoniot value at the CJ state that equals to zero from ReaxFF may not satisfy this requirement from QM. Fig. 11 shows the Hugoniot values at the CJ state from various MD simulation protocols, including the 25 points used to predict the points satisfying Hg = 0 for large systems (as shown in Fig. 3 for clarity). For both small and large systems, the Hugoniot values calculated from RxMD are close to zero, even for the short time simulations. This indicates that the thermochemical properties obtained from these small RxMD simulations satisfy Eq. (4) and the ReaxFF predicted CJ states are correct. However, the Hugoniot values calculated from QMD are much higher than zero, indicating that QM would predict a different CJ point. This may be because that the ReaxFF reactive force field was not trained to describe the physical and chemical properties of these two new EMs although we have re-optimized some parameters to improve it. Another reason is that the ReaxFF is trained to reproduce reaction energies instead of non-bond interactions, which might lead to some deviation in pressure.
20
Physical Chemistry Chemical Physics Accepted Manuscript
Published on 03 January 2018. Downloaded by California Institute of Technology on 03/01/2018 17:23:19.
DOI: 10.1039/C7CP07321F
Page 21 of 27
Physical Chemistry Chemical Physics View Article Online
DOI: 10.1039/C7CP07321F
1500
0 small_pureQMD small_RxMD-QMD small_shortRxMD small_longRxMD large_longRxMD small_QMcorrectedCJ
-1000
0.60
0.65
0.70
0.75 0.80 V/V0
0.85
500
T=3700K T=3800K T=3900K T=4000K T=4100K
0 samll_pureQMD small_RxMD-QMD small_shortRxMD small_longRxMD large_longRxMD small_QMcorrectedCJ
-500 -1000 -1500 0.55
0.90
0.60
0.65
0.70 V/V0
0.75
0.80
0.85
Fig. 11 The Hugoniot values at the CJ state obtained from various MD simulations. The 25 points used to predict the points satisfying Hg = 0 for large systems are also shown for clarity. The filled wine diamond represent the Hg obtained from RxMD simulation at the CJ state for large systems; The Hg obtained from pure QMD, RxMD(cQM), short-time RxMD, and long-time RxMD simulations for small systems are represented by open blue diamond, open orange diamond, open red diamond, and open black diamond, respectively. The Hg at the QM corrected CJ state from RxMD(cQM) simulation is represented by the open wine triangle.
To correct the CJ point using QMD, we determined a new Hugoniot curve (P-V curve). Eq. (4) suggests the increment of pressure or decrement of energy that can be realized by lowering the temperature would reduce the Hugoniot value. Based on this, we used RxMD(cQM) simulations to predict three points with Hugoniot values near zero leading to the pressures and volume compression ratios shown in Fig. 12. Fitting a quadratic polynomial to these points leads to the Hugoniot curve. The CJ point, which is the tangent point between the Rayleigh line and the Hugoniot curve, and the corresponding detonation parameters are determined according to Eq. (6) ~ (13) as described in Sec. 2.3. 70
70 60 50
MTO3N P = a0 + a1*n + a2*n*n a0 = 731.24 a1 = -1761.9 a2 = 1115.0 n = V/V0
60 50 P (GPa)
P = a0 + a1*n + a2*n*n a0 = 565.29 a1 = -1304.28 a2 = 800.13 n = V/V0
MTO
40
CJ point 30 20
40
CJ point 30 20
Rayleigh line
Rayleigh line 10 0 0.6
10 0.7
0.8 V/V0
0.9
1.0
0 0.6
0.7
0.8 V/V0
0.9
1.0
Fig. 12 The Hugoniot curve of the fully reacted state and the CJ point for the small cells of MTO and MTO3N predicted from RxMD(cQM) simulations. Table 9 The detonation parameters at the QM corrected CJ state for the small cells of MTO and MTO3N from RxMD(cQM) simulations, in comparisons with those for large systems predicted from RxMD simulations
Detonation parameters PCJ (GPa)
MTO RxMD(cQM) RxMD 40.466 37.036
MTO3N RxMD(cQM) RxMD 39.939 35.275
21
Physical Chemistry Chemical Physics Accepted Manuscript
T=2300K T=2400K T=2500K T=2600K T=2700K
Hugoniot value (J/g)
Hugoniot value (J/g)
1000
MTO3N
1000
-2000
P (GPa)
Published on 03 January 2018. Downloaded by California Institute of Technology on 03/01/2018 17:23:19.
2000
MTO
Physical Chemistry Chemical Physics
Page 22 of 27 View Article Online
Published on 03 January 2018. Downloaded by California Institute of Technology on 03/01/2018 17:23:19.
DCJ (km/s) T (K) V/V0 The values in parentheses are errors.
(2.378) 8.789 (0.255) 1982 0.724
(1.414) 8.958 (0.153) 2318 0.756
(2.769) 8.382 (0.286) 3360 0.725
(1.522) 7.685 (0.165) 3730 0.711
Table 9 collects the detonation parameters at the QM corrected CJ states for MTO and MTO3N, together with those at the ReaxFF predicted CJ states. In comparison with ReaxFF, QM gives detonation pressures for MTO and MTO3N higher by 9.26 and 13.22 %, comparable detonation velocity for MTO but higher by 9.07 % for MTO3N. For MTO, the QM corrected detonation pressure is PCJ = 40.466 GPa and the corresponding detonation velocity is DCJ = 8.789 km/s. For MTO3N, the QM corrected values are PCJ = 39.939 GPa and DCJ = 8.382 km/s. These results indicate that both new proposed EMs are very promising, showing excellent detonation performance comparable to HMX (PCJ = 39.5 GPa, DCJ = 9.11 km/s). The detonation temperatures predicted from QM are 14.50 and 9.92 % lower than those from ReaxFF for MTO and MTO3N. The detonation products for MTO and MTO3N at the QM corrected CJ state are collected in Table 10 and 11, compared to those for large systems predicted from ReaxFF. For MTO, QM leads to larger carbon clusters and fewer products in gas phase. For MTO3N, QM predicts more NO and CO2 but less N2 and CO3. The final structures with detonation products at the QM corrected CJ state for MTO and MTO3N are shown in Fig. S8 of the ESI.
22
Physical Chemistry Chemical Physics Accepted Manuscript
DOI: 10.1039/C7CP07321F
Page 23 of 27
Physical Chemistry Chemical Physics View Article Online
DOI: 10.1039/C7CP07321F
Published on 03 January 2018. Downloaded by California Institute of Technology on 03/01/2018 17:23:19.
Products /8 MTO
QM corrected CJ
ReaxFF predicted CJ
14
13
N2
H2O 2 3 NH3 4 8 CO2 0 2 HO 0 1 H 1 1 N2H2 0 3 N2H 0 1 Clusters (%)a C 100.0 88.89 H 64.58 17.01 N 33.33 12.15 O 91.67 66.20 a Number of atoms (% of system total) in carbonaceous clusters. For example, there are 88.89 % × 24 = 21 carbon atoms in cluster for MTO Table 11 The number of reaction products at the QM corrected CJ state for the small cell of MTO3N predicted from RxMD(cQM) simulation, in comparisons with those for large system predicted from RxMD simulation
Products /8 MTO3N N2 CO2 CO3 NO2 NO N2O NO3 N2O2 O O2 C2O4 CNO3 CNO4
QM corrected CJ
ReaxFF predicted CJ
15 19 3 3 11 1 0 0 0 0 0 1 1
21 13 9 1 1 1 0 1 7 1 1 0 0
Summarizing, we propose here and apply a practical methodology, RxMD(cQM), to predict the CJ state by combining ReaxFF and QM. We verify that the detonation parameters for the small system (~150 atoms) match well with those for large system, so that we can first use the small system to estimate the Hugoniot curve and predict the CJ state by long time (250 ps) RxMD simulations. Then, we equilibrate the small system at the volume and temperature of the CJ state using RxMD simulation for 250 ps, and finally we use only 10 ps QMD simulations to optimize the final structures at the CJ state and predict the equilibrium pressure. We can check the Hugoniot value of the CJ state and make corrections if necessary. This combined RxMD(cQM) simulations on small system dramatically reduces the computational cost and enhance the accuracy of the predicted results. This methodology should be useful for making practical estimations of the detonation performance for novel materials. For example, an
23
Physical Chemistry Chemical Physics Accepted Manuscript
Table 10 The number of reaction products at the QM corrected CJ state for the small cell of MTO predicted from RxMD(cQM) simulation, in comparisons with those for large system predicted from RxMD simulation
Physical Chemistry Chemical Physics
Page 24 of 27 View Article Online
estimation using 50 ps RMD and 4 ps QMD simulations would take 68 hours of computational time compared to 20 days for 40 ps pure QMD simulation. A flowchart describing the entire simulation procedure is shown in Fig. S9 of the ESI.
Published on 03 January 2018. Downloaded by California Institute of Technology on 03/01/2018 17:23:19.
4. Conclusions We illustrated how to use the ReaxFF RxMD to determine the CJ state for two potential energetic materials, MTO and MTO3N. The detonation pressure and detonation velocity at the CJ state approach to PCJ = 37.0 GPa and DCJ = 9.0 km/s for MTO, which are comparable to those for HMX. For MTO3N, the PCJ = 35.3 GPa is comparable to that for HMX and DCJ = 7.7 km/s is comparable to that for TATB. Such good detonation performances confirm the potential applicability of these two new EMs. The dominant detonation products at the CJ state are N2 and NH3 for MTO while they are N2 and CO2 for MTO3N. The decomposition of MTO leads to the formation of large carbonaceous clusters, whereas only a few small chains are generated for MTO3N. We also elucidated how to combine RxMD with QMD to verify and correct the CJ state. The Hugoniot value of the ReaxFF predicted CJ state calculated from QMD simulation indicates that QM would lead to a modified CJ state that exhibits higher detonation pressure or lower detonation temperature. We re-predicted the Hugoniot curve and CJ state by combined RxMD(cQM). This leads to PCJ = 40.5 GPa and DCJ = 8.8 km/s for MTO, and PCJ = 39.9 GPa and DCJ = 8.4 km/s for MTO3N. These results suggest that both the two new proposed EMs are very promising, showing excellent detonation performances comparable to HMX (PCJ = 39.5 GPa, DCJ = 9.1 km/s). The detonation products at the QM corrected CJ states have larger carbon clusters and less gas-phase fragments for MTO, and more NO and CO2 but less N2 and CO3 for MTO3N, compared to those at the ReaxFF predicted ones. The corrections using combined RxMD(cQM) are applied to small systems (144 atoms), since it is currently impractical to perform QMD simulations on large systems (e.g., 2500 atoms) for hundreds of picoseconds. However, we showed that there is little difference in the detonation parameters between large and small systems. Thus the combined RxMD(cQM) simulations on small systems significantly reduce the computational cost while enhancing the accuracy of the results from QM nonbond interactions. Our proposed RxMD(cQM) methodology provides a practical approach to obtain the chemical equilibrium of the final shocked state including the Hugoniot curve and the CJ state without assuming or predefining reaction pathways and detonation products. It should lead to more reliable results compared to the ones from empirical method. The accuracy of the empirical method is highly dependent on the assumption about the compositions of the equilibrium detonation products. The empirically extrapolated detonation parameters based on approximately the same family of explosives with similar detonation products might be trustful. But if there is obvious difference in the composition of products or the products are uncertain, the extrapolated results are questionable. The difference in detonation products would lead to the variations of detonation pressure, velocity, and temperature. Our method provides a practical way to link the atomistic molecular dynamics simulation and the macroscopic properties of detonation. The predicted properties at the CJ state can then provide useful input for macroscopic continuum simulations on EMs.
24
Physical Chemistry Chemical Physics Accepted Manuscript
DOI: 10.1039/C7CP07321F
Page 25 of 27
Physical Chemistry Chemical Physics View Article Online
RxMD(cQM) is not limited to some specific materials, as long as the force field can describe the material. The most concern is the accuracy of the force field, especially when applying it on new systems. But this method also uses QMD to refine the results, leading to more accurate results. We are now broadening the application of this method by applying it on other EMs, including the aromatic TATB, caged CL-20, ionic TKX-50, and new EMs. This methodology should be useful for high through design of new materials. Conflicts of interest The authors declare no conflicts of interest. Acknowledgments This work was supported by ONR (N00014-12-1-0538, Cliff Bedford program manager). It was also supported by the National Natural Science Foundation of China (Grant No. 11402031 and 11521062). We thank Thomas Klapötke, Cliff Bedford, and Al Stern for suggesting this problem. Notes † Electronic Supplementary Information (ESI) available: Additional training sets used to reoptimize the three parameters in the ReaxFF-lg force field are tabulated in Table S1. The comparison of Hugoniot values calculated from two simulation procedures are shown in Table S2. Bond order cutoff values for various atom pairs used to identify molecular fragments are summarized in Table S3. The time evolution of final products over the last 100 ps of RxMD simulations for MTO (V/V0 = 0.65, T = 2700 K) and MTO3N (V/V0 = 0.65, T = 4000 K) are shown in Fig. S1. The time evolution of energy, pressure, and temperature over the last 100 ps of RxMD simulations at the CJ state for MTO and MTO3N are plotted in Fig. S2. The final structures of the three biggest carbon clusters formed during the RxMD simulation at the CJ state for MTO are shown in Fig. S3. The time evolution of the products with relatively high concentrations during the last 100 ps RxMD simulation at V = VCJ and T = 4100 K for MTO is presented in Fig. S4. The time evolutions of potential energy, pressure, and temperature for MTO (V/V0 = 0.756, T = 2318 K) and MTO3N (V/V0 = 0.711, T = 3730 K) from the extended 70 ps QMD simulations are shown in Fig. S5. The number of reaction products at various times for MTO and MTO3N predicted from pure QMD and RxMD simulations are summarized in Table S4 and S5. The structures of carbon clusters formed at the end of RxMD, pure QMD, and RxMD(cQM) simulations for MTO are collected in Table S6. The time evolutions of potential energy, pressure, and temperature for MTO from the last 100 RxMD simulation and the following 10 ps QMD simulation at V/V0 = 0.724 and T = 1982 K are plotted in Fig. S6. The time evolutions of potential energy, pressure, and temperature for MTO3N from the last 100 ps RxMD simulation and the following 10 ps QMD simulation at V/V0 = 0.725 and T = 3360 K are shown in Fig. S7. The final structures for MTO and MTO3N at the QM corrected CJ state from RxMD(cQM) simulations are presented in Fig. S8. A flowchart describing the entire simulation procedure is shown in Fig. S9. The ReaxFF force field parameters used in this study are collected in “ffield.reax.” References 1 2
Y. B. Zel‟dovich and A. Kompaneets, Theory of Detonation, Academic Press, New York, 1960. W. Fickett and W. C. Davis, Detonation, University of California Press, Berkeley, 1979.
25
Physical Chemistry Chemical Physics Accepted Manuscript
Published on 03 January 2018. Downloaded by California Institute of Technology on 03/01/2018 17:23:19.
DOI: 10.1039/C7CP07321F
Physical Chemistry Chemical Physics
Page 26 of 27 View Article Online
3 4 5 6 7 8
9 10 11 12 13 14 15 16 17 18 19 20 21 22 23 24 25 26 27 28 29 30
J. H. S. Lee, The Detonation Phenomenon, Cambridge University Press, Cambridge, 2008. D. L. Chapman, VI. Philos. Mag., 1899, 47, 90–104. E. Jouguet, J. Math. Pures Appl., 1905, 1, 347–425. E. Jouguet, J. Math. Pures Appl., 1906, 2, 5–85. Y. B. Zeldovich, Journal of Experimental and Theoretical Physics, 1940, 10, 542–568. J. von Neumann, Theory of detonation waves, Aberdeen Proving Ground, Maryland: Office of Scientific Research and Development, Report No. 549, Ballistic Research Laboratory File No. X-122, 1942; J. von Neumann, in John von Neumann, Collected Works, 6, ed. A. J. Taub, Permagon Press, Elmsford, NY, 1963, 178–218. W. Doering, Ann. Phys., 1943, 435, 421–436. M. Ross, J. Chem. Phys., 1979, 71, 1567–1571. G. Zerah and J. P. Hansen, J. Chem. Phys., 1986, 84, 2336–2343. H. L. Vortler, I. Nezbeda and M. Lisal, Mol. Phys. 1997, 92, 813–824. L. E. Fried and W. M. Howard, J. Chem. Phys., 1998, 109, 7338–7348. J. K. Brennan and B. M. Rice. Phys. Rev. E, 2002, 66, 021105–1–11. A. Hervouët, N. Desbiens, E. Bourasseau and J.-B. Maillet, J. Phys. Chem. B, 2008, 112, 5070–5078. E. Bourasseau, V. Dubois, N. Desbiens and J.-B. Maillet, J. Chem. Phys., 2007, 127, 084513–1–11. E. Bourasseau, J.-B. Maillet, N. Desbiens and G. Stoltz, J. Phys. Chem. A, 2011, 115, 10729– 10737. D. W. Brenner, D. H. Robertson, M. L. Elert and C. T. White. Phys. Rev. Lett., 1993, 70, 2174–2177. V. V. Zhakhovsky, M. M. Budzevich, A. C. Landerville, I. I. Oleynik and C. T. White, Phys. Rev. E, 2014, 90, 033312–1–10. B. M. Rice, W. Mattson and J. Grosh, Phys. Rev. E, 1996, 53, 611–622. D. Z. Guo, S. V. Zybin, Q. An, W. A. Goddard III and F. L. Huang, Phys. Chem. Chem. Phys., 2016, 18, 2015–2022. D. M. Badgujar, M. B. Talawar, S. N. Asthana and P. P. Mahulikar, J. Hazard. Mater., 2008, 151, 289–305. M. B. Talawar, R. Sivabalan, T. Mukundan, H. Muthurajan, A. K. Sikder, B. R. Gandhe and A. S. Rao, J. Hazard. Mater., 2009, 161, 589–607. T. M. Klapötke, personal communication, 2014. S. Naserifar, S. V. Zybin, C.-C. Ye and W. A. Goddard III, J. Mater. Chem. A, 2016, 4, 1264–1276. C.-C. Ye, Q. An, T. Cheng, S. V. Zybin, S. Naserifar, X.-H. Ju and W. A. Goddard III, J. Mater. Chem. A, 2015, 3, 12044–12050. A. C. T. van Duin, S. Dasgupta, F. Lorant and W. A. Goddard III, J. Phys. Chem. A, 2001, 105, 9396–9409. A. Strachan, E. M. Kober, A. C. T. van Duin, J. Oxgaard and W. A. Goddard III, J. Chem. Phys., 2005, 122, 054502–1–10. L. C. Liu, Y. Liu, S. V. Zybin, H. Sun and W. A. Goddard III, J. Phys. Chem. A, 2011, 115, 11016–11022. K. Chenoweth, A. C. T. van Duin and W. A. Goddard III, J. Phys. Chem. A, 2008, 112, 1040–1053.
26
Physical Chemistry Chemical Physics Accepted Manuscript
Published on 03 January 2018. Downloaded by California Institute of Technology on 03/01/2018 17:23:19.
DOI: 10.1039/C7CP07321F
Page 27 of 27
Physical Chemistry Chemical Physics View Article Online
31 K. Chenoweth, S. Cheung, A. C. T. van Duin, W. A. Goddard III and E. M. Kober, J. Am. Chem. Soc., 2005, 127, 7192–7202. 32 L. Zhang, S. V. Zybin, A. C. T. van Duin, S. Dasgupta, W. A. Goddard III and E. M. Kober, J. Phys. Chem. A, 2009, 113, 10619–10640. 33 Q. An, Y. Liu, S. V. Zybin, H. Kim and W. A. Goddard III, J. Phys. Chem. C, 2012, 116, 10198–10206. 34 A. C. T. van Duin, Y. Zeiri, F. Dubnikova, R. Kosloff and W. A. Goddard III, J. Am. Chem. Soc., 2005, 127, 11053–11062. 35 T. T. Zhou, H. J. Song, Y. Liu and F. L. Huang, Phys. Chem. Chem. Phys., 2014, 16, 13914– 13931. 36 K. Nomura, R. K. Kalia, A. Nakano and P. Vashishta, Appl. Phys. Lett., 2007, 91, 183109–1– 3. 37 Q. An, W. A. Goddard III, S. V. Zybin, A. J. Botero and T. T. Zhou, J. Phys. Chem. C, 2013, 117, 26551–26561. 38 T. T. Zhou, J. F. Lou, Y. G. Zhang, H. J. Song and F. L. Huang. Phys. Chem. Chem. Phys., 2016, 18, 17627–17645. 39 K. Chenoweth and W. A. Goddard III, Angew. Chem., Int. Ed., 2009, 48, 7630–7634. 40 W. A. Goddard III, J. E. Mueller, K. Chenoweth and A. C. T. van Duin, Catal. Today, 2010, 157, 71–76. 41 W. A. Goddard III, K. Chenoweth, S. Pudar, A. C. T. van Duin and M.-J. Cheng, Top. Catal., 2008, 50, 2–18. 42 S. Plimpton, J. Comput. Phys., 1995, 117, 1–19. 43 (a) G. Kresse, J. Non-Cryst. Solids, 1995, 193, 222–229. (b) G. Kresse and J. Furthmuller, Comput. Mater. Sci., 1996, 6, 15–50. (c) G. Kresse and J. Furthmuller, Phys. Rev. B: Condens. Matter Mater. Phys., 1996, 54, 11169–11186. (d) G. Kresse and D. Joubert, Phys. Rev. B: Condens. Matter Mater. Phys., 1999, 59, 1758–1775. D. L. (e) M. Hacene, A. Anciaux-Sedrakian, X. Rozanska, D. Klahr, T. Guignon and P. Fleurat-Lessard, J. Comput. Chem., 2012, 33, 2581–2589. (f) M. Hutchinson and M. Widom, Computer Physics Communications, 2012, 183, 1422–1426. 44 J. P. Perdew, K. Burke and M. Ernzerhof, Phys. Rev. Lett. 1996, 77, 3865−3868. 45 S. Grimme, S. Ehrlich and L. Goerigk, J. Comp. Chem. 2011, 32, 1456−1465. 46 A. Jaramillo-Botero, S. Naserifar and W. A. Goddard, III. J. Chem. Theory Comput. 2014, 10, 1426−1439. 47 C. L. Mader, J. N. Johnson and S. L. Crane, LASL EXPLOSIVE PROPERTY DATA, University California Press, Berkeley-Los Angeles-London, California, 1980. 48 C. L. Mader, Numerical Modeling of Detonation, University of California Press, BerkeleyLos Angeles-London, California, 1979. 49 B. M. Dobratz and P. C. Crawford, LLNL Explosives Handbook – Properties of Chemical Explosives and Explosive Simulants, University of California, Livermore, CA, USA, 1985. 50 J. R. Sabin and H. Kim, Chem, Phys, Lett., 1971, 11, 593–597. 51 M. Suceska, EXPLO5, v. 6.02, Brodarski Institute, Zagreb, Croatia, 2013.
27
Physical Chemistry Chemical Physics Accepted Manuscript
Published on 03 January 2018. Downloaded by California Institute of Technology on 03/01/2018 17:23:19.
DOI: 10.1039/C7CP07321F