18th International Congress of Metrology, 11001 (2017)
DOI: 10.1051/ metrology/201711001
Study of Traffic Real Driving Emissions in Madrid in 2015 and conclusions Josefina de la FUENTE*, Aida DOMÍNGUEZ-SÁEZ** & Manuel PUJADAS** * OPUS REMOTE SENSING EUROPE, Madrid, 28015, Spain. Tel +34 658 579 766 / +34 91 559 28 68 - email:
[email protected] ** CIEMAT, Avda. Complutense, 40, 28040, Madrid, Spain Abstract Concerns about high levels of air pollutants, together with the observed differences between the vehicle emission running under normal operating conditions and the limits specified in the homologation tests, has encouraged to conduct in Spain a study to meet the actual emissions of the circulating vehicle fleet. For this purpose Madrid metropolitan area was selected to carry on this study, considering that the characteristics of its circulating park can be extrapolated to the rest of the country fleet. The measuring technology used was optical remote sensing that allows to measure the emissions in terms of ratios of each emitted pollutant versus CO2 in the exhaust plume. Some of the most relevant results are the high levels of NO/CO2 registered for euro 5 and euro 6 diesel vehicles, and the big differences among the emissions when they are evaluated comparing the results of brands of the Spanish fleet. Keys-words: RSD, Remote Sensing-Laboratory, traffic emissions.
Introduction The use of remote emission measurements for characterizing emissions vehicles running in real traffic conditions has grew in the last two decades. The main applications of these remote sensing techniques are: fleet monitoring emissions, inspection and maintenance programs (I/M), and detection of high emitters. Due to the most demanding application of emission standards and technological developments especially focused on after-treatment systems, it is necessary to conduct periodic reviews of the characterizations of fleet emissions. The use of remote sensing devices has been and is a quick and economical tool for the characterization of fleets operating in real traffic conditions and also allows a characterization in-situ and in a non-intrusively mode. Remote sensing equipment of emissions can be used to analyze how an expected emission reductions (conditional on the introduction of a stricter emission regulations) result in a change in the trend of emissions on the road. Its use is particularly widespread in the US as inventors and precursors of this methodology are installed there. Some of the most significant recent work has shown the collection of data acquired during a decade (Bishop and Stedman, 2008) showing among its main conclusions a significant reduction in global emissions and a high reliance on these emissions with the VSP ("Vehicle Specific Power”). Other remarkable campaigns were conducted by Kuhns et al, 2004 or Fujita et al, 2012. The results of those campaigns cannot be extrapolated to Europe because the weight of diesel vehicles in the European passenger car fleets is very higher. In Europe, remote sensing measurements of emissions have also been used for the characterization of fleets, highlighting Switzerland, Sweden and England. During 2000-2013, in a unique location in Zurich in the same season of year, emissions data they were taken using remote sensing devices (Chen and Borken-Kleefeld, 2014). In total more than 100,000 vehicles were registered, dominated by diesel vehicles, making the classification by type of emission regulations and fuel type. The main conclusion of this study emphasizes that, as other authors (Weiss et al, 2011) had indicated, new NOx emission controls are not effective in actual driving. They also indicated that it is necessary to determine the amount of primary NO2 and identify systematic differences among emissions of the different dominant brands in European fleets. Along the same lines highlight the work done by the King's College London (Carslaw et al, 2011; Carslaw et al, 2013a, Carslaw et al, 2013b). The campaign was conducted from 2007 to 2010 (7 campaigns at different points) with a total of more than 80,000 valid records, the high values of the emission of NOx/CO2 for modern vehicles (Euro 4/5) were also detected contrary to expected emissions due to stricter emissions standards. All studies emphasize that recent technologies do not adequately reduce this type of emission. These studies also found that for the post2000 vehicles (Euro 3, Euro 4 and Euro 5) diesel vehicles show a high dependence on the VSP in NOx emissions, which was not observed in previous models or other contaminants. Other campaigns have been conducted in Europe have been Sjödin and Jerksjö, 2008 in Sweden (15,000 vehicles).
© The Authors, published by EDP Sciences. This is an open access article distributed under the terms of the Creative Commons Attribution License 4.0 (http://creativecommons.org/licenses/by/4.0/). Article available at http://cfmetrologie.edpsciences.org or https://doi.org/10.1051/metrology/201711001
18th International Congress of Metrology, 11001 (2017)
DOI: 10.1051/ metrology/201711001
This work presents a part of the results of CORETRA project (Control Remoto de Emisiones de Tráfico) devoted to assess the performance of Remote Sensing Devices and also to apply this kind of technology to study the Spanish circulating fleet. This paper is specifically focused on presenting and discussing the results of the current park that mostly is formed by diesel vehicles (in a much higher proportion than those presented in the rest of the works). The measurements were developed in Madrid region and the sample is very representative of the national fleet. The work also includes a comparison of results considering the different brands.
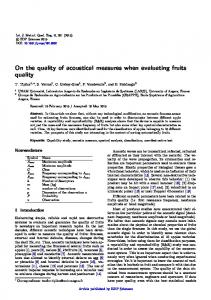
1. Methodology This on-road emission study has been based on remote measurements implemented with an AccuScanTM RSD4600 instrument. This remote sensing device allows performing emissions measurements of vehicles in real road traffic conditions by non-intrusive optical technology. The system uses two light beams, one in the ultraviolet (UV) and other one in the infrared range (IR), so that these beams crossing the street or highway on a path perpendicular to the axis of the road on which the measurements are made emissions and more or less in a path parallel to the surface. The beams are reflected in a Corner Cube Mirror (CCM) and return where a similar way to the measurement equipment where they are detected and analyzed. Emission specific concentrations of Hydrocarbon (HC), carbon oxide (CO), carbon dioxide (CO2) and nitrogen oxide (NO) in the vehicle exhaust are calculated based on the absorption of characteristic frequencies of IR/UV light. During the measurement process the system also collects information on the speed and acceleration of each vehicle registered and takes pictures of it (OCR or optical character recognition). The emissions and other related data are merged into an individual vehicle record stored in a computer housed in a roadside van. This entire process is accomplished in less than a single second. Trained operators customarily monitor and periodically audit mobile roadside units to ensure data integrity. Through the study of number plates it is possible to obtain the technical characteristics of all registered vehicles.
Figure 1. RSD configuration in the road. CCM: Corner Cube Mirror. SDM: Enclosed Source/Detector Module. S/A: Speed Acceleration The RSD 4600 equipment provides as output ratios of the concentrations of CO/CO2, NO/CO2 and HC/CO2 present in each measured plume and the manufacturer's technical information (table 1) provides the uncertainty of these data to two possible situations:
2
18th International Congress of Metrology, 11001 (2017)
DOI: 10.1051/ metrology/201711001
Table 1. Static background conditions and mean value CO2 plume (>20 and 20%-cm CO% / CO2%
+/- 0.007 or 10% of reading, whichever is greater
HC ppm /CO2%
+/- 6.6 or 10% of reading, whichever is greater
NO ppm /CO2%
+/- 10 or 10% of reading, whichever is greater CO2 plume < 20%-cm
CO% / CO2%
+/- 0.015 or 15% of reading, whichever is greater
HC ppm /CO2%
+/- 10 or 15% of reading, whichever is greater
NO ppm /CO2%
+/- 10 or 15% of reading, whichever is greater
The Quality Assurance and Quality Control protocols applied during the campaigns were based on the use of on-site calibration procedure with audited “puff” release of reference blended gas (13.6% CO2 , NO 1000 ppm, 2% CO, propane 1000ppm). The response of the instrument was periodically verified in situ every 4 hours, following the specific procedure designed by the manufacturer. The device used was the RSD 4600 and the fieldwork according to ISO 17025 methodologies was performed by RSLAB. The field work was conducted in 25 different locations around Madrid City during two experimental campaigns (2014 and 2015). The 25 locations are shown in figure 2. A total number of 191,632 vehicles were registered of which 139,450 were unique (no repetitions) and the rest were representing 73% of the total measurements. The vehicle number distributions of these vehicles in the different points are shown in figure 3.
Figure 2. Geographical locations of the 25 measurement points in Madrid region.
3
18th International Congress of Metrology, 11001 (2017)
DOI: 10.1051/ metrology/201711001
Figure 3. Vehicle number distributions in each of the 25 locations.
Diesel vehicles are a large part of the fleet (78%), while 22% represent the gasoline vehicles. It is noteworthy that the vast majority of measured vehicles (92%) were passenger cars (M1), having a small percentage (7% and 1%) of light commercial vehicles (N1-I ≤ 1305 kg, N1-II between 1305 and 1760 kg, N1-III between 1760 and 3500 kg) and heavy commercial vehicles (M2, M3, N2, N3 ≥ 3500 kg) respectively. 67% of registered vehicles during the campaigns were Euro 4 or Euro 5 and most of the registered vehicles circulated with speeds in the range 16-70 km/h. Table 2. Number of vehicles depending on European emission standard, type of fuel and vehicle category.
Figure 4. Vehicle distribution depending on fuel, vehicle category, and European emission standard.
4
18th International Congress of Metrology, 11001 (2017)
DOI: 10.1051/ metrology/201711001
2. Results The average values of the emission ratios of all registered vehicles are shown in table 3. In Figure 5 are shown the mean ratio emission for M1 category versus the European emission standard. The general trend is that average vehicle emissions have been reduced with the application of each newer European emission standards, although some exceptions have been observed. In the case of CO, Heavy commercial vehicles (M2, M3, N2 and N3) exceed the limit established from Euro 3. In the case of HC, the average emissions are above a certain level, however, for vehicles belonging to the Euro 5 and 6 Standards, the emission ratios are below. NO is a separate case. In general, since before the existence of any Euro standard to the current standard the NOx has been consecutively reduced, but it should be stressed that the actual emission levels are well above those thresholds, except for some gasoline vehicle group. In the case of M1 diesel vehicles, the behavior of NO/CO2 average ratios for modern cars is very similar to pre-Euro models.
Figure 5. European limit vs mean ratio of CO/CO2, HC/CO2 and NO/CO2 obtained in real traffic conditions. For calculating the European emission limit ratio, the limit value of this legislation for each pollutant, by the average CO2 emitted in the NEDC cycle for this legislation has been used. Converting all values to volume concentrations.
5
6
PRE EURO EURO 1 Limit EURO 2 Limit EURO 3 Limit EURO 4 Limit EURO 5 Limit EURO 6 Limit
GAS
PRE EURO EURO 1 Limit EURO 2 Limit EURO 3 Limit EURO 4 Limit EURO 5 Limit EURO 6 Limit
DIESEL
70,11
35,18 5,31 13,57 * 4,76 5,29 0,54 2,61 0,16 2,61 2,06 2,61
0,1562
0,0714 0,0250 0,0314 * 0,0133 0,0210 0,0067 0,0090 0,0041 0,0090 0,0020 0,0090
2
9,14 5,95 6,85 5,86 3,82 1,75 1,67 1,45