Manufacturing Rev. 2015, 2, 17 Ó P. Sen, Published by EDP Sciences, 2015 DOI: 10.1051/mfreview/2015021 Available online at: http://mfr.edp-open.org
OPEN
RESEARCH ARTICLE
ACCESS
Identification of environmental bottleneck using Bayesian Networks: a case study of an Indian pig iron manufacturing organization Parag Sen* Department of Chemical Engineering, National Institute of Technology, Durgapur 713209, West Bengal Received 17 March 2015 / Accepted 22 August 2015 Abstract – Environmentally conscious manufacturing has become a global attention for the iron and steel manufacturers to prevent global warming and climate change while making money. Iron and steel sector is considered as one of the most polluting sectors in the world. It is also one of the most energy intensive industries. During pig iron manufacturing, there is a number of steps that affect the environment emitting different pollutants. While some step(s) may be considered critical to damage the environment among all the steps, some pollutant(s) may be considered critical to affect the environment among all the pollutants. This paper proposes environmental bottleneck to consider critical step and critical pollutant simultaneously. Unless environmental bottleneck is improved, environmental performance of the entire manufacturing process may not improve significantly even if other processes (i.e. other than environmental bottleneck) are taken care of. Thus, environmental bottleneck must be taken care of properly by the manufacturing organization to enable environmentally conscious manufacturing. Hence, a method should be developed to identify environmental bottleneck. Current research work uses Bayesian Networks (BN) to identify environmental bottleneck. The contribution of the paper is to identify the environmental bottleneck for an Indian pig iron manufacturing organization. Results suggest that carbon monoxide (CO) emission from the blast furnace is the environmental bottleneck for the current pig iron manufacturing organization. Hence, proper precautions should be considered to control the CO emission from the blast furnace. Key words: Environmental conscious manufacturing, Pig iron manufacturing, Environmental bottleneck, Bayesian Networks
1. Introduction Iron is one of the most important raw materials in the modern world [1]. However, iron and steel sector produces a huge amount of greenhouse gases (GHG) all over the world every year leading to global warming and climate change. Approach of continuous improvement in the iron manufacturing process may decrease the environmental impacts. Hence, environmentally conscious manufacturing has been the focus of considerable attention for the iron and steel manufacturers to protect the natural environment [2–4]. There also may be a number of good reasons to get involved in taking action on this matter like to reduce production cost [5]. Global and domestic environmental regulations are forcing many sectors including iron and steel sector to produce environmentally friendly [6–8]. There are a number of routes for pig iron production. Though pig iron can be produced directly reducing the iron ore, however in majority of cases pig iron is produced through *e-mail:
[email protected]
the blast furnace route in India. Indian pig iron manufacturing organizations are continuously focusing to decrease the environmental impacts [9, 10]. Typical foundry grade pig iron is carbon enriched with other constituents. It is brittle in nature and the weight may vary from 3 to 5 kg [11, 12]. Pig iron starts with three basic raw materials; namely iron ore, limestone and coking coal. First, the coking coal is heated in the coke oven to produce coke. Simultaneously, iron ore, limestone and coke breeze are granulated, mixed and preheated in a sinter plant to form sinter (porous material). In palletizing plant, iron ores are palletized in order to feed the blast furnace. In blast furnace oxygen is combusted with coke to form carbon monoxide (CO) releasing heat. CO reduces iron ore to liquid pig iron (hot metal) [11–13]. Coke making, sintering, palletizing and iron making (i.e. blast furnace melting) processes emit different major pollutants like carbon dioxide (CO2), carbon monoxide (CO), sulphur oxides (SOx) and nitrogen oxides (NOx) [14]. Considering a time horizon of 20 years, while CO2 has a global warming potential (GWP) of one, CO may have a GWP of 7.
This is an Open Access article distributed under the terms of the Creative Commons Attribution License (http://creativecommons.org/licenses/by/4.0), which permits unrestricted use, distribution, and reproduction in any medium, provided the original work is properly cited.
2
P. Sen: Manufacturing Rev. 2015, 2, 17 Methodology
Sources/Tools/Techniques
Selection of the Objective(s)
Literature Review, Observation of the Manufacturing System
Identification of the Variables responsible for Environmental Bottleneck Experts’ Opinion and Literature Review
Classification of the Nodes (State/Decision/Utility wise and Parent/Child wise) Experts’ Opinion, Observation of the Manufacturing System
Building Bayesian Structure by Creating Arcs between Nodes Experts’ Opinion, Observation of the Database
Feeding Conditional Probability Table (CPT) to Bayesian Networks (BN) Model Results of the Bayesian Model (combining different combinations)
Identification of Environmental Bottleneck Figure 1. Methodological framework for identification of environmental bottleneck of an Indian pig iron manufacturing organization. Table 1. CPT for node GWP. PLT
MPS
PLT C NC
GWP
OHAP
EIN
EI
Figure 2. Bayesian Networks to identify environmental bottleneck.
CO indirectly helps to increase the amount of methane (CH4) which is a GHG. Recent studies indicate that SOx and NOx also may lead to increase the temperature of the globe [15, 16].
CO 1 0
CO2 1 0
SOx 1 0
NOx 1 0
Some GHGs not only increase the temperature of the earth, but also may affect the local environment and occupational health. For example, CO, SOx and NOx may cause respiratory problems and lung diseases [17]. Prolonged exposure of SOx and NOx may cause violent coughing and difficulty in breathing [17, 18]. High concentration of CO exposure in blast furnace may significantly increase the carboxyhaemoglobin (COHb) level of the blast furnace workers [19]. Freeman discusses in detail about the causes behind CO accidents. He also shows the conditions of human health for different COHb concentration level in the blood [20]. To enable environmentally conscious manufacturing, environmental bottleneck must be identified. Environmental bottleneck is a relatively new concept which may be defined as an entity in a particular manufacturing process which considers critical step (of the entire manufacturing process) and critical pollutant simultaneously. Unless environmental bottleneck is
3
P. Sen: Manufacturing Rev. 2015, 2, 17 Table 2. CPT for node OHAP. PLT MPS H M L
CO BF 0.9 0.1 0
SP 1 0 0
PP 0 0 1
SOx
CO2 COP 0.1 0.8 0.1
BF 0.2 0.8 0
SP 0 0.1 0.9
PP 0 0.1 0.9
COP 0.2 0.8 0
Table 3. CPT for node EIN. MPS C NC
BF 1 0
SP 0 1
PP 0 1
COP 0 1
improved, environmental performance of the entire manufacturing process may not improve significantly even if other processes (i.e. other than environmental bottleneck) are taken care of. Environmental bottleneck also includes occupational environment to incorporate total health affecting potential of the pollutants. A proper method is required to identify the environmental bottleneck for a particular manufacturing. In this paper Bayesian networks are used to identify the environmental bottleneck because of its ability and flexibility in limited knowledge environment. Environmental bottleneck also depends on the average amount of generation of the pollutants which may be termed as average generation percentage (AGP). There may be different corrective measures for each step of pig iron manufacturing in different manufacturing units (MU) (i.e. coke making plant, sintering plant, palletizing plant and blast furnace). These measures should be taken into account while identifying the environmental bottleneck because these corrective measures decrease the possibility of being environmental bottleneck for the concerned consideration (i.e. combination of a particular manufacturing step/unit and pollutant). Information about rest of the paper is organized as follows. Literature review is discussed in Section 2. Study methods and data collection are provided in Section 3. Results are discussed in Section 4 and the conclusion is provided in Section 5.
2. Literature review Several researchers proposed different modelling and optimization techniques to improve the process of pig iron manufacturing. These modelling and optimization techniques essentially focused to improve the process efficiency and the quality of pig iron. In particular, artificial intelligence was widely used to predict different parameters related to pig iron manufacturing. Tunckaya and Koklukaya predicted blast furnace flame temperature using artificial intelligence and statistical methods [21]. Kumar et al. suggested a model to predict blast furnace hot metal temperature through neural network [22]. Angstenberger showed the application of fuzzy clustering and neural networks to classify temperature profiles and to build a model of the interdependence between process operation parameters and the resulting temperature profiles [23]. Bag considered artificial neural network (ANN) and used feed
BF 0 0.2 0.8
SP 0.9 0.1 0
PP 0 0.1 0.9
NOx COP 0.1 0.8 0.1
BF 0 0.2 0.8
SP 0.1 0.9 0
PP 0 0.1 0.9
COP 0.2 0.7 0.1
forward neural network (FFNN) to predict the process parameters of blast furnace [13]. Langer and Vogel suggested a hybrid modeling method combined with a suitable classification of process characteristics to ensure a widespread model synthesis for quality prediction in sintering plant [24]. Worrell et al. discussed about energy efficiency and CO2 emissions reduction opportunities in the US iron and steel sector [25]. Several reports highlighted the essence to control energy consumption and GHG emission during iron and steel production [26–28]. Cavaliere and Perrone optimized blast furnace productivity coupled with CO2 emissions reduction [9]. Ion et al. predicted the generation of the pollutants in natural gas and residual steel gases (i.e. blast furnace and coke oven gases) [29]. Korshikov et al. discussed the importance to control energy expenditure and CO2 emissions in the blast furnace [30]. While Miyakawa et al. stated the importance to control SOx emission, Wang et al. focused on the importance of NOx removal [31, 32]. CO emission control was also highlighted by the researchers and practitioners and was addressed in several reports [19, 20, 33]. Xiang et al. developed the strategy to remove multi-pollutants simultaneously from flue gas [34]. Control of GHG emission helps to protect the natural environment, to prevent global warming and climate change. GHG emission reduction also indirectly may help pig iron manufacturing organizations to make money [33, 34]. Though several researchers have considered different mathematical modelling in case of pig iron manufacturing, however environmental bottleneck has never been highlighted by any of the researchers which may be considered as the main aim of this paper. This research work uses Bayesian networks to identify environmental bottleneck for an Indian pig iron manufacturing organization because it has the ability of structured guidance for efficient reasoning even in case of incomplete knowledge [35]. Bayesian networks may be used for root cause analysis in the uncertain environment as have been highlighted by several researchers. Bayesian networks link variables with probabilities to calculate posterior probabilities of outcome states supporting an efficient evidence propagation mechanism [36, 37]. Bayesian inference has been quite successful for ecological research and environmental decision making because it has the potentiality to handle multi-criteria and multi-attribute decision problems [38]. Zhu and Deshmukh apply Bayesian decision networks to environment friendly design [39]. Pérez-Miñana et al. consider Bayesian networks for the management of GHG emissions in the British agricultural sector [40]. Webster and McLaughlin apply Bayesian belief network to assess GHG production and climate feedback [41]. Bayesian networks have also been used for more specific cases of selection and decision support systems [42, 43].
4
P. Sen: Manufacturing Rev. 2015, 2, 17
Table 4. CPT for node EI. GWp
C
OHAP EIN H M L
H C 1 0 0
NC
M NC 0.85 0.15 0
C 0.8 0.2 0
L NC 0.3 0.7 0
C 0.75 0.2 0.05
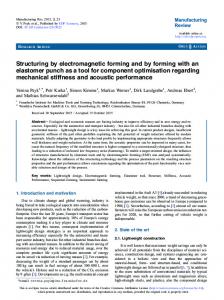
Figure 3. Results of EI for combination CO-BF.
Kelly and Kolstad illustrate the importance of Bayesian learning to control pollution and environmental problems [44]. Wang uses Bayesian networks to predict the blast furnace silicon content in hot metal [45]. Zheldak et al. develop a knowledge-based intellectual system using Bayesian network for deoxidation of steel [46]. Leicester et al. apply Bayesian network to evaluate the social, economic and environmental impacts of community deployed renewable energy [47]. But Bayesian networks have not been highlighted for a particular manufacturing organization to identify a special entity like environmental bottleneck under considerations. Hence, the objective of this paper is to identify environmental bottleneck for a particular pig iron manufacturing organization using Bayesian networks under considerations. Identification of environmental bottleneck may help the pig iron manufacturing organization to develop future strategies ensuring which particular area is needed to be improved.
3. Study methodology and data collection Based on the existing gap, this section proposes study methodology to enable Bayesian networks (BN) including data collection. BNs are directed acrylic graphs (DAG) associated with joint probability distributions (JPD). In BN, directed cycles are not allowed. Basically it integrates the principles of graph theory and probability theory to provide a normative framework for documenting cause and effect relationships considering ‘‘if-then’’ statements. Different attributes make BN
H NC 0 0.2 0.8
C 0.7 0.3 0
M NC 0.7 0.2 0.1
C 0.1 0.8 0.1
L NC 0 0.3 0.7
C 0 0.2 0.8
NC 0 0 1
ideal for modelling and assessing several aspects of environmental management. A key benefit of BN is that the probabilities can be easily modified as knowledge is improved. Whenever new information becomes available, changes made in one area of the model may propagate throughout the rest of the model (from input to output and vice-versa) and may lead to affect the model outcomes. BN have the advantages over other similar methods like Monte Carlo simulation is that the whole set of variables is represented as DAG, making it a suitable tool for complexity reduction [35, 48]. The uncertainties related to environmental bottleneck may be conceptualized by the data. For example, the uncertainty (overall mean and variation) involved in pollutant emission may be addressed by analyzing the historical data. Moreover, the decision makers’subjective judgments must be incorporated during the analysis. For this reason, Bayesian network is chosen for the current analysis as it has the potentiality to accept limited information or knowledge. This study methodology consists of the following steps to describe the problem definition, model inference and model validation (see Figure 1 [49]): Step 1: The first step is to identify the variables responsible for the environmental bottleneck. The random variables indicate different nodes and the nodes may be categorized as state nodes, decision nodes and utility nodes. State nodes represent different states each with certain probability. Decision nodes represent sets of distinct management alternatives. Utility nodes allow valuating the states defined by the modality combinations of its parents. These nodes also may be classified as parent nodes and child nodes. Parent nodes (variables with no external influence and values set by user) provide information to selective child nodes (variables whose values are conditional upon the values of its parent nodes). In other words, for each possible configuration of the parent values, a probability is provided for each state of the child [50]. Step 2: The second step deals with determining the structure of the model by building relations among the selected criteria/variables. The arcs between the nodes represent the interdependence causal relations. The causality is defined according to a certain probability of occurrence. As mentioned earlier, an arc from variable x to y represents that x is a direct cause of y. Using standard terminology in graph theory, it may be stated as x is the parent of y and y is the child of x. A directed path from x to z through y represents that y shields all the causal influence of x to z (i.e. z and x are conditionally independent given y). If neither x nor y has any parent, the two variables are marginally independent (i.e. not relevant to each other) [39].
5
P. Sen: Manufacturing Rev. 2015, 2, 17 Table 5. Probability results for target node EI. CO H M L
BF 0.98 0.02 0
SP 0.85 0.15 0
SOx
CO2 PP 0 0.2 0.8
COP 0.325 0.595 0.08
BF 0.84 0.16 0
SP 0.03 0.16 0
PP 0.03 0.25 0.72
COP 0.41 0.59 0
Step 3: The third step is to feed the data as conditional probability table (CPT) into the BN. CPTs define the probabilistic relationship between variables in the BN and these can be inferred from a variety of information sources, including observed data and experts’ judgments. Variables connected through Bayes’ rule may update the nodes of BN as P(x|y) = P(x,y)/P(y), where x indicates a state of a target variable and y indicates evidence of a parent node to describe P(x|y) (i.e. probability of x given y) [48]. In BN, JPDs over a large set of variables can be compactly specified by a reduced number of variables. It is to be noted that for feeding the data as CPT into the model of BN, discretization of the continuous variables may be required. This may be considered as a weakness of BN which may be handled through the application of dynamic discretization. Dynamic discretization is a computational mechanism that approximates the distribution of a continuous variable x by finding an optimal discrete set of intervals in the range of x, and also the optimal values for x’s discretized probability density function [40]. However, uncertainty associated with the formulation of the model will not be explicitly accounted for in the BN. Hence, results generated by the model for conditions outside of the model calibration and validation data range may add unreliability to the model. Large amounts of data may be required to calibrate a deterministic model. Thus, in this case, it may be more appropriate to find out probability distributions directly from the data [49]. Step 4: The fourth step is to select the decision under considerations. All the possible decision combinations may be checked to select the best scenario (outcome). Finally, a sensitivity analysis may be performed for model validation due to the uncertainties associated with the BN model [49].
4. Case study For the present case study, GeNIe 2.0 software is used because this is a user-friendly software to perform BN. First, three experts’ (chief production manager, chief environmental manager and chief energy manager) are chosen for the current study who have over 15 years of industrial experience in the area of pig iron manufacturing. The manufacturing process is analyzed precisely to identify the variables which may be responsible to identify environmental bottleneck for the pig iron manufacturing organization. A total of six variables are selected, namely (i) pollutants (PLT), (ii) manufacturing plants/sections (MPS), (iii) global warming potential of the pollutants (GWP), (iv) occupational health affecting potential of the pollutants (OHAP), (v) energy intense nature (EIN)
BF 0.02 0.32 0.66
SP 0.63 0.21 0.16
PP 0 0.03 0.97
NOx COP 0.07 0.26 0.67
BF 0.02 0.32 0.66
SP 0.07 0.29 0.64
PP 0 0.03 0.97
COP 0.14 0.25 0.61
and (vi) environmental impact (EI). Among these variables, the first two variables are decision variables because condition of these two variables will be used to detect the environmental bottleneck. Third, fourth and fifth variables may be considered as utility variables as they are utilized to determine the condition of the state variable ‘‘environmental impact’’. For the present study four pollutants are considered, namely carbon monoxide (CO), carbon dioxide (CO2), sulpher oxide (SOx) and nitrogen oxide (NOx). Regarding manufacturing plants/sections, namely coke oven plant (COP), palletizing plant (PP), sintering plant (SP) and blast furnace (BF), are considered. As per the opinion of the experts whereas GWP and EIN are discretized as ‘‘critical’’ and ‘‘not critical’’, OHAP and EI are discretized as ‘‘high’’, ‘‘moderate’’ and ‘‘low’’. This factor depends on the severity and average generation percentage of the pollutants in the manufacturing plants/sections. For example, though BF produces CO at an average of only 4%, however it is larger than COP and PP (2% and 1% respectively). Moreover, the severity of CO on health is very high. Hence, OHAP of CO on blast furnace is high. OHAP of CO is also high in case of sintering plant. Again, OHAP of SOx in sintering plant is high though the severity of SOx on health is not as high as CO, because SP produces SOx at an average of 67%, which is quite high compared to COP, PP and BF (23%, 2% and 6% respectively). Regarding the variable EIN, BF melting process is the only energy intensive process in the entire pig iron manufacturing. After identifying and getting the data of the variables, they can be fed to the BN model However, before that the BN model must be structured considering the variables to build up the interdependence causal relationships. In this case, PLT and MPS are the parent nodes. Whereas GWP is the child node of PLT, EIN is the child node of MPS. OHAP is the child node of both the parent nodes (i.e. PLT and MPS). GWP, OHAP and EIN have the child node EI. The structure of the proposed BN model is shown in Figure 2. Rectangles are used for decision variables, diamond shapes are used for utility variables and oval is used to represent state variable. Data (see Tables 1–4) is fed in the form of CPT for each node as per experts’ opinion.
5. Results and discussion In the present study, the target node is EI. For each possible scenario (i.e. combination) of the PLT and MPS, the value of EI is noticed. It is found that for CO-BF combination the probability of EI being high is the highest (98%), followed by the combinations for CO-SP and CO2-BF. The probability of CO-BF combination to be moderate is only 2% (see Figure 3). Hence, carbon monoxide emission from the blast furnace is the
6
P. Sen: Manufacturing Rev. 2015, 2, 17
most important criteria to be considered in order to minimize the environmental impacts. Management should take necessary steps to reduce the carbon monoxide emission from the blast furnace in this manufacturing plant. Though carbon monoxide emission from the sintering plant and carbon dioxide emission from the blast furnace also need to take care of, however their relative importance is low. It is also noticed that for CO-COP combination (i.e. carbon monoxide emission from the coke oven plant), the probability of EI being moderate is the highest, followed by the combinations for CO2-COP, SOx-BF and NOx-BF. The highest probability of EI being low is for the combinations SOx-PP (i.e. sulphur oxides emission from palletizing plant) and NOx-PP (nitrogen oxides emission from palletizing plant), which is followed by the combinations for CO2-PP and SOx-COP (see Table 5).
6.
7. 8.
9.
10.
6. Conclusions In this paper, an attempt has been made to identify a new concept of environmental bottleneck for an Indian pig iron manufacturing organization using Bayesian networks. In this study, environmental bottleneck is considered taking into account critical pollutant and critical operational step (that has the most environmental impacts) simultaneously. From the Bayesian analysis, it is observed that the carbon monoxide emission from the blast furnace may be considered as the environmental bottleneck for the present pig iron manufacturing organization, because it may have the highest environmental impacts. The results obtained from the study have direct managerial implications. It is suggested that the management should take proper initiatives to control the carbon monoxide emission from the blast furnace to minimize the environmental impacts. This study is also useful for the research scholars who work on the area of environmental management, because this paper proposes a new concept of environmental bottleneck. Finally, this is to be concluded that this research work helps the pig iron manufacturing organization to develop their environmental strategy taking precautions properly to control the environmental impacts.
References 1. L. Wang, D. Wang, J. Zhu, X. Zhao, A new model based on improved ACA and BP to predict Silicon content in hot metal, Computer Modeling and Simulation ICCMS ‘10 (2010) 364–368. 2. P. Bennett, T. Fukushima, Impact of PCI coal quality on blast furnace operations. CoalTech Pty Ltd, F-TeCon Pty Ltd. www.coaltech.com.au/LinkedDocuments/Bennett_Fukushima. pdf (accessed on dated 25th June, 2014). 3. M. Kundak, L. Lazic, J. Crnko, CO2 Emissions in the steel industry, Metalurgija 48 (2009) 193–197. 4. D.T. Allen, D.R. Shonnard, Sustainability in chemical engineering education: identifying a core body of knowledge, American Institute of Chemical Engineers (AlChE) Journal. https://workspace.imperial.ac.uk/ceFluidMechanics/Public/ 13877_fta.pdf (accessed on dated 29th May, 2014). 5. A. Swain, Climate Change Connection, Winnipeg, Manitoba, Canada 1 (July 2006) http://www.climatechangeconnection.
11.
12. 13. 14.
15.
16.
17.
18.
19.
20.
21.
org/resources/documents/business_guide.pdf (accessed on 5th May, 2014). A.D. Jayal, F. Badurdeen, O.W. Dillon Jr., I.S. Jawahir, Sustainable manufacturing: modeling and optimization challenges at the product, process and system levels, CIRP Journal of Manufacturing Science and Technology 2 (2010) 144–152. J. Sarkis, Manufacturing strategy and environmental consciousness, Technovation 15 (1995) 79–97. B. Bieda, Life cycle inventory processes of the Mittal Steel Poland (MSP) S.A. in Krakow, Poland – blast furnace pig iron production – a case study, International Journal of Life Cycle Assessment 17 (2012) 787–794. P. Cavaliere, A. Perrone, Optimization of blast furnace productivity coupled with CO2 emissions reduction, Journal of Iron and Steel Research, International 85 (2014) 89–98. S.S. Krishnan, V. Vunnam, P.S. Sunder, J.V. Sunil, A.M. Ramakrishnan, A study of energy efficiency in the Indian iron and steel industry and steel industry, Center for Study of Science, Technology and Policy Bangalore, India (December, 2013). http://www.cstep.in/sites/default/files/CSTEP%20%20A% 20Study%20of%20Energy%20Efficiency%20in%20the% 20Indian%20IS%20Industry.pdf (accessed on dated 26th June, 2014). J.A. Burgo, Chapter 10, The Manufacture of Pig Iron in the Blast Furnace, U.S. Steel Technical Center. www.jpkc.lut.cn/ upload/20120523/20120523181024445.pdf (accessed on dated 24th July, 2014). Chapter 6, Iron and Steel Vision – Vision 2020, www.ibm. nic.in/ch6.pdf (accessed on dated 14th July, 2014). S.K. Bag, ANN based prediction of blast furnace parameters, Journal – The Institution of Engineers 68 (2007) 37–42. D.L. Doushanov, Control of pollution in the iron and steel industry, Pollution Control Technologies vol. 3. www.eolss.net/ sample-chapters/c09/e4-14-04-04.pdf (accessed on dated 26th June, 2014). J.S. Fuglestvedt, I.S.A. Isaken, W.C. Wang, Direct and indirect global warming potential of source gases, Report 1 (1994) www.cicero.uio.no/media/66.pdf (accessed on dated 15th June, 2014). J.M. Reilly, K.R. Richards, Climate change damage and the trace gas index issue, Environmental and Resource Economics 3 (1993) 41–61. S.M. Bernard, J.M. Samet, A. Grambsch, K.L. Ebi, I. Romieu, The potential impacts of climate variability and change on air pollution-related health effects in the United States, Environmental Health Perspectives 109 (2001) 199–209. C. Baukal, Everything you need to know about NOx: controlling and minimizing pollutant emissions is critical for meeting air quality regulations, Metal Finishing 103 (2005) 18–24. S. Lewis, C. Mason, J. Srna, Carbon monoxide exposure in blast furnace workers, Australian Journal of Public Health 16 (1992) 262–268. J.M. Freeman, Everything you wanted to know about carbon monoxide but didn’t know who to ask. http://www.aeiengineers. com/everything-you-wanted-to-know-about-carbon-monoxidebut-didnt-know-who-to-ask/ (accessed on dated 15th June, 2014). Y. Tunckaya, E. Koklukaya, Comparative performance evaluation of blast furnace flame temperature prediction using artificial intelligence and statistical methods (2013)
P. Sen: Manufacturing Rev. 2015, 2, 17
22.
23. 24.
25.
26.
27.
28.
29.
30.
31.
32.
33.
34.
35.
http://online.journals.tubitak.gov.tr/openAcceptedDocument.htm? fileID=387491&no=83364 (accessed on dated 26th June, 2014). A. Kumar, K.P. Mrunmaya, S. Maharana, S.K. Chowdhury, R. Sah, M. Kaza, A real time model for prediction of blast furnace hot metal temperature through neural network, Proceeding of the International conference on science and technology of iron making and steel making, December 16–18, 2013, CSIR-NML Jamshedpur (2013). http://eprints.nmlindia.org/7076/ (accessed on dated 15th June, 2014). J. Angstenberger, Blast Furnace Analysis with Neural Networks, Cybernetics and Systems 37 (2006) 509–531. M. Langer, B. Vogel, Synthesis of plantwide quality prediction system for a sintering plant, 15th Triennial World Congress, Barcelona, Spain. www.nt.ntnu.no/users/skoge/prost/ proceedings/ifac2002/data/.../804.pdf (accessed on dated 24th July, 2014). E. Worrell, L. Price, N. Martin, Energy efficiency and carbon dioxide emissions reduction opportunities in the US iron and steel sector, Energy 26 (2001) 513–536. Available and Emerging Technologies for Reducing Greenhouse Gas Emissions from the Iron and Steel Industry, Sector Policies and Programs Division, Office of Air Quality Planning and Standards, U.S. Environmental Protection Agency (September, 2012). www.epa.gov/nsr/ghgdocs/ironsteel.pdf (accessed on dated 24th July, 2014) E. Worrell, N. Martin, L. Price, Energy efficiency and carbon dioxide emissions reduction opportunities in the U.S. iron and steel sector, Environmental Energy Technologies Division, Ernest Orlando Lawrence Berkeley National Laboratory (July, 1999) Tracking Industrial Energy Efficiency and CO2 Emissions, France, International Energy Agency (IEA), www.iea.org/ publications/freepublications/.../tracking_emissions.pdf (accessed on dated 16th July, 2014). I.v. Ion, F. Popescu, L. Georgescu, Prediction of the pollutants generation in natural gas/residual steel gases co-combustion, International Journal of Energy & Environment 1 (2007) 79–84. G.V. Korshikov, V.N. Titov, V.G. Mikhailov, Energy expenditures and carbon dioxide emissions at blast furnaces, Steel in Translation 43 (2013) 465–470. T. Miyakawa, N. Takegawa, Y. Kondo, Removal of sulfur dioxide and formation of sulfate aerosol in Tokyo, Journal of Geophysical Research 112 (2007) 1–13. www.onlinelibrary. wiley.com/doi/10.1029/2006JD007896/pdf (accessed on dated 16th July, 2014). W. Wang, Z. Zhao, F. Liu, S. Wang, Study of NO/NOx removal from flue gas contained fly ash and water vapor by pulsed corona discharge, Journal of Electrostatics 63 (2005) 155–164. Carbon monoxide in the workplace, Industrial Accident Prevention Association 2008. www.iapa.ca/pdf/carbon_monoxide_ feb2003. pdf (accessed on dated 16th July, 2014). G. Xiang, W. Zuliang, S. Xu, L. Zhongyang, N. Mingjiang, C. Kefa, Multi-pollutants simultaneous removals from flue gas, 11th International Conference on Electrostatic Precipitation 1 (2009) 12–18. I. Dogan, Analysis of facility location model using Bayesian Networks, Expert Systems with Applications 39 (2012) 1092–1104.
7
36. Y.Y. Wee, W.P. Cheah, S.C. Tan, K.K. Wee, A method for root cause analysis with a Bayesian belief network and fuzzy cognitive map, Expert Systems with Applications 42 (2015) 468–487. 37. B.G. Marcot, Metrics for evaluating performance and uncertainty of Bayesian network models, Ecological Modelling 230 (2012) 50–62. 38. A.M. Ellison, An Introduction to bayesian inference for ecological research and environmental decision-making, Ecological Applications 6 (1996) 1036–1046. 39. J.Y. Zhu, A. Deshmukh, Application of Bayesian decision networks to life cycle engineering in Green design and manufacturing, Engineering Applications of Artificial Intelligence 16 (2003) 91–103. 40. E. Pérez-Miñana, P.J. Krause, J. Thornton, Bayesian Networks for the management of greenhouse gas emissions in the British agricultural sector, Environmental Modelling & Software 35 (2012) 132–148. 41. K.L. Webster, J.W. McLaughlin, Application of a Bayesian belief network for assessing the vulnerability of permafrost to thaw and implications for greenhouse gas production and climate feedback, Environmental Science & Policy 38 (2014) 28–44. 42. V. Delcroix, K. Sedki, F.X. Lepoutre, A Bayesian network for recurrent multi-criteria and multi-attribute decision problems: choosing a manual wheelchair, Expert Systems with Applications 40 (2013) 2541–2551. 43. E.J.M. Lauría, P.J. Duchessi, A Bayesian Belief Network for IT implementation decision support, Decision Support Systems 42 (2006) 1573–1588. 44. D.L. Kelly, C.D. Kolstad, Bayesian learning, growth, and pollution, Journal of Economic Dynamics and Control 23 (1999) 491–518. 45. W. Wang, Application of Bayesian Network to tendency prediction of blast furnace silicon content in hot metal, Bio-Inspired Computational Intelligence and Applications, Lecture Notes in Computer Science 4688 (2007) 590–597. 46. T.A. Zheldak, V.V. Slesarev, D.O. Volovenko, Knowledge-based intellectual DSS of steel deoxidation in BOF production process, American Journal of Mining and Metallurgy 1 (2013) 7–10. 47. P.A. Leicester, C.I. Goodier, P. Rowley, Using a Bayesian Network to evaluate the social, economic and environmental impacts of community renewable energy, Proceedings of CISBAT, Clean Technology for Smart Cities and Buildings, Lausanne, 4–6 September 2013. https://dspace.lboro.ac.uk/ dspace-jspui/handle/2134/14472 (accessed on dated 24th July, 2014). 48. E. Celio, T. Koellner, A. Grêt-Regamey, Modeling land use decisions with Bayesian networks: spatially explicit analysis of driving forces on land use change, Environmental Modelling & Software 52 (2014) 222–233. 49. D.P. Ames, B.T. Neilson, D.K. Stevens, U. Lall, Using Bayesian networks to model watershed management decisions: an East Canyon Creek case study, Journal of Hydroinformatics 7 (2005) 267–282. 50. M. Tighe, C.A. Pollino, S.C. Wilson, Bayesian Networks as a screening tool for exposure assessment, Journal of Environmental Management 123 (2013) 68–76.
Cite this article as: Sen P: Identification of environmental bottleneck using Bayesian Networks: a case study of an Indian pig iron manufacturing organization. Manufacturing Rev. 2015, 2, 17.