Feb 24, 2015 - cannot cover the financing gap (Greg, 2007). They usually report negative incomes as ...... Global Issue Paper No. 8, Heinrich Boll · Foundation ...
International Academic Journal of Economics and Finance | Volume 1, Issue 4, pp. 14-31
MODERATING EFFECT OF GOVERNMENT REGULATIONS ON THE RELATIONSHIP BETWEEN COST RECOVERY AND FINANCING OF WATER INVESTMENTS IN NAIROBI PERI-URBAN MARKETS IN KENYA Kimani E. Maina College of Human Resource Development, Jomo Kenyatta University of Agriculture and Technology, Kenya Mouni Gekara Geoffrey School of Business, East African University, Kenya Kenneth Lawrence Wanjau School of Business, Karatina University, Kenya Joseph K. Mung’atu Department of Statistics and Actuarial Science, Jomo Kenyatta University of Agriculture and Technology, Kenya ©2015 International Academic Journals Received: 20th February 2015 Accepted: 24th February 2015 Full Length Research
Available Online at: http://www.iajournals.org/articles/iajef_v1_i4_14_31.pdf Citation: Kimani, E. M., Mouni, G. G., Wanjau, K. L. & Mung’atu, J. K. (2015). Moderating effect of government regulations on the relationship between cost recovery and financing of water investments in Nairobi peri-urban markets in Kenya. International Academic Journal of Economics and Finance, 1 (4), 14-31 International Academic Journals www.iajournals.org | Open Access | Peer Review | Online Journal Publishers
14 | Page
International Academic Journal of Economics and Finance | Volume 1, Issue 4, pp. 14-31
ABSTRACT Over the last 200 years, most water utilities have been publicly owned and managed. For this reason, public utility firms have been getting financial support from the government in form of subsidies in addition to the revenue they generate internally. However these water utilities have not been able to generate sufficient internal revenue to ensure sustainable financial investments. There has been low level of investment in the sector especially in peri-urban markets mainly due to poor cost recovery. The study explored moderating effect of government regulations on the relationship between cost recovery and financing of water investments in Kenya. The study adopted descriptive survey research design. A two stage sampling technique was used to obtain a sample population of 150 small
scale water service providers. The study utilized self-administered questionnaire and content analysis for collecting data. SEM was used to analyse the relationship between cost recovery and financing of water investments.The findings of the study indicated that factors inhibiting cost recovery includes poor water pricing, low users’ charge and externalities. The recommended remedies to cost recovery includes cross-subsidization, gradual increase of user fees, and service improvement. The results of the study will be of great importance as it will contribute to greater understanding of various factors that inhibits cost recovery among water utilities and how these factors can be improved. Key Words: Cost recovery, Financing, Peri-urban Markets, Safe drinking water
INTRODUCTION Water is one of the most basic requirements for human existence, yet over a billion people in the world lack access to it [World Health Organization (WHO), 2010]. Scarcity of water is one of the world's leading problems affecting more than 1.1 billion people globally (WHO, 2010). As a result, 33 percent of the world population suffer from preventable diseases, while millions of people die every year due to water related issues (United Nation Development Programme, 2006). Historically, water has been viewed as a public good, not a market commodity (Finger and Allouche, 2002). Over the last 200 years, most water utilities have been publicly owned and managed. However public water utilities in most parts of the world have been unable to provide universal access to water services (Daniel and Karina, 2003). Public utility companies have high level of indebtedness, and the institutions have poor creditworthiness. Burki and Perry (2008) argue that the current level of investments in water sector by public utility companies worldwide is very low. International Financial Institutions (IFIs) began promoting programs to increase access to clean water in the 1950s. In 1977 United Nations (UN) held the first international conference on freshwater and lack of access to clean drinking water was declared an international crisis (Finger and Allouche, 2002). In response, the United Nations declared the 1980s the “International Decade for Clean Water and Sanitation”. Thereafter, IFIs and national governments significantly increased their
International Academic Journals www.iajournals.org | Open Access | Peer Review | Online Journal Publishers
15 | Page
International Academic Journal of Economics and Finance | Volume 1, Issue 4, pp. 14-31
funding for water investments. The percentage of the world’s population without access to clean water dropped from 41 percent in 1980 to 21 percent by 1990 (Gleick, 2004). In Kenya, the responsibility for water service provision is in the hands of public utilities, private firm and small water service providers (WASREB, 2009). Water supply in Kenya is characterized by low levels of access, particularly in urban slums and in rural areas. The main sources of funding for Kenyan water institutions includes the government funds of 58%, internally generated funds amounted to 11% and donor contributions that made up 31% of the funds available. The 2009 Impact Report by the RoK estimated that only 37% of Kenyans had access to sufficient and safe drinking water close to their homes at an affordable price (RoK, 2010). Water services in Nairobi are provided by the Nairobi City Water and Sewerage Company Ltd (NCWSC) (WASREB, 2009). NCWSC mainly serve the city’s CBD and high income residential zones (Wambua, 2004). The private sector plays a limited, but not negligible role in operating water supply systems in Nairobi. Small scale service providers are the main providers of water in the low income settlements (peri-urban) areas of Nairobi (WASREB, 2009). STATEMENT OF THE PROBLEM Most water utilities in Kenya have been publicly owned and managed (RoK, 2010). These utilities have thus been getting financial support from the government in form of subsidies in addition to the revenue they generate internally (Karanja, 2011). However the current level of investment in water sector in Nairobi peri-urban markets is very low (NCWSC, 2011).This utilities have not been able to meet their water investment needs due to poor cost recovery (RoK, 2010). As a result, the level of investment in water sector is very low hence water scarcity. Among the Kenya’s population that lives in the Nairobi’s peri-urban markets, 71% do not have access to basic water (UN Habitat, 2003). Most women in these areas spend 60% of their time looking for water, time that could have been spent for gainful economic development (Karanja, 2011). Many people among this population suffer from preventable diseases while others die every year due to water related issues (UNDP, 2006). The social and economic consequences of a lack of clean water also penetrate into realms of education, opportunities for gainful employment, agricultural industrial development, regional conflict and productivity (World Bank, 2010). RESEARCH OBJECTIVE The objective of the study was to determinemoderating effect of government regulations on the relationship between cost recovery and financing of water investments in Kenya.
International Academic Journals www.iajournals.org | Open Access | Peer Review | Online Journal Publishers
16 | Page
International Academic Journal of Economics and Finance | Volume 1, Issue 4, pp. 14-31
LITERATURE REVIEW This study analysed the effect of government regulations on the relationship between cost recovery issues (pricing, externalities, user charges and consumer demand) and financing of water investments in Nairobi peri-urban markets. Concept of Water Financing Finance is one of the most important aspects of business management and includes decisions related to the acquisition and use of funds for the enterprise (Burki and Perry, 2008). Throughout the world water resources are coming under serious financial pressure. Most governments are experiencing budget constraints and cannot be able to finance water investments needs (Burki and Perry, 2008). Water utilities generate low revenue which cannot cover the financing gap (Greg, 2007). They usually report negative incomes as users’ fee are set below full cost recovery level (Finger and Alluche, 2002, Burki and Perry, 2008, Steven et al., 2007).Financing urban water infrastructure has not been easy. Water utilities tend to have difficulties raising capital. The prices charged to water consumers are too low as the government is unwilling to raise the water price to market price level. For this reason private water service providers are reluctant in investing their funds in water business Theoretical Literature Review A theory is a reasoned statement or group of statements, which are supported by evidence meant to explain a phenomenon. A researcher should therefore be conversant with those theories applicable to his/her area of research (Kombo and Tromp, 2009). Trochim (2006) argue that theoretical framework guides research, determines what variables to measure, and what statistical relationships to look for in the context of the problem under study. Thus, the theoretical literature helps the researcher see clearly the variables of the study, provides a general framework for data analysis and helps in selection of applicable research design (Kombo and Tromp, 2009). The transaction costs theorytakes the choice of ‘make’ or ‘buy’ within a private firm framework and applies it to government decisions concerning public services delivery. Williamson (1999) argues that transactions have three basic dimensions, 1) Uncertainty on how the transaction develops and its results, 2) The frequency with which transactions are repeated, 3) The relative requirement of long-term investments specifically related to the transaction, or sunk costs. Because of these factors, the institutional organization required to establish and to apply the contracts can be very complex. Theoretical analysis of privatization and contracting out uses the concept of transaction costs in an open sense, which includes administrative costs as well as costs from incomplete contracts. In their theoretical analysis on the choice between public and private production, Sappington and Stiglitz (1987) argue that the main factor explaining the choice of production form is a function of the transaction costs and cost recovery derived from the delegation of authority. Cost savings are likely to emerge when transactions costs are not huge. Hence, depending on the characteristics of the concrete service savings will be more or less likely. International Academic Journals www.iajournals.org | Open Access | Peer Review | Online Journal Publishers
17 | Page
International Academic Journal of Economics and Finance | Volume 1, Issue 4, pp. 14-31
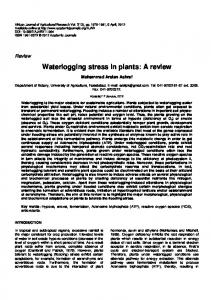
Stein (1990) used this approach to classify local government services and assess form of delivery. Transactions costs have been used to explain government choice in the decision to contract out (Hefetz and Warner, 2004). Transactions costs are a significant factor in explaining decisions to privatize or re-internalize production (Hefetz and Warner, 2004, Kavanagh and Parker, 1999). Cost savings and recovery expectations from this view are dependent on nature of service and local market conditions. CONCEPTUAL FRAMEWORK A conceptual framework is a set of broad ideas and principles taken from relevant fields of inquiry and used to structure a subsequent presentation. It is a diagrammatical representation that shows the relationship between dependent and independent variables (Young, 2009). Mugenda (2008) defines conceptual framework as a concise description of the phenomenon under study by a graphical or visual description of the major variables of the study. The key variables in this study were categorized as independent variable, moderator and dependent variable. Mugenda (2008) explains that the independent variables are called predictor variables because they predict the amount of variation that occurs in another variable while dependent variable, also called criterion variable, is a variable that is influenced or changed by another variable. The dependent variable is the variable that the researcher wishes to explain. A moderator variable is a variable that alters the strength of the causal relationship (Frazier, Tix & Barron, 2004). Government regulations
Economic regulation Market regulation Social regulation Technical regulation
Cost recovery
Pricing Externalities User charges Consumer demand
Financing water investments in Kenya
Increased coverage Improved water quality Increased access Cash surplus
Figure 1: Conceptual Framework Empirical Studies on Water Financing The objective of this study was to determine whether cost recovery influences implementing operational framework for financing of water investments in Nairobi Peri-urban markets in Kenya. A number of researches on financing water investments have been done internationally and locally. Ashton (2000a) analysed potential improvement in efficiency in the former public agencies that were privatized in UK in 1990s. Saal and Parker (2000), International Academic Journals www.iajournals.org | Open Access | Peer Review | Online Journal Publishers
18 | Page
International Academic Journal of Economics and Finance | Volume 1, Issue 4, pp. 14-31
OECD (2004), Bel and Costas (2006), Dijkgraaf and Gradus (2006a, 2006b), Mann and Mikesell (2006), and Teeples and Glyer’s (2007) studied the relationship between form of water production and costs. Jones and Mygind (2000) carried a study to compare efficiency between private and public delivery of water services. Rajeet al., (2002) examined household willingness to pay for municipal water. Muiruri (2003) surveyed factors influencing management and commercialized urban water services in Kenya. Ntengwe (2004) carried out a study in Zambia to determine the linkages between awareness of water issues, ability to pay for water, affordability of water services and cost recovery. Yang et al., (2006) examined factors that influence the demand for alternative water supply. Whittington et al. (2008) carried out a study to assess household demand for improved water and sanitation services. Mukuluet al., (2011) studied the market drivers for competitive advantage of micro and small piped water enterprises in peri-urban areas of three Kenyan cities. Karanja (2011) conducted a study on improvement of water provision in Nairobi through control of non revenue water. Research Gap From survey of relevant literature, it was found that there are no studies specific to Kenya peri-urban areas on moderating effect of government regulations on the relationship between cost recovery and financing of water investments in Nairobi peri-urban markets in kenya.This study was therefore conducted in order to fill these pertinent gap in literature by studying the variables that influence cost recovery among water utilities in Kenyan peri-urban markets. Therefore the study hypothesized that: H01: There is no significant relationship between cost recovery and financing of water investments in Nairobi Peri-urban markets in Kenya. The study also hypothesized that: H02: Government regulations do not moderate the relationship between cost recovery andfinancing of water investments in Nairobi Peri-urban markets in Kenya. Finance is one of the most important functional areas of business and within business firms. It includes decisions related to the acquisition and use of funds for the enterprise (Burki and Perry, 2008). Business finance refers to the fund and monetary support required by an entrepreneur for carrying various activities relating to the business. Business owners and business managers have to have at least a basic understanding of finance even if they outsource certain areas of their financial operations. Within a business, the firm may invests in services. Provision of water is such an investment (Steven et al., 2007). A number of indicators are used to measure financing of water investments. This indicators includes increased coverage, improved water quality, increased access and cash surplus (Steven et al., 2007).
International Academic Journals www.iajournals.org | Open Access | Peer Review | Online Journal Publishers
19 | Page
International Academic Journal of Economics and Finance | Volume 1, Issue 4, pp. 14-31
RESEARCH METHODOLOGY Research Design This study was guided by cross-sectional survey. This design helps with hypothesis formulation and testing the analysis of the relationship between variables (Kothari, 2004). The target population for this study was 12,000 water service providers in Kenya including public utilities, private and small scale service providers (RoK, 2010). The accessible population for this study was 1500 registered small scale water service providers in Nairobi. A two stage sampling technique was used; purposive sampling and simple random sampling technique in the first and second stage respectively. There are seventeen constituencies in Nairobi County. Purposive sampling technique was therefore used to identify three constituencies from where small scale water service provider for inclusion in the study was drawn (Kombo and Tromp, 2009). Langata, Kasarani and Dagoreti constituencies were thus selected for the study. These constituencies were chosen as they are characterised by low level of water investment by both public and private players hence water scarcity (NCWSC, 2011). Many people in these areas still do not have access to basic water yet there is little participation of private players (UN HABITAT, 2010). Study Population Cohen, Manion and Morrison (2000) agree that 10 percent of the accessible population is large enough to allow for reliable data analysis and testing of significance. Accessible population for this study was 1500 registered small scale water providers in Nairobi (WASREB, 2010). Therefore a proportionate sample size of 150 respondents was selected. Simple random sampling technique was used to identify 50 small scale water providers from each constituency for inclusion in the study. Data Collection Procedure Creswell (2003) and Cooper and Schilder (2011) agree that the respondents used in pilot test should constitute 10percent of the sample used in data collection. Therefore 15 questionnaires were administered in pilot testing to test the degree of accuracy of the instrument used to collect data in locations in which the pilot survey took place. Cronbach's Alpha statistic ranged from 0.727 to 0.864 indicating high reliability of data. Mertens (2010) avers that the closer the coefficient is to 1.0, the more reliable the measurements. This study adopted content validity. Opinion of three experts was sought to review data collecting instrumentsbefore proceeding to the field for final data collection in locations in which the pilot survey took place. Validity test results yielded an average index score of 85 percent. This implies that the instruments were valid. Eigen values criterion was used to determine the selection of factor loadings for each component. The larger the eigen value loading, the more important the associated principal component (Graham & Midgley, 2000). In this case, the varimax with Kaiser Normalization sampling adequacy with eigen value greater than 1 were used as the rotation method because the items were uncorrelated. Montgomery, Peck and Vining (2001) recommend that a International Academic Journals www.iajournals.org | Open Access | Peer Review | Online Journal Publishers
20 | Page
International Academic Journal of Economics and Finance | Volume 1, Issue 4, pp. 14-31
minimum factor loading of 0.40 should be used when factor analysis is used to refine construct validity. All items had factor loadings ranging from 0.763 to 0.906. Data Analysis Statistical Package for the Social Sciences (SPSS) version 21.0 for Windows 7 and Windows 8 was used for data entry, data cleaning and running the Exploratory Factor Analysis (EFA). Other software applications used were Ms-Excel for Windows 8 for case cleaning, variable screening and as a transit package in that the data from SPSS was saved in Ms-Excel for it to be exported to SPSS. Analysis of Moment Structures (AMOS) version 18, which is essentially analysis of mean and co-variance structures, for Initial EFA, Confirmatory Factor Analysis (CFA), Path Analysis and Structural Equation Modeling (SEM); Smarts’ version 2.0 for Path Analysis, SEM with moderation and model diagnostics; STATA version 12.0 for normality testing; R-GUI version 2.10.0 for building plots, for instance box-plots using the Ggplot2 package, and for univariate and multivariate testing of outliers in the dependent variable. Before processing the responses, every filled questionnaire was tallied for every response per question. The responses were first edited, coded, and cleaned for analysis (Mugenda, 2011). SPSS was used to conduct descriptive data analysis of each variable and the same was presented in form of percentages, tables and graphs. Quantitative approach involved collecting numerical data through counting of attributes or quantities. The counts were used to report the findings as numbers. To ensure that there was no violation of the assumptions, this study tested for outliers, normality, linearity, homoscedasticity, multicollinearity, independence of residuals correlation and common method variance. The results of the tests conformed to the respective thresholds for each test. Data analysis was further conducted using two phase process consisting of confirmatory measurement model and structural model (Bryne, 2006). The first step involved estimation of the measurement model which assesses the relationship between the observable variables and the theoretical constructs they represent (Bryne, 2006). However prior to CFA, exploratory factor analysis (EFA) that involved computation of factor loading matrix, communality and principle component analysis (PCA) was conducted. To assess the factorability of items, Kaiser Meyer-Olin and Barletts Test of Sphericitytests were conducted (Pallant, 2010). CFA was used to shows the extent to which the observed variables (indicators) represented the underlying latent construct (Hair et al. 2010, Hooper et al., 2008).To validate the model fit, convergent validity, discriminant validity, construct reliability, and construct validity were conducted The most basic test, chi-square goodness of fit test, absolute fit indices and incremental fit indices were used (Hair et al., 2010). The second phase was the specification of the structural model and evaluation of the relationships proposed and testing of hypothesis (Bryne, 2006). Structural equation modelling was used to test the hypothesized relationship and to fit the structural model. Regression weights were used to test the contribution of each indicator to their relevant constructs (convergent validity) and also to explain the nature of the relationship since all the variables International Academic Journals www.iajournals.org | Open Access | Peer Review | Online Journal Publishers
21 | Page
International Academic Journal of Economics and Finance | Volume 1, Issue 4, pp. 14-31
were in the same measurement scale. Path coefficients were used to determine the direction and strength of the factor. R2 was used to show the proportion of variation in dependent variable explained by the SEM models. T-statistics value (C.R) was used to test whether the models were significant by comparing the model output (t-calc) with the conventional critical value of -1.96 0r 1.96 at 0.05 significance level (i.e. p -1.96 or 1.96 at 0.05 significance level (p