submits that keyword in a query to the search engine, an auction is run among all the advertisers submitting bids for that keyword. A key issue in auction design ...
8th Annual Communication Networks and Services Research Conference
Penalized Second Price: A New Pricing Algorithm for Advertising in Search Engines Antonio Grillo
Alessandro Lentini Maurizio Naldi Giuseppe F. Italiano Dipartimento di Informatica, Sistemi e Produzione Universit`a di Roma “Tor Vergata” Via del Politecnico 1, 00133 Rome, Italy {grillo}{lentini}{naldi}{italiano}@disp.uniroma2.it
Abstract
is instead the Generalized Second Price (GSP), where each bidder pays for each click on its hyperlink a price equal to the next lower bid. On the other side of the market, bidders have to choose a bidding strategy. GSP does not provide itself a unique bidding strategy for the advertiser, since any bid lower than the valuation is an equally valid choice for the bidder. Recently, the Balanced Bidding (BB) strategy has been proposed by Cary et al. [4] for such purpose, where each advertiser identifies at each round its optimal slot as that maximizing its expected profit. However, it is known that the GSP pricing mechanism may lead to aggressive bidding behaviour and to the resulting phenomenon known as Competitor Busting, which tends to exclude competitors from the auction by raising their prices till exhausting their budget [5]. Competitor Busting is a popular bidding strategy used in practice and it is reported to be used by as many as 40% of the bidders on Yahoo! [17]. Aggressive bidding strategies, which attempt to drive out competition other bidders, may also emerge in new advertising models such as the Output Bidding proposed in [6], where advertisers bid on terms anywhere in the output of search engine result page. Hence a more robust approach to pricing may be needed to discourage such aggressive behaviour.
Strategic bidding coupled with the GSP pricing mechanism is known to lead to aggressive bidding behaviour and Competitor Busting in keyword auctions. We introduce a new pricing mechanism, named Penalized Second Pricing (PSP), to help reducing the unfair effects of aggressive bidding. The performances of GSP and PSP are evaluated both in a static and a dynamic context, where the number of bidders may change during the auction. The simulation experiments show that PSP not only discourages aggressive bidding behaviour, but also leads to larger revenues for the auctioneer than those obtained with GSP.
1
Introduction
The access to the giant web information repository freely granted by search engines represents one of the foremost Internet services. Given the free nature of the service, the main source of profits for search engines is represented by advertising [7]. Advertising space is sold in the form of slots, i.e., some portions of the web page, where the search results are displayed, is devoted to advertisements in the form of sponsored links and some accompanying text. These slots are typically sold by auctions, whereby advertisers submit bids associated to a keyword; when a user submits that keyword in a query to the search engine, an auction is run among all the advertisers submitting bids for that keyword. A key issue in auction design is the choice of the pricing rule. Among the mechanisms proposed for this purpose, the Vickrey-Clarke-Groves (VCG) algorithm has the relevant property of inducing bidders into bidding their true valuation of the item on sale. However, it is not used in practice for a number of reasons [12]. The prevalent mechanism for assigning the slots and setting the price 978-0-7695-4041-2/10 $26.00 © 2010 IEEE DOI 10.1109/CNSR.2010.13
In this paper, we introduce a new pricing mechanism for keyword auctions, which we name Penalized Second Price (PSP), where the price is determined by both the bid of the winning bidder and that immediately lower (rather than just the latter as in GSP), namely through a linear combination of them. The rationale for PSP is that an aggressive bidder will suffer itself the consequences of its behaviour, raising at the same time its prices as well as that of its direct competitor. We provide here a first analysis of the performance of PSP vs. GSP. Prior to analysing the performance of PSP under Competitor Busting, we aim at assessing if PSP underperforms GSP when bidders follow the Balanced Bidding strategy. Though the bidding and pricing decisions 207
• A set of N bidders (advertisers) participating in the auction, each one having its own private valuation for a click. We denote by Vi the valuation of bidder i;
taken during the sequence of auction rounds may be formulated as a repeated game, we do not focus here on the equilibrium analysis. In fact, as stated in Osborne and Rubinstein [10],
• the set of N bids submitted by the bidders; each bidder can change its bid at any auction round; for the round at hand we denote by bi the bid submitted by bidder i and by b(i) the i-th highest bid;
they [the Folk theorems] show that the set of equilibrium outcomes of a repeated game is huge, so that the notion of equilibrium lacks predictive power.
• the allocation mechanism by which slots are assigned to bidders; πj is the identity of the bidder that is assigned slot j;
Instead we analyse both the auctioneer’s and the bidders’ satisfaction resulting from the application of the two pricing schemes. For this purpose we employ a set of metrics, including the level of participation by bidders, their utility, and the revenues obtained by the auctioneer. We conduct the analysis by simulation, by introducing a model for the bidders’ population dynamics during the sequence of auction rounds. To the best of our knowledge, this is among the first studies that attempts to model features related to population dynamics, while most of the work on the evaluation of keyword auctions seems to assume that the population is fixed throughout the auction rounds (see, e.g., [7, 5, 15]). In addition to proposing a new pricing scheme and analysing it also in a dynamic context, we show that: a) bidders are not discouraged from taking part to the auction by the introduction of PSP; b) the level of bidders’ participation depends to a very large extent on the distribution of valuations of slots; c) PSP provides slightly larger revenues for the auctioneer than GSP; d) revenues in PSP increase with the market size. The remainder of the paper is organized as follows. The new PSP mechanism is described in Section 2, while the models for the population dynamics and the bidders’ valuations are defined respectively in Sections 3 and 4. The simulation and its results are reported in Section 5.
2
• the pricing mechanism, by which bidder πj is charged the price pj . The Generalized Second Price (GSP), deeply analysed in [7], is currently the most established mechanism for pricing slots. Its allocation and pricing rules are the following: • Slots are allocated to bidders in decreasing order of their bids; • For slot j, the payment pj of bidder πj is pj = bπj+1 . Bidders who do not win a slot make no payment and gain no utility. Though widely adopted, GSP has its limitations. In fact, it may be vulnerable to aggressive bidding behaviour. For example, bidders may adopt a Competitor Busting (CB) approach [5], also referred to as anti-social or vindictive bidding [2], which is reported to be adopted by as much as 40% of users on Overture [17]. In CB bidders bid as high as possible while retaining the slot maximizing their utility. The aim of such aggressive bidders is to have the bidder getting the next higher slot pay as much as possible, with the ultimate goal of exhausting its budget and therefore have it leave the auction. In GSP such unfair behaviour is not penalized, since the price a bidder pays is not influenced by its own bid (in the range of values leading to the same slot). We need therefore a mechanism to penalize Competitor Busting, possibly without sacrificing revenues. With the aim of reducing the unfair effects of aggressive bidding we introduce now a new pricing mechanism: Penalized Second Price (PSP). PSP maintains the same allocation rule of GSP, but changes the payment rule. For each slot j, the payment pj of bidder πj is now pj = bπj+1 + β(bπj − bπj+1 ), where β ∈ [0, 1]. Aggressive bidders who place large bids to raise up the price for a slot are now penalized by being charged a correspondingly higher price. The extent of the penalty can be tuned by setting the value for β. PSP’s payment rule can be seen as intermediate between GSP (corresponding to the β = 0 setting) and the First Price mechanism (corresponding to the β = 1 setting). PSP shares with GSP the lack of the truthfulness property,
The PSP pricing approach
The core of our study is represented by the proposal of a new pricing algorithm for keyword auctions (PSP). In this section, after briefly reviewing the basic characteristics of keyword auctions, we describe first GSP, the currently most used pricing algorithm for such auctions, then discuss some of its limitations, and finally present the PSP algorithm. At the end of the section we complement the description of pricing mechanisms by the description of the bidding behaviour we assume when evaluating pricing mechanisms. A keyword auction is defined by the following elements: • A set of S advertising slots with click-through rates (CTRs) θ1 > . . . > θS , where θi is the probability that a user will click on the advertisement in slot i (we number slots progressively starting with the top positioned one);
208
where Bt is the number of new bidders appearing at round t, and Dt is the number of bidders leaving at round t. For the purpose of defining the components of this process, we introduce the following quantities:
so that it allows for strategic bidding; this can be shown by the same counterexample employed in [7]. In order to evaluate the effectiveness of the PSP approach in fighting aggressive behaviour we have to adopt a model for the strategic bidding behaviour. For this first evaluation we adopt the greedy behaviour known as Balanced Bidding [4], where each bidder chooses its bid for the next round so to maximize its utility, assuming that all the bids submitted by the other bidders will not change in the next round, according to the following two steps (formulated for bidder i and indicating by pˆj the price bidder i would pay to get slot j):
• the probability rin that a new bidder joins the auction; • the probability rout that a losing bidder leaves the auction; PS • the average price P = i=1 pπi /S paid by the winning bidders; PN • the average bid Olose = i=S+1 b(i) /(N −S) submitted by the losing bidders; PS • the average bid Owin = i=1 b(i) /S submitted by the winning bidders.
1. target the slot ki∗ that maximizes its profit (optimal (∗) slot), i.e., ki = argmax{θk [vi − pk ]}, k
0
2. set its next bid b so as to satisfy the equation θki∗ (vi − pˆki∗ ) = θki∗ −1 (vi − b0 ).
3
3.1
A dynamic population environment
In this subsection we provide a probability model for the bidders actually leaving the auction. We assume that only losing bidders may want to leave the auction, that they do so independently, and that the probability that they leave the auction depends on the distance between their average bid and the winning bids. Namely, we model the death process through a binomial distribution, so that the probability distribution for the number Dt of leaving bidders at round t is � � Nt−1 − S j P[Dt = j] = rout (1 − rout )Nt−1 −S−j , j (2) 0 ≤ j ≤ Nt−1 − S,
Most of the work on the evaluation of keyword auctions assumes that the population is fixed, i.e., that the number N of bidders is constant, see, e.g., [7, 5, 15]. However, auctions for keywords are held continuously, and it thus seems natural to consider that the number of bidders may change through the auction rounds. In fact, bidders may leave the auction for a number of different reasons, e.g., since: • they are no longer interested in advertising; • they change their keywords of interest; • the prices they are willing to pay are way below the actual ones, frustrating their chance to get a slot.
where the probability rout for the individual losing bidder to leave the auction is
On the other hand new advertisers may join the auction, so that the assumption of a dynamic population of bidders appears to be more realistic. A realistic evaluation of algorithms for keyword auctions should therefore take into account a dynamic context, where the number of actual bidders is changing throughout the auction. This is the approach we adopt in this paper. In this section we describe how we model this dynamic process. In particular, we introduce two different models, respectively for the bidders leaving the auction (Bidders’ Death process) and for the new bidders joining it (Bidders’ Birth process). In the following we assume that the bidders, though variable, come from an underlying population of prospective bidders that is fixed, however large (its size being M ). The number of bidders at round t is now described by the random variable Nt . At any given round t, the population dynamics is described by the following equation: Nt = Nt−1 + Bt − Dt ,
The Bidders’ Death process
rout = 1 − exp−λout (
P −O lose P
)
.
(3)
The rationale behind the choice of the (P − Olose )/P term as the driving factor for the decision to leave the auction is that large values of this factor reveal that losing bids stay far behind the winning ones, and therefore losing bidders have small chances to win in the next auction rounds. We postulate that this effect is highly non-linear, namely exponential. In equality (3) we employ a single parameter, i.e., λout ; its value may be chosen by putting in relationship a single value of the (P − Olose )/P driver and the probability of leaving. In the following, we assume that when the average losing bid Olose is 50% of the average winning price P the probability of an individual bidder leaving the auction is 0.5. Under this assumption, solving equation (2) for λout yields λout = 1.386294.
(1)
209
3.2
the number of users who clicked on an ad in a web page by the number of times the ad was delivered (impressions) [13]. The larger the click-through rate, the larger the expected revenues. Statistical analyses have shown that CTR drops monotonically with the slot’s position [3], and that it follows a Zipf’s distribution [1, 16, 11]. Here we adopt the Zipf’s model, as in [9], so that the probability that the user clicks on the slot j is
The Bidders’ Birth process
Similarly to Section 3.1, we now define the probability model for the new bidders joining the auction. As stated earlier, we assume that the underlying population of prospective bidders is fixed, and made up of M elements, so that the new bidders at round t are drawn from the M − Nt−1 advertisers (a.k.a. prospective bidders) that are currently not taking part to the auction. We employ similar assumptions as those adopted for the death process, namely that prospective bidders take their decision to join independently, on the basis of the average surplus gained by the winning bidders (i.e., the average difference between their bids and the prices). The rationale for that choice is that an auction providing winners with a large surplus is more attractive for prospective bidders. Under those assumptions we adopt a binomial distribution for the number Bt of new bidders at round t: � � M − Nt−1 k P [Bt = k] = rin (1 − rin )M −Nt−1 −k , k (4) 0 ≤ k ≤ M − Nt−1 ,
θj ∝
O win −P P
)
.
(5)
The parameter λin can be chosen independently of λout (though with a similar procedure). In the following, for the sake of simplicity, we assume that λin = λout , so that when the average surplus is 50% of the price paid, the probability for the individual prospective bidder to join the auction is 0.5.
4
(6)
where α ∈ R+ is the Zipf’s parameter. CTRs are not enough to evaluate the auctioning mechanism, since advertisers may attribute different values to clicks. Here, we assume that advertisers have their own private valuations (the value of a click for an advertiser is different from those of the other advertisers and unknown to them), which can be characterized statistically, assuming that the values attributed by any advertiser are drawn from a common probability distribution. Rather than sticking to a single distribution, we employ here a variety of models, following the approach of [9], namely: uniform, triangular, Gaussian, exponential, and Pareto. These five models allow us to represent a large number of different advertisers’ beliefs on the values of clicks. In the uniform, the triangular, and the Gaussian model, the valuations concentrate around a central value and may be considered to represent the case where the advertisers share approximately a common opinion about the value of a click. Instead, in the exponential and Pareto models, lower valuations predominate over larger ones, and wide differences may appear in the value attributed to a click. We then consider N random variables {V1 , . . . , VN }, where Vi describes the value of a click for the i-th advertiser. We assume that these valuations are independent and identically distributed, following the common probability distribution function (cdf) P[Vi < x] = FV (x), i = 1, . . . , N , described in the following, and that they do not change during the sequence of auction rounds:
where the probability rin that an individual prospective bidder joins the auction follows an exponential law similarly to equality (3) rin = 1 − e−λin (
1 . jα
Models for slot and click valuations
What search engines sell through keyword auctions is an advertising space on their web pages. The space available for advertising is segmented in slots arranged vertically, and advertisements are typically shown on the page as links (a.k.a. sponsored links) with some accompanying text positioned on the right side of the page. An advertisement is deemed to be successful if the users click on it, and advertisers attribute a value to each click. The evaluation of the advertising mechanism that employs keyword auction therefore revolves around slots and clicks, and the value attributed to them. In this section we review the models employed for these quantities as a basis for the evaluation of the auctioning mechanism reported in Section 5. We consider first the click-through rate (CTR), which is generally employed to characterize the attractiveness of slots for advertisers. The CTR can be estimated by dividing
• Uniform model FV (x) =
0
x−l h−l
1
if x < l if l ≤ x < h x≥h
(7)
• Triangular model
FV (x) =
210
0
if x < l if l ≤ x < c
if c ≤ x < h x≥h
(x−l)2 (h−l)(c−l) (h−x)2 1 − (h−l)(h−c)
1
(8)
• Gaussian model Z x FV (x) = −∞
• Number of bidders; � � 1 (y − µ)2 √ exp − dy, 2σ 2 σ 2π
• Valuation of slots;
(9)
• Submitted bids.
• Exponential model −α(x−l)
FV (x) = 1 − exp
,
x ≥ l.
(10)
� �γ l FV (x) = 1 − , x
x > l.
(11)
As to the first item, the auction starts with an initial number of bidders equal to N1 = 100. In the following rounds the population dynamics model described in Section 3 is used (with the parameters governing the population dynamics λout = λin = 1.38694). Unless otherwise stated we have set the market size equal to M = 500. The valuation of each bidder is generated according to one of the probability distributions described in Section 4 (the valuations can be considered as the realization of independent and identically distributed random variables) as soon as the bidder enters the auction. In particular we have set the minimum valuation l = 3, and the upper range of valuations for the case of bounded distributions equal to h = 30. That valuation is kept as long as the bidder keeps taking part to the auction. For any new bidder (as well as for the bidders taking part to the first round) the first bid is generated by scaling down the respective valuation (e.g., the initial bid is 80% of the valuation). For already present bidders the new bids are generated according to the Balanced Bidding strategy. Slot allocation and pricing are accomplished according to the rules described in Section 2 for GSP and PSP respectively.
• Pareto model
Both the uniform and the triangular model assume that bids fall in the (l, h) range; in the triangular model we assume that the mode is c = (l + h)/2. The Gaussian model would allow for negative values (absent in real auctions) but not for a minimum bid; in order to reduce the effect of these two shortcomings we introduce two constraints [8]: 1. We choose (µ; σ) pairs such that the probability of having negative values is extremely low; 2. We introduce a conventional definition of the range of values (theoretically infinite in the Gaussian model) as six times the standard deviation so that the probability of having values outside this range is again very low (namely we assume that 6σ = h − l). As to the exponential and the Pareto distribution, in order to avoid the generation of exceedingly large valuations, we considered a censored generation mechanism, whereby valuations larger than tenfold the expected value of the distribution are discarded.
5
5.2
We now turn to the examination of the simulation results. We compare the behaviour of GSP and PSP under three metrics, to evaluate both the auctioneer’s satisfaction (namely the revenues) and the bidders’ satisfaction (the Satisfied Utility Margin and the Satisfied Bidders Ratio). At the same time we investigate the effect of population dynamics and of the market size.
Simulation analysis
The PSP mechanism described in Section 2 has to be compared against GSP. The major spur for introducing the new mechanism is the need for robustness against Competitor Busting. At this stage we want to see first if PSP performs differently than GSP when the bidding strategy is not so aggressive as CB, namely when bidders adopt a Balanced Bidding strategy. For this purpose we have carried out a simulation analysis through a straightforward MonteCarlo approach. In this section we first describe the simulation scenario and then provide the results.
5.1
Results
5.2.1
Population
The first issue we address is the extent of population dynamics, by comparing the average value of bidders (as computed over the set of auction rounds after having removed the initial transient) with the initial number (N1 as defined in Section 5.1). The results are illustrated in Table 1, which reports the average number of bidders (obtained under the GSP and PSP pricing rules) per auction round and its standard deviation (between parentheses) for all the distributions, for the reference values α = 1 (Zipf’s parameter) and β = 0.5 (penalty in PSP). In all cases we observe a population that reaches a steady state (the standard deviation is quite small),
The simulation scenario
Our simulation analysis has consisted in the realization of 1000 auction rounds. The scenario is defined through the following quantities:
211
ponential distribution, we see that large penalties (and then higher prices) may discourage bidders, but the effect is extremely limited, since the decrease is not larger than 6%.
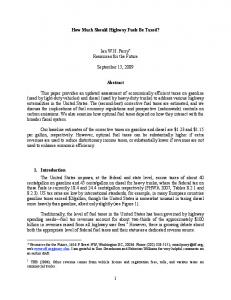
incidentally around values larger than the initial value we have used. The steady state value is quite dependent on the distribution of valuations assumed for the bidders, namely the larger dispersion of bidders’ valuations associated to the exponential and Pareto distributions leads to a larger average population. The increase with respect to the initial number of bidders is in fact minimum for the uniform distribution (the population grows by a 1.35-1.44 factor) and maximum for the Pareto distribution (the average growth factor is 3.74-3.8). In Figure 1 the empirical pdfs, estimated through the kernel method [14], are shown for these two extreme cases.
Distribution
Number of bidders β = 0.5 β = 0.75
β = 0.25 Exponential Gaussian Triangular Uniform Pareto
319.4 (7.3) 299.1 (10.0) 221.4 (8.9) 140.5 (12.7) 378.7(6.0)
333.9 (6.2) 292.4 (8.9) 214.2 (9.5) 135.7 (11,4) 374.0 (5.8)
326.4 (7.3) 285.9 (10.4) 209.4 (10.4) 133.9 (15.2) 368.9 (6.9)
Table 2: Effect of penalty on the number of bidders Pareto Uniform
Probability Density Function
0.025
Finally we analyse the effect of the popularity distribution of slots, by varying the value of Zipf’s parameter (larger values of that parameter mean that preferences for slots are more concentrated on the top ones). We consider now just the PSP case. The data reported in Table 3 show that the average number of bidders decreases sharply as Zipf’s parameter grows. In the cases of uniform or triangular distribution the population decreases by roughly 40%. The decay is limited to roughly 20% with the exponential, Gaussian or Pareto distributions. The effect can be expected since smaller values of the Zipf’s parameter lead to smaller differences in the clicktrough rates associated to the slots, so that even the bottom slots attract bidders and spur the inactive population to take part to the auction. On the other hand, larger values of the Zipf’s parameter cause top slots to be assigned at higher average prices, spurring losing bidders to leave the auction.
0.02
0.015
0.01
0.005
0 50
100
150
200
250
300
350
400
Population
Figure 1: Probability density function of the number of bidders Though the effect of the distribution of valuations is present both for GSP and PSP, we now analyse the impact (if any) of the pricing rule. Though, as expected due to the higher prices of PSP, the growth is slightly larger in the case of GSP (with the exception of the exponential distribution), the actual difference between GSP and PSP is minimal and its statistical significance appears to be quite limited due to the standard deviation (the average difference observed is slightly larger than the 1-σ interval). Therefore PSP does not appear to penalize participation, though charging more than GSP for the same set of bids. Distribution Exponential Gaussian Triangular Uniform Pareto
Distribution α = 0.5 Exponential Gaussian Triangular Uniform Pareto
Number of bidders GSP PSP 323.5 (6.8) 306.9 (9.3) 223.12 (8.8) 144.3 (11.1) 380.5 (5.5)
360.9 (6.9) 326.3 (11.2) 257.5 (9.8) 162.4 (11.3) 414.6 (6.3)
Number of bidders α = 1.0 α = 2.0 333.9 (6.2) 292.4 (8.9) 214.2 (9.5) 135.7 (11.4) 374.0 (5.8)
292.2 (7.8) 264.1 (9.0) 172.4 (11.9) 101.9 (12.7) 325.6 (7.8)
Table 3: Effect of Zipf’s parameter on the number of bidders
333.9 (6.2) 292.4 (8.9) 214.2 (9.5) 135.7 (11.4) 374.0 (5.8)
5.2.2
Revenues
The foremost criterion to evaluate an auction mechanism on the auctioneer’s side is to assess the revenues for the seller. In this section we compare the revenues obtained under GSP and PSP. If the bids submitted were the same under the two pricing mechanism the PSP would provide larger revenues. However, the adaptive characteristics of the bidding mechanism leads to different bids in the two pricing mechanisms. In this section, we analyse the impact on revenues of the pricing mechanism, the market size, and the slot popularity distribution for each slot value distribution.
Table 1: Effect of pricing mechanism on the number of bidders With reference to PSP only, we can also examine the effect of the penalty through the data of Table 2, where the penalty β has been varied from the minimum value of 0.25 to the maximum of 0.75. With the exception again of the ex-
212
In the following we assume, unless otherwise stated, that the initial number of bidders is N1 = 100, that the parameter of Zipf’s law is α = 1, and that the penalty introduced in PSP is β = 0.5. We start with comparing the revenues obtained with a fixed number of bidders, namely Ni = 100, ∀i, reported in Table 4. We see that the revenues are very close when the distribution of slot values has a limited dispersion (Gaussian, triangular, and uniform distribution). In the cases of distributions with larger dispersion (Exponential and Pareto), the revenues obtained with PSP are slightly larger. This confirms our expectations. Distribution Exponential Gaussian Triangular Uniform Pareto
Distribution Exponential Gaussian Triangular Uniform Pareto
PSP
51.0 (5.8) 23.8 (1.2) 25.2 (1.7) 28.2 (1.1) 37.2 (14.7)
52.9 (4.5) 24.0 (1.0) 25.5 (1.5) 28.3 (1.2) 42.3 (10.1)
Revenues Medium
Large
69.5 (8.7) 25.1 (2.3) 27.1 (2.2) 29.1 (1.3) 47.7 (13.1)
86.9 (6.1) 25.8 (1.9) 27.7 (2.2) 29.2 (1.3) 86.7 (9.2)
93.6 (5.3) 26.6 (1.3) 28.5 (1.2) 29.8 (0.8) 86.6 (9.6)
Table 6: Revenues under PSP with various market sizes
Revenues GSP
Small
Distribution
Revenue increase GSP PSP
Exponential Gaussian Triangular Uniform Pareto
1.353 1.053 1.060 1.025 2.242
1.346 1.062 1.055 1.024 1.815
Table 7: Revenues growth and market size
Table 4: Revenues with fixed population growth of the average revenues. The effect is again smaller for the bounded distributions (uniform and triangular).
If we introduce the population dynamics, we obtain the results reported in Tables 5 and 6. We perform the comparison with three market sizes, i.e., three values for the population M : Small (M = 200), Medium (M = 500), and Large (M = 2000). Introducing the population dynamics (which increases the number of bidders with respect to the fixed case previously considered) amplifies the increase in revenues when passing from GSP to PSP. In addition, enlarging the market size leads to even larger revenues, though the effect is quite sublinear: as shown in Table 7, when we pass from a small market size to a large one (a tenfold increase), the revenues increase by a factor slightly larger than two at most (in the Pareto case). We then examine, with reference to the medium market size only, the effect of penalty. In Table 8 we see that the slight increase in revenues observed in PSP grows with the penalty size. Distribution Exponential Gaussian Triangular Uniform Pareto
Small
Revenues Medium
Large
64.8 (8.6) 24.9 (2.2) 26.8 (2.4) 29.1 (1.2) 35.9 (22.4)
84.3 (5.6) 25.8 (1.9) 27.6 (2.2) 29.2 (1.2) 80.7 (11.5)
87.7 (5.1) 26.2 (1.3) 28.4 (1.2) 29.8 (0.8) 80.4 (11.2)
Distribution Exponential Gaussian Triangular Uniform Pareto
β = 0.25
Revenues β = 0.5
β = 0.75
87.1 (6.1) 25.7 (3.7) 27.6 (3.8) 29.2 (3.3) 83.4 (10.9)
86.9 (6.1) 25.8 (1.9) 27.7 (2.2) 29.2 (1,3) 86.7 (9.2)
90.0 (6.8) 25.8 (3.7) 27.8 (3.7) 29.1 (3.4) 90.1 (8.1)
Table 8: Effect of penalty on revenues 5.2.3
Bidders’ Satisfaction Metrics
In addition to the revenues, to measure the auctioneer’s satisfaction, we consider two metrics to evaluate the bidders’ satisfaction, as in [8]: the Satisfied Bidders Ratio (SBR) and the Satisfied Utility Margin (SUM). The SBR is simply the average percentage of winning bidders, i.e., SBR = S/N . The satisfaction of bidders will be higher the larger the SBR, since a larger proportion of the bidders will get the slots they bid for. In our case this ratio depends on the population of bidders only, since the number of slots for sale is fixed. As seen in Section 5.2.1, the number of bidders is slightly lower in PSP than in GSP, so that the SBR index is slightly better (i.e., larger) for PSP, as shown in Table 10. The SUM index is instead the average ratio between the savings achieved by the winning bidders (i.e., the difference between their valuations and the price they are charged) and
Table 5: Revenues under GSP with various market sizes Finally, we analyse the effect the users’ preferences (namely the concentration on top slots), with reference to PSP only (medium market size). In Table 9 we see that a larger concentration of clicks on the top slots determines the
213
Distribution Exponential Gaussian Triangular Uniform Pareto
α = 0.5
Revenues α = 1.0
α = 2.0
78.5 (7.) 25.5 (3.8) 26.8 (3.8) 28.9 (3.4) 71.5 (13.2)
86.9 (6.1) 25.8 (1.9) 27.7 (2.2) 29.2 (1.3) 86.7 (9.2)
107.9 (9.2) 27.0 (3.7) 28.5 (3.3) 29.5 (3.1) 116.6 (7.8)
ing strongly on the distribution of slot valuations). Though the bidders’ utility is lower than in GSP, this is due to the penalty tolled on the bidders submitting large bids (symptom of aggressive behaviour).
References [1] R. Balakrishnan and S. Kambhampati. Optimal Ad-Ranking for Profit Maximization. In 11th International Workshop on the Web and Databases, WebDB 2008, Vancouver, BC, Canada, 13 June 2008. [2] F. Brandt and G. Weiss. Antisocial agents and vickrey auctions. In ATAL, pages 335–347, 2001. [3] N. Brooks. The Atlas Rank Report: How Search Engine Rank Impacts Traffic. Technical report, Atlas Institute, July 2004. [4] M. Cary, A. Das, B. Edelman, I. Giotis, K. Heimerl, A. Karlin, C. Mathieu, and M. Schwarz. On Best-Response Bidding in GSP Auctions. Technical report, NBER Working Paper No. W13788, February 2008. [5] M. Cary, A. Das, B. Edelman, I. Giotis, K. Heimerl, A. R. Karlin, C. Mathieu, and M. Schwarz. Greedy bidding strategies for keyword auctions. In ACM Conference on Electronic Commerce EC ’07, San Diego, 11-15 June 2007. [6] A. Dasdan, S. Kolay, P. Papadimitriou, and H. GarciaMolina. Output bidding: A new search advertising model complementary to keyword bidding. In Fifth Workshop on Ad Auctions (ACM Conference on Electronic Commerce EC’09), Stanford, CA, USA, 6 July 2009. [7] B. Edelman, M. Ostrovsky, and M. Schwarz. Internet Advertising and the Generalized Second-Price Auction: Selling Billions of Dollars Worth of Keywords. The American Economic Review, 97(1):242–259, 2007. [8] M. Naldi and G. D’Acquisto. Performance of the Vickrey auction for digital goods under various bid distributions. Performance Evaluation, 65:10–31, 2008. [9] M. Naldi, G. D’Acquisto, and G. Italiano. The value of location in keyword auctions. Accepted for publication on Electronic Commerce Research and Applications. [10] M. J. Osborne and A. Rubinstein. A Course in Game Theory. The MIT Press, 1994. [11] M. Regelson and D. Fain. Predicting Click-Through Rate Using Keyword Clusters. In Second Workshop on Sponsored Search Auctions, Ann Arbor, Michigan, 11 June 2006. [12] M. Rothkopf. Thirteen Reasons Why the Vickrey-ClarkeGroves Process Is Not Practical. Operations Research, 55(2):191–197, March/April 2007. [13] L. Sherman and J. Deighton. Banner advertising: Measuring effectiveness and optimizing placement. Journal of Interactive Marketing, 15(2):60–64, 2001. [14] B. Silverman. Density Estimation for Statistics and Data Analysis. Chapman & Hall/CRC, April 1986. [15] H. Varian. Position auctions. International Journal of Industrial Organization, 25:1163–1178, 2007. [16] Y. Xie and D. O’Hallaron. Locality in Search Engine Queries and Its Implications for Caching. In INFOCOM, New York, 23-27 June 2002. [17] Y. Zhou and R. Lukose. Vindictive bidding in keyword auctions. In ICEC, pages 141–146, 2007.
Table 9: Effect of the Zipf’s parameter on revenues Distribution Exponential Gaussian Triangular Uniform Pareto
SBR GSP
PSP
0.0311 0.0330 0.0452 0.0702 0.0264
0.0301 0.0346 0.0472 0.0747 0.0269
Table 10: Satisfied Bidders’ Ratio the total sum of their bids. The satisfaction of bidders increases with SUM. Since the penalty in PSP raises the price, this is expected to lead to worse SUM values than GSP, as reported in Table 11. However, the less satisfied bidders (i.e., those paying larger penalties) are those whose bidding behaviour is aggressive. Since PSP aims at discouraging those bidders, the lower values of SUM achieved could be considered as an evidence of the fulfilment of PSP’s aim rather than a symptom of misconduct. Distribution Exponential Gaussian Triangular Uniform Pareto
SUM GSP
PSP
0.1189 0.0172 0.0118 0.0032 0.1594
0.0806 0.0095 0.0071 0.0017 0.1015
Table 11: Bidders’ Satisfied Utility Margin
6
Conclusions
In this paper we have proposed Penalized Second Price as a pricing mechanism to discourage aggressive bidding strategies (such as Competitor Busting) by setting prices which are a linear combination of the winning bid and of the next lower bid. We have compared PSP to GSP by simulation, assuming bidders to follow a Balanced Bidding strategy. Our results show that PSP leads to larger revenues for the auctioneers (growing with the market size) but also yields a participation nearly as wide as GSP (depend-
214