Keywords- green networking, distributed router architecture, power adaptation. ... To support new generation network infrastructures and related services for a ...
Performance Constrained Power Consumption Optimization in Distributed Network Equipment Raffaele Bolla, Roberto Bruschi, Franco Davoli, Andrea Ranieri Department of Communication, Computer and Systems Science (DIST) University of Genoa Via all’Opera Pia 13, 16145, Genoa, Italy {raffaele.bolla, roberto.bruschi, franco.davoli, andrea.ranieri}@unige.it Abstract— The concept of “Green” and energy-efficient networking has begun to spread over the past few years, gaining an increasing popularity and interest from service and network providers, as well as equipment manufacturers. In this contribution, we propose an analytical framework that can effectively be adopted to optimize power consumption of a network device with respect to its expected forwarding performance. In detail, the proposed analytical framework is specifically designed in order to well suit a heterogeneous set of distributed architectures, generally used for developing today’s network equipment, and ranging from crossbar and line-cards based devices to multi-core SW routers. Keywords- green networking, distributed router architecture, power adaptation.
I.
INTRODUCTION
The concept of “green” and energy-efficient networking has begun to spread over the past few years, gaining increasing popularity and interest from service and network providers, as well as equipment manufacturers. Besides a more widespread sensitivity to ecological issues, such interest also springs from heavy and critical economical needs, since both energy cost and network electrical requirements show a continuous growing with an alarming trend over the past years. For example, as shown in [1] and in [2], energy consumption of the Telecom Italia network in 2006 has reached more than 2TWh (about 1% of the total Italian energy demand), increasing by 7.95% with respect to 2005, and by 12.08% to 2004. Another explanatory example is represented by British Telecom, which absorbed in winter 2007, about 0.7% of the total UK's energy consumption, making it the biggest single power consumer in the nation [3]. Moreover, as evidenced in [4], about 10% of the UK’s entire power consumption in 2007, was related to operating IT equipment. Similar trends can be generalized to a large part of the other telecoms and service providers, since they essentially depend on data traffic volume increase and new services being offered. To support new generation network infrastructures and related services for a rapidly increasing customer population, telecoms and service providers need a larger and larger number of devices, with sophisticated architectures able to scalably perform more and more complex operations. In such an environment, the challenge for network equipment manufacturers is, nowadays, to design new architectures able to scale their performance and functionalities preserving a high level of energy efficiency. In detail, it is well known that networks, links and equipment are provisioned for busy or rush hour load, which
typically exceeds their average utilization by a wide margin [5]. While this margin is generally filled in rare short time periods, the overall power consumption in today’s networks remains more or less constant with respect to different traffic utilization levels. Thus, the key of any advanced power saving criteria certainly resides in dynamically adapting resources, provided at network, link or equipment levels, to current traffic requirements and loads. Despite some interesting scientific contributions (e.g., [6], [7], [8] and [9] among others), green networking performance and optimization remains an open and very interesting issue. In this paper, we focus on power saving mechanisms working at the network equipment level. Our main idea is to introduce inside equipment architecture specific power management mechanisms, able to periodically adapt the packet forwarding capacity to meet expected traffic processing requirements of incoming network/link load. Regarding the power management, we consider two main kinds of hardware support, today available in the largest part of COTS processors and under rapid development in other hardware technologies (e.g., network processors, ASIC [9] and FPGA). These power management mechanisms respectively allow to minimize power consumption when no activities are performed (namely “idle” or “active standby” optimizations), and to modify the trade-off between performance and energy consumption when the hardware is active and performing operations (namely “power state” optimizations). These kinds of power management support are generally realized at the hardware layer by powering off sub-components, or by changing the operating frequency. Unfortunately, these hardware enhancements cannot generally work by switching frequencies and power internal configuration at low time scales (e.g., at packet or at flow time scales). For this reason, we suppose to divide a day in different time slices, during which the link traffic loads have an almost similar statistical behavior. For each time slice, network equipment is thought to adopt a suitable power configuration to optimize the trade-off between the expected traffic forwarding performance and energy waste. In this sense, our main focus in this contribution is to propose a simple analytical framework, which can effectively be adopted to optimize power consumption of a network device with respect to its expected forwarding performance. In detail, the proposed analytical framework is specifically designed in order to well suit a heterogeneous set of distributed architectures, generally used for developing today’s network equipment, and ranging from crossbar and line-cards based devices to multi-core SW routers.
We assume that the distributed router is composed by C hardware elements, which perform data plane operations in a parallel way. We suppose that each one of such elements manages a certain share of the overall forwarded traffic and that can independently switch on different power states, which provide a different tradeoff between data-plane performance and power consumption. In detail, every element is obviously supposed to increase its maximum forwarding capacity, as a more power intensive state is selected. The paper is organized as follows. The optimization problem definition is introduced in Section II, while Sections III and IV show the applied analytical model and the optimization procedure, respectively. Section V reports numerical results, while conclusions are in Section VI. II.
THE OPTIMIZATION PROBLEM
The main objective of the optimization mechanism proposed here, is to minimize the power consumption of a network device, while maintaining a certain performance level. Assuming that each element in the router’s distributed architecture can independently switch its working frequency, in order to modify its own power consumption and its maximum forwarding performance, the optimal router configuration has to be achieved by acting on the working frequency values of , where is the set of admissible each router element working frequencies for the element . Thus, we introduce a cost function Φ , which represents the overall power consumption of the distributed router, and can simply be expressed as the sum of power consumptions of the individual router’s elements. ∑ Φ (1) Φ ,…, We consider Φ as the cost function of our optimization problem, and we minimize its values in a constrained domain, where the minimum performance bounds we want to assure to forwarded traffic are satisfied. In detail, we fix a single set of performance constraints regarding the maximum values of for each router component. Given the packet loss rates distributed equipment architecture, these values can be easily used to determine the loss probability of forwarded traffic flows (as will be shown in sub-section III.C). Thus, we can formulate our optimization problem as follows: min ,…, Φ , … , 2) 1, In order to find the optimal router configuration, we have to ,…, , which guarantees the find the frequency array minimum value of Φ that respects the performance bounds. III.
THE ANALYTICAL MODEL
Our main goal is to develop a high-level analytical model, general enough to capture the behavior in terms of power scaling support and forwarding performance of a quite heterogeneous set of networking equipment architectures (ranging from the classical HW framework founded on a switching matrix and line-cards, to new generation SW routers based on multi-core platforms). Thus, our approach does not aim to describe equipment architecture and performance in detail, but to provide a generic
analytical framework, which well suits in a large set of equipment/networking scenarios. Starting from these considerations, we provide an overall model composed by three simple sub-models that represent traffic, single components and router architecture, respectively. The traffic sub-model represents the traffic offered to the equipment in terms only of average traffic matrix at the per port aggregate layer, related variance and maximum deviation. The single components’ model takes into account how the forwarding performance scales according to the working frequencies and traffic loads. Finally, the third sub-model considers how router elements interact among themselves, in order to obtain the overall router’s behavior. A. Traffic model It is well known that Internet traffic has self-similar and long range dependent dynamics and statistical features, which are hard to be accurately captured at any time-scales by modeling tools. In fact, traffic models usually have complexity levels so high to preclude their effective real-time usage in network equipment. Moreover, a large part of sophisticated traffic models also requires the collection of traffic data and parameters, generally not available to network devices (e.g., packet inter-arrival time, traffic burstiness, etc.). For these reasons, we decided to adopt a modeling approach that works on data and parameters that can be easily provided to routers, and it does not require high computational capacity or memory usage. Moreover, owing to the 24 hours’ time scale variability of traffic load dynamics on Internet links, in many cases rush hours and low utilization time bands can be easily identified. Thus, our approach consists in dividing a day in different time slices, in order to collect and to separately estimate traffic loads, and to calculate an optimized router configuration for each one of such time periods. For the sake of simplicity and without loss of generality, we drop the time slice index in the rest of this paper. In detail, we assume to collect periodical samples, for each network interface (or at least for each router component), inside the same time slice of the instantaneous traffic offered load . Then, for each network port i of router component c, such offered load samples are used to estimate three main , the average value of traffic statistical parameters, namely: offered load; , the variance of traffic offered load; , the peak value of traffic offered load1. We assume the per port instantaneous traffic loads to be random variables independent among themselves. We can write the average value of overall traffic offered load to the router component c as follows: ∑
(3)
where is the set of network interfaces of the component c. From the independence assumptions, we can also express the overall average variance of traffic offered load crossing the router element as follows: ∑
4)
1 The maximum peak rate value is always limited by the bandwidth of the incoming link.
We additionally define the parameter M as the maximum deviation from the average traffic load of flows crossing the as follows: component c. In detail, we can write max
5)
Note that, if values cannot be determined from the router’s internal monitoring counter, they can be replaced with the maximum bandwidth of network interfaces. B. Router component model Since our main aim is to provide a high level model for network equipment components supporting power saving mechanisms, we do not introduce or consider any detailed features of network/forwarding functionalities performed by each router component; rather, we only model some basic aspects, which can easily be adapted to different component HW technologies and architectures. As previously sketched, we assume that each equipment component can work at different internal clock frequencies , where the set includes a limited number of frequency values at which component HW circuits can correctly work2. Each component is supposed to rise its packet processing capacity and its power consumption, as the working frequency value increases. Moreover, we have also to take into account that a large part of HW elements include active stand-by optimizations, which allow reduce power consumption when no activities or operations are performed. Therefore, we completely characterize the performance and the power saving support of the router element c by considering the following three parameters: : the maximum service rate when working at ; • : average power consumption when no activity is • Φ performed inside the router element working at ; • Φ : average power consumption when the router element c performs operation at the clock frequency . Note that all three parameters, introduced above, are strictly dependent on the specific HW implementation and features of the network equipment component. It is reasonable to suppose that both the set of values of working clock frequencies and the related , Φ , and Φ parameters could be directly provided by the manufacturers in the component’s datasheet. However, even if their specific values depend on the are supposed to be component HW, , Φ , and Φ monotonic increasing functions with respect to the frequency . The limit scenarios, where Φ or Φ are constant with respect to the frequency , correspond to the lack of “idle” or “power state” management mechanisms, respectively. Starting from the previous definitions, we can write the average power consumption Φ of a network equipment component, working at the frequency , as the weighted sum of the Φ , consumptions: and the Φ Φ Φ 1 Φ 6) corresponds to the probability The “idle probability” that the component’s packet processing unit is not running any
2 The HW available frequency values are generally a certain multiple of a “base frequency”.
forwarding operations, and 1 is the probability that such operations are being performed. The idle probability can be related to the ratio between the maximum packet processing capacity and the traffic offered load, in terms of packets per second that require header processing. In particular, by assuming that the packet processing unit in a component can be modeled as a single server 3 queuing system, with finite buffer and generic arrival/service time distributions (i.e., a G/G/1/N queueing model), we can express its idle probability as follows: 1
(7)
In order to accurately estimate the traffic loss probability of a certain router component, we would need a detailed model, able to consider the component’s internal mechanisms, and their related features and bottlenecks. However, since our objective is to characterize the router component performance at a very aggregated level, we assume packet loss to be caused only by a limited packet processing capacity. In this sense, the G/G/1/N model aims to only represent packet processing dynamics with respect to a limited component computational capacity, and without focusing on the internal architecture and real packet multiplexing operations. Moreover, in order to represent the packet processing unit, the G/G/1/N model is suitable for a large set of scenarios, owing to the lack of assumptions on both service and arrival time probability distributions. On the other hand, since we cannot obtain a closed-form expression for the loss probability of a generic queueing system, we have to provide and work with upper and and , lower bound approximations, namely respectively. Thus: 8) Regarding the lower bound, from the balance equation of the G/G/1/N queue, we can easily obtain the following relationship: max 0,
λ
μ λ
(9)
In order to find a suitable upper-bound approximation, we decided to use Bernstein’s inequality [10], which belongs to the Chernoff-family theorems that characterize the upper-bound of sums of stochastic variables. In particular, we recall from subsection III.A that: (i) the traffic load offered to the component c is the sum of the flows incoming from its I/O interfaces, (ii) such flows have a stochastic load with expected average value , variance equal to , maximum value equal to equal to , (iii) the instantaneous offered load of each flow has a generic probability distribution. Then, we can apply Bernstein’s inequality as follows: (10) where λ is the instantaneous traffic load offered to the router component c at the time t. Since corresponds to the long-term packet loss probability of an unbuffered queueing system (i.e., N=0), we can easily conclude 3 The single server assumption can be kept for all the HW components that process packets once per time. Otherwise, it possible to extend the definition to multi-server queueing system case, without the proposed model losing its generality.
that:
11) as follows:
and, then, we can fix the
(12) parameter is useful to estimate the While the one can be used to performance constraint in Eq. 2, the find an upper bound for the average power consumption Φ . In particular, starting from Eq. 6, we can determine the following upper bound for the idle probability: 1
and, consequently, also for the power consumption: Φ Φ 1 Φ Φ Φ
(13) (14)
Finally, in order to solve the optimization problem defined in Section II, we can approximate the Φ and the and parameters with the relative upper-bounds Φ . C. The router framework In this sub-Section, we model the overall performance of the network equipment distributed architecture, by taking into account how the different components interact among themselves. With this aim, we consider two main typologies of distributed architectures, which are widely adopted for developing networking equipment (IP routers, L2 switches, etc.). The first architecture considered is the one founded on a switching matrix and line-cards, and it is often applied to highend network equipment with a large set of high-speed network interfaces. The second architecture is the one based on new generation SW routers founded on multi-core processors and COTS hardware [10], which are gaining a growing interest in the last years, thanks to their high flexibility and performance levels. In particular, such different architectures fix how components internally interact among themselves. In a multicore SW router, each core can be thought of as an almost totally independent component, which works in parallel with respect to the other cores (since it performs all the forwarding operations for each received packet). On the other hand, in a crossbar-based architecture each line-card representing a component, generally performs only transmission or reception operations4. In this last case, the loss probability of traffic flows obviously depends on the drop rate of the components being crossed. 1) Crossbar-based architectures As previously introduced, in the case of a crossbar-based architecture, the packet forwarding chain is generally composed by two equipment components that work in series. Thus, for each line-card c5 we can express the traffic offered load as: ∑ 4
15)
In a crossbar based architecture, each traffic flow generally crosses two linecards (i.e., the input and the output ones) as well as the switching fabric. 5 Each line-card is supposed to perform both packet reception and transmission operations for its network interfaces
where is the traffic offered load entering the component c from the interface towards the switching fabric (i.e., the outgoing traffic). Note that the parameter obviously depends on the loss rate of the “first stage” components: if the “first stage” component raises its loss probability, then the parameter of the “second stage” component decreases. Therefore, since the loss probability at a certain component depends on its working frequency, we have to use an iterative optimization mechanism, which recursively calculates: (i) the optimal configuration in terms of working frequency values, individually for each component, that minimize power consumption, while respecting to the performance constraints; (ii) the components’ loss probabilities and, consequently, the values. The recursive algorithm starts by considering new loss probabilities at the “first stage” components equal to zero, and it stops when all the values converge. 2) Multi-core SW Routers Regarding the SW Router platforms, we consider the new generation architectures founded on multi-core processors and advanced multi-queueing network interfaces, like the ones introduced and described in [9] and in [10]. In such architectures, each processor core is able to behave as a completely independent packet forwarding engine, which works in a parallel way with respect to the other cores and processors. In such an environment, we have no interaction among the components of the distributed equipment, and so we can decompose our optimization problem on a per-component basis: ∑ min Φ 16) min ,…, Φ , … , IV.
MINIMIZATION PROCEDURE
For both distributed architectures, introduced in sub-section III.C, the core step of the procedure is the power consumption minimization of each single component. Thus, in order to find the optimal component configuration, we select the sub-set that respect the performance of working frequencies constraint in Eq. 2. To determine , we exploit Eq. 12 as follows: 17) : Thus, for , we numerically evaluate Eq. 14 in order , which guarantees the minimum to select the frequency value of Φ . In order to solve the minimization problem value, we use a “brute and to obtain the minimum Φ force” approach (exhaustive search). However, since the number of working frequencies | | is generally very low (i.e., it does not exceed 10 values in the largest part of HW components and technologies), and since the proposed model is characterized by a very low computational complexity, finding the minimum is feasible even by performing an exhaustive search. In order to provide an example and to deeper discuss the proposed optimization mechanism, let us introduce the following case: a single router component working at the {200 MHz, 400 MHz, 600 MHz, 800 MHz, frequencies 1000 MHz, 1200 MHz}, and with a related maximum loss rate equal to 0.1%. We assume that the packet processing maximum capacity and the active and idle power consumptions of such router component depend on the operating frequency as
, Φ
50
,
120
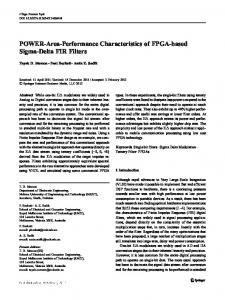
Note that according to [9], we used a component model that linearly scales the performance level with respect to the operating frequency, while its active power consumption increases in a quadratic manner. Regarding the offered traffic value equal to 400, while load, we assume to have a fixed depends on the offered load : 200 . In takes into account that, when the average value of detail, offered load raises, the maximum deviation (in term of maximum gap between the peak and the mean traffic load) obviously decreases. Under such assumptions, we calculated . Fig. 1 from Eq. 14 the upperbound of the cost function Φ reports the Φ values only for the admissible operating frequencies, and outlines how the maximum power consumption is achieved and kept constant when processing =0). capacity is saturated (i.e., Observing Fig. 1, we can underline how a rise in operating frequency does not always correspond to a larger power consumption (e.g., see the Φ values when is equal to 200 MHz). This effect is fundamentally caused by a particular trade-off among the Φ , the Φ and the values, , when the operating since, once fixed the traffic load frequency (and the related processing capacity) decreases, the router component must spend larger time periods in the “active” state in order to process all the traffic packets. On the value contrary, when a higher frequency is selected, the rises and the component remains in idle state for longer periods. Therefore, this outlines how, under certain conditions, selecting a higher operating frequency may lead to a lower energy waste, since it allows to better exploit “idle” power management mechanisms. Regarding the loss probability constraint, Fig. 2 shows the loss probability values estimated with Eq. 12 for each available frequency and according to different traffic loads. Moreover, with the loss by inverting Eq. 12, and by substituting the that constraint , we can obtain the minimum capacity assures the constraint fulfillment: ln
ln
18)
200 MHz 400 MHz 600 MHz 800 MHz 1000 MHz 1200 MHz
240 Power Consumption [Wh]
18
260
220 200 180
, i.e. 800 MHz, 1000 MHz, 1200 MHz . The power consumption related to the can be obtained from Eq. 14, and are equal to about 125.9 Wh, 130.5 Wh and 137.26 Wh, respectively. Thus, in such a scenario, the optimal frequency is the 800 MHz one, which guarantee the constraint fulfillment and a minimum power consumption equal to 125.9 MHz. Note that this minimization procedure has obviously to be performed at least once for each router component (see Section III.C). 1
0.6
0.4
0.2
0 0
0
500
1000
1500
2000
2500
3000
Average Offered Load [kpps]
Figure 1. Average power consumption according to different values of operating frequency and traffic offered load.
Getting back to the optimization problem solution, we fix equal to 1200 kpps, and we exploit Eq. 22 in order to find the minimum processing capacity needed to meet the loss probability constraint: 1806.74 kpps. Therefore, as shown in Fig.3, we can obtain the set by selecting the operating frequencies which guarantee a processing capacity
2500
3000
1% loss constr. 0.1% loss constr. 0.01% loss constr. Offered Load capacity at 200 MHz capacity at 400 MHz capacity at 600 MHz capacity at 800 MHz capacity at 1000 MHz capacity at 1200 MHz
2000 1500 1000 500 0 0
500
1000
1500
2000
2500
3000
Average Offered Load [kpps]
Figure 3. Average offered load, capacities values at different operating frequencies, and forwarding capacities needed to satisfy the loss probability constraint.
V.
NUMERICAL RESULTS
In order to evaluate the proposed optimization mechanism, we decided to use the multi-Core SW router architecture already adopted in [10]. In detail, the used HW platform includes two dual core Xeon processors. Each core can independently work at four operating frequencies, namely 3.0, and 2.667, 2.333 and 2.0 GHz. Table I shows Φ , Φ values at different available referred to a single Core the selected HW platform. The SW router includes 4 Gigabit Ethernet interfaces. Each Core processes the packets incoming from a single Gigabit port.
3000 2667 2333 2000
40
2000
2500
[MHz]
60
1500
3000
TABLE I.
80
1000
Figure 2. Loss probability values estimated with Eq. 12 with respect to different frequencies and traffic loads. g
140
100
500
Average Offered Load [kpps]
160
120
200 MHz 400 MHz 600 MHz 800 MHz 1000 MHz 1200 MHz
0.8 Loss Probability
Φ
2
Traffic Volume [kpps]
400
follows:
POWER CONSUMPTION AND SERVICE RATE PER CORE AND Φ [W] Φ [W] [kpps] 20.5 18 15.75 13.5
45.75 40 33.75 29
985 890 770 670
Regarding the traffic load generation, we used the Agilent N2X router tester to emulate the traffic offered to each ingress link. In order to thoroughly emulate such offered load, we exploited statistical features collected from real traffic traces, captured by monitoring the GARR network [12] during a 30 day period. The optimization framework works on 24 daily time slices, each one with a duration equal to 1 hour. Fig. 4 shows the average values, the deviation, and some “real” samples of traffic load offered to a single Gigabit link, calculated on a per hour basis. Starting from these values, we
1000
140
[kpps]
max thr 2.0 GHz max thr 2.3 GHz max thr 2.6 GHz max thr 3.0 GHz thr constraint estimated std average load load samples
400 200 0 0
3
6
9
12
15
18
21
Hour [h]
Figure 4. Offered load daily statistics (in terms of traffic volume samples, average value and deviation), minimum throughput respecting the loss probability constraint and maximum capacities at the available frequencies.
Power Consumption [Wh]
30
3.0 GHz 2.6 GHz 2.3 GHz 2.0 GHz opt conf
25
20
15
10 0
3
6
9
12
15
18
21
Hour [h]
Figure 5. Estimated power consumption of a core for all the operating frequencies, and consumption of the optimal configuration with respet to time slices.
Finally, by considering all the 4 cores in the SW router and related traffic load statistics, Fig. 6 summarizes the energy saving obtained with respect both to a case without power management mechanisms (where power consumption is always 45.75 Wh), and to a platform not able to scale the operating frequency (and that works at 3 GHz). Such values were reported both for the power consumptions obtained with the proposed model, and for the ones really measured by emulating the SW router behavior for 10 days. Observing Fig. 6, which reports the power saving both for the theoretical values (i.e., estimated with Eq. 14) and the SR router “measured” ones, we can note how the proposed framework allows to effectively reduce the overall power wasting of the SW Router (on a per day basis, we obtain a saving of about 25% with respect to the platform with only the idle optimization, and of about 60% with respect to the one without ACPI). Moreover, note that the proposed model provide a lower bound of the “real” energy saving.
100 80 60 40 20 0 0
3
6
9
12
15
18
21
Hour [h]
Figure 6. Theoretical and measured power saving obtained with the proposed framework with respect both to an equivalent SW router without power management mechanisms, and to another one with the “idle” states.
VI.
800 600
teo vs no opt teo vs idle opt real vs idle opt real vs no opt
120 Power Saving [Wh]
calculated for the associated core (and reported in Fig. 4 with the core capacities at different frequencies) the minimum values of forwarding capacity, needed to satisfy the loss probability constraint (0.01%). In detail, Fig. 4 gives us the chance of indentifying which frequencies can be selected in each time slice without violating the loss constraint. Fig. 5 reports the estimated power consumptions of a single core at different operating frequencies in all the time slices, and the consumption values when the optimization framework is adopted. These last values were estimated through Eq. 14, by using the data in Fig. 1 and in Table I.
CONCLUSIONS
In this contribution, we proposed an analytical framework that can effectively be adopted to optimize power consumption of a network device with respect to its expected forwarding performance. We showed that the proposed approach suits properly different equipment architectures (i.e., multi-core SW routers and crossbar-based devices). The benchmarking results, obtained with a multi-core COTS SW router and real link traffic statistics, point out that the proposed optimization mechanism provides interesting levels of power saving (about 25% with respect to the use of idle states only, and about 60% with respect to the case of no ACPI mechanisms). REFERENCES [1]
Bianco, C.; Cucchietti, F.; Griffa, G., "Energy consumption trends in the next generation access network — a telco perspective," Proc of the 29th International Telecommunications Energy Conference, 2007. (INTELEC 2007), Rome, Italy, Sept. 2007, pp.737-742. [2] Telecom Italia Website, “The Environment”, URL: http://www. telecomitalia.it/sostenibilita2006/English/B05.html [3] BT Press, “BT announces major wind power plans,” Oct. 2007, http://www.btplc.com/News/Articles/Showarticle.cfm?ArticleID=dd615 e9c-71ad-4daa-951a-55651baae5bb. [4] ITWales, “Green evangelist to call for big changes in computer use to aid environment at ITWales conference,” Nov 2007, http://www.itwales.com/997539.htm. [5] The Sprint IP Monitoring Project. URL: http://ipmon.sprint.com/. [6] Noguera, J.; Kennedy, I.O., "Power Reduction in Network Equipment Through Adaptive Partial Reconfiguration," Proc. of the 2007 International Conference on Field Programmable Logic and Applications (FPL 2007), Aug. 2007, pp. 240-245. [7] Gupta, M.; Singh, S.; “Using Low-Power Modes for Energy Conservation in Ethernet LANs,” Proc. of the 26th Annual IEEE Conference on Computer Communications (IEEE INFOCOM 2007), Anchorage, Alaska, USA, May 2007. [8] Nedevschi, S.; Popa, L.; Iannaccone, G.; Wetherall, D.; Ratnasamy, S.; “Reducing network energy consumption via sleeping and rateadaptation,” Proc. of the 5th USENIX Symposium on Networked Systems Design and Implementation, San Francisco, CA, 2008, pp. 323-336. [9] San Martin, R.; Knight, J., "Power-Profiler: Optimizing ASICs Power Consumption at the Behavioral Level," Proc. of the 32nd ACM/IEEE Conference on Design Automation Conference, 1995, pp. 42-47. [10] S.N.Bernstein, "On several modifications of Chebyshev's inequality", vol. 4,22, Doklady Akad, Nauk SSSR, 17, n. 6 (1937), pp. 275-277. [11] Bolla, R.; Bruschi, R., “PC-based Software Routers: High Performance and Application Service Support,” Proc. of the ACM Sigcomm Worshop on Programmable Routers for Extensible Services of Tomorrow (PRESTO’08), Seattle, WA, USA, Aug. 2008, pp. 27-32. [12] The GARR NoC, https://www.noc.garr.it/ GINS/svg/weathermap.php