(APART-2: Automatic Performance Analysis: Real Tools) IST-2001-. 32133 (GridLab: A Grid ..... to monitor both the infrastructure and the application [2] thus, can ...
Performance Evaluation on Grids: Directions, Issues, and Open Problems Zsolt N´emeth, G´abor Gomb´as, Zolt´an Balaton MTA SZTAKI Computer and Automation Research Institute P.O. Box 63., H-1518 Hungary zsnemeth, gombasg, balaton @sztaki.hu �
�
Abstract Grids are semantically different from other distributed systems. Therefore, performance analysis, just like any other technique requires careful reconsideration. This paper analyses the fundamental differences between grids and other systems and points out the special requirements raised to performance analysis. The aim of this paper is to survey the special problems, the possible directions and the existing solutions. A monitoring system, that is able to support the posed requirements is introduced as an example.
analysis, its fundamental problems, their reasons, the main directions, the solved and unsolved issues are summarised. Obviously, there are clear challenges in grid performance analysis due to the size of the infrastructure, its dynamism, application complexity, and so on more or less covered in the literature. The survey presented in this paper is based on a semantic analysis [11] and tries to show that some performance issues do not stem simply of the larger-scale distributed environment but rather, they can be explained by the fundamental semantic characteristics. The Mercury monitor [4] elaborated and implemented in the framework of the GridLab project is shown as an example where the design aimed at supporting the very special requirements of grid performance analysis.
1. Introduction
2. Distributed systems and grids
Although grids are usually viewed as the successors of ”conventional” distributed computing environments, in fact, they are intrinsically, semantically different. This difference in some cases prohibits the application of well established distributed techniques, among them performance analysis, in a straightforward way. In fact, it is not quite clear what ”grid performance” means. Is it the performance of the grid infrastructure? Is it the performance of grid applications? The scope of performance analysis comprises instrumentation, measurement (monitoring), data reduction and correlation, analysis and presentation and finally, system optimisation. Roughly they can be divided as activities for obtaining the performance data and processing the gathered information. While there are several approaches for grid monitoring [1], surprisingly, very little research effort is aimed at analysing the monitored data for getting performance characteristics. In this paper latter aspect of grid performance
Distributed computing is usually carried out on top of a software layer called middleware that virtually unifies the resources into a single coherent hypothetic virtual machine. In the past decade there were some very popular distributed computing environments like PVM [5] and certain implementations of MPI [8]. They were aimed at utilising the distributed computing resources owned by the user as a single parallel machine. Recently however, it is commonly accepted that with the advent of high speed network technology, high performance applications and unconventional applications emerge by sharing geographically distributed resources in a well controlled, secure and mutually fair way. Such a coordinated worldwide resource sharing requires an infrastructure called grid. A conventional distributed environment assumes a pool of computational nodes. A node is a collection of resources (CPU, memory, storage, I/O devices, etc.) treated as a single unit. The pool of nodes consists of PCs, workstations, and possibly supercomputers, provided that the user has personal access (a valid login name and password) on all of them. From these candidate nodes an actual virtual machine is configured according to the needs of the given ap-
�
The work presented in this paper was supported by IST-2000-28077 (APART-2: Automatic Performance Analysis: Real Tools) IST-200132133 (GridLab: A Grid Application Toolkit and Testbed) and Hungarian Scientific Research Fund OTKA T042459.
plication. In general, with a few exceptions, once access has been obtained to a node of the virtual machine, all resources belonging to or attached to that node may be used without further authorisation. The virtual pool of nodes is static since the set of nodes on which the user has login access changes very rarely. Although there are no technical restrictions, the typical number of nodes in the pool is of the order of 10-100. Grids assume a virtual pool of resources rather than computational nodes. The virtual machine is constituted of a set of resources taken from the pool. In grids, the virtual pool of resources is dynamic and diverse where resources can be added and withdrawn at any time according to their owner’s discretion, and their performance or load can change frequently over time. The typical number of resources in the pool is of the order of 1000 or more. Due to all these reasons the user (or any agent acting on behalf of the user) has very little or no a priori knowledge about the actual type, state and features of the resources constituting the pool. The virtual machine of a conventional distributed application is just a different view of the physical layer and not really a different level of abstraction. Nodes appear on the virtual level exactly as they are at physical level, with the same name, capabilities, etc. There is an implicit mapping from the abstract resource needs to the physical ones because once the process has been mapped, resources local on the node can be allocated to it. Users have the same identity, authentication and authorisation procedure at both levels: they login to the virtual machine as they would to any node of it. On the contrary, in grid systems both users and resources appear differently at virtual and physical layers. Resources appear as separated entities from the physical node at the virtual pool. A process’ resource needs can be satisfied from various nodes in various ways. There must be an explicit assignment provided by the system between abstract resource needs and physical resource objects. The actual mapping of processes to nodes is driven by the resource assignment. Similarly, a user of the virtual machine is different from users (account owners) at the physical levels. In a grid a user has a valid access right to a given resource proven by some kind of credential. On the other hand, she is not authorised to log in and start processes on the node to which the resource belongs. A grid system must provide a functionality that finds a proper mapping between a user (a real person) who has the credential to the resources and on whose behalf the processes work, and a local user ID (not necessarily a real person) that has a valid account and login rights on a node. The grid-authorised user temporarily has the rights of local user for placing and running processes on the node. Thus, in these respects, the physical and virtual levels are completely split but there is a mapping in grid between resources and users of the two layers. According to [11] these
two fundamental features of grid called user and resource abstraction constitute the intrinsic difference from other distributed systems. In [11] a formal model is presented where precise definition of the abstraction and the working cycle of conventional environments and grids are introduced.
3. Grid performance analysis 3.1. What is grid performance at all? Historically, performance is simply speed. The fundamental and ultimate goal of parallel processing is speeding up the computation, i.e. execute the same task in shorter time. Unifying distributed resources may have two goals: provide more resources than available locally (quantitative reason) or provide more special resources than available locally (qualitative reason). In the former case resources may be unified to gain speed or to execute significantly larger and more complex problems in the same time frame. In the latter, quality oriented case performance is not related to speed at all rather to resource quality and availability. The motivations, the type of applications and thus, the aspects of performance evaluation may be different at judging the performance of grid applications. Instead of purely concentrating on the speed and speedup, grid performance evaluation is more about examining the assignment of processes to resources over time with respect to required and provided power, capacity, quality, availability and so on and evaluating its appropriateness. For instance, which is a better performance: a powerful supercomputer solving the problem in a few minutes available tomorrow or a cluster working for half a day but available right now. In other words, it should be analysed how well the actual virtual machine is built up of selected resources (just like in case of conventional distributed systems) however, the grid virtual machine does not exist prior to execution and very likely, it will not exist a second time in exactly the same form with the same characteristics. The aim is to find the ”best” resources for a certain execution and check if a resource sustains its ”best” qualification during execution but the definition of ”best” varies from application to application. Future grid implementations will include accounting mechanisms too, therefore, it will be also an aspect at evaluation what the price is for a certain performance and quality. There have been economic models already that try to solve resource brokering based on economic models [6] thus, yielding a self-controlled balance between price and the quality of offered services.
3.2. Why is it hard to evaluate grid performance? Usual performance analysis techniques are not necessarily applicable for grids in a straightforward way since the
performance of a virtual machine should be analysed while certain physical characteristics can be measured only. The user utilises a virtual machine and tries to get an answer if the execution speed is acceptable, if the machine provides the anticipated capacities, if the application is well designed, realised and mapped, if there are no abrupt changes in the progress and so on. On the other hand, there are physical characteristics about certain resources forming the virtual machine. These physical metrics are sometimes hard if not impossible to compare, combine and calculate the performance metrics for the virtual level. As it was introduced, grids and conventional distributed systems, more precisely, the way how these environments form virtual machines are semantically different that implies technical differences, too [11]. Both the semantic and the technical aspects appear at listing the challenges of performance evaluation. 1. Observation, comparison and analysis are significantly more complex due to the diversity, heterogeneity and dynamic nature of the resources that form a virtual machine. 2. Grid applications are executed on a virtual machine that does not exist prior to execution. Due to the lack of exact a priori information about the abstract machine, performance is not characteristic to an application rather to the interaction of an application and the selected resources, i.e. subset of the infrastructure. 3. The fact that grid provides a mapping between abstract and physical resources and this mapping is performed on dynamic and diverse entities introduces more possible performance flaws than in conventional distributed systems. Their characteristic symptoms must be defined in order to detect them at performance analysis. 4. Usual metrics and characteristic parameters are not necessarily applicable or not sufficiently expressive for grids. It is also a question if resource characteristics do have meaning at the virtual level. Novel and emerging grid applications possibly need different terms of performance. 5. The significantly larger event data volume needs careful reduction, feature extraction and intelligent presentation. For the same reason, instead of gathering trace data, there is a need for local preprocessing. Due to the larger information content and longer runs, human observation is less effective and feasible than advanced automatic analysis. 6. The infrastructure thus, the execution environment changes dynamically from run to run and possibly during a run. Therefore post-mortem, off-line analysis techniques have less use than on-line, semi on-line ones.
7. Performance tuning and optimisation is difficult due to the permanently changing environment and unrepeatable experiments. The only way to effective control performance is on-line active steering. In the followings some of these issues are explained in details.
3.3. Potential performance problems in grids The performance problems in parallel/distributed systems have been well studied [9]. All those problems of parallel/distributed systems are present in grid applications, too. Grid applications however, can have further sources of performance degradation: The resource requests of the processes can be satisfied in many ways. It is the task of an external (wrt. to the application) agent (e.g. broker) to establish a proper mapping between the specified resource needs and the available physical resources. The performance is substantially determined how appropriate (wrt. specifics, availability, performance, price, etc.) resources are assigned to the processes. Some performance characteristics of the utilised resources may change over time (e.g. changes in load, priorities, availability, etc.) The fact that resources are shared may induce frequent, abrupt and unpredictable changes. The synchronous availability of resources is not guaranteed. Co-allocator agents may help with eliminating this problem yet, it cannot be assumed all the requested resources are available at startup. The availability may change during execution, too. Embarrassingly parallel applications are completely insensitive to this problem whereas a number of application classes may suffer serious performance degradation if one of their processes is starving. The exhaustive list of potential performance problems of grid applications together with their characteristic symptoms has not been explored and need extensive practical experimenting. Grid performance analysis should focus on the specific grid related problems assuming that other sorts of possible performance bottlenecks have been tested and eliminated in smaller-scale tests on parallel computers or clusters.
3.4. Performance metrics, performance characterisation Although one can simply speak about high or low performance in fact, performance of an application has many aspects and it depends on many possible parameters like CPU
power, network speed, cache efficiency, scheduling policies, communication scheme and various others. Performance metrics are derived from raw event trace, profiling or other data produced by the monitoring system. A metrics as a quantity must be comparable, interpretable and must have expressive power. For instance, [16] lists the following performance metrics: percentage usage of CPU as idle, in user mode and in kernel mode, number of CPU context switches, number of interrupts, number of system forks, logical/physical disk reads, logical/physical disk writes, network packets received, network packets sent. In a single parallel system these quantities are comparable, they can be interpreted within the architectural framework and have enough expressive power to decide whether a given performance figure reaches the desired threshold. As soon as heterogeneity is introduced into the virtual machine and grids are ab ovo heterogeneous, some of these metrics loose their meaning. A metrics, e.g. 65% CPU idling, cannot be interpreted without an architectural framework. The diversity of grid resources make it necessary to establish uniform grid metrics where interpretation and comparison are possible. The problem is related to the semantics of the grid: grid resources are virtualised, therefore grid metrics should be separated from physical metrics and represent a higher level of abstraction. From performance metrics characterisation of applications are possible. For instance, the most simple and straightforward characteristic parameters of a parallel application are speedup, efficiency, parallelisability and granularity. These values give sufficient information to describe the application globally. These parameters can be applied in conventional distributed environments however, they are not really useful in grids. The running environment, the utilised resources change from run to run and even more, possibly during a single run. Therefore strict numerical values cannot describe an application globally. Speedup, for instance, in the usual sense is not descriptive for a grid application consisting of parallel tasks.
other hand, can point out the weakness and the power of a certain system. Applying the original benchmark philosophy for grids however, may be misleading due to the following reasons: The actual virtual machine is composed of the selected resources according to some criteria and does not exist prior to execution. Therefore, the result of benchmarking is representative for that particular virtual machine and not for the entire grid. The virtual machine is not necessarily the same for every consecutive run. Even if the same resources are selected, the characteristics of the resources may change abruptly. From the benchmark result of an application one cannot predict the performance of future runs of the same application. From the benchmark result of a certain virtual machine (i.e. a subset of resources) one cannot estimate the performance of the grid (grid in this sense is the entire virtual pool).
3.6. Interaction of application and infrastructure Obviously, performance is determined by the application and the computing infrastructure. In a usual way however, the monitoring and analysis of the physical resources is typically omitted since its main characteristics are well known to the user and their changes are less substantial and can be traced easily. This is not the case for grids. Performance evaluation in grid can be carried out by taking into consideration both the characteristics of the application and the infrastructure and their changes over time. This problem of dynamic computational substrate has been expressed as “The performance sensitivity of current parallel and distributed systems is a direct consequence of resource interaction complexity and the failure to recognize that resource allocation and management must evolve with applications, becoming more flexible and resilient to changing resource availability and resource demands” [14].
3.5. Benchmarking 3.7. Trace data Benchmarks are aimed at comparing the capabilities of computer systems. Detailed features of computers (e.g. processor architecture, cache management, etc.) can hardly be compared or evaluated to decide which one is ”better”. Solving a well defined set of problems, i.e. benchmarks on these machines can do this comparison. A single benchmark can give an overall judgement for the system and hides the low level details. A well selected set of benchmarks (i.e. each is sensitive to some of those hidden details), on the
Usual analysis techniques assume an (partially) ordered list of events that relies on a (virtual) global common clock. “The implementation constraints for profiling, counting, interval timing and event tracing all differ, yet they have certain common implementation needs. Of these, the most important is a high-resolution, low-overhead global clock. Without a high-resolution global clock, it is not possible to correlate events that occur on disparate processors.” [12].
The clocks of distributed systems can be synchronised provided that messages between two nodes have the same propagation time, messages arrive in the same order as they are sent, etc. In such cases the precision of clock synchronisation is in the magnitude of communication time which is acceptable in case of a cluster. In a grid however, one cannot made such assumptions since, clocks are either coarsely synchronised or should be assumed that they are not synchronised at all. One of the crucial issues in performance analysis is handling high volume of trace data. It either represents a technical challenge: how it can be gathered, sorted, transfered, stored, etc., and a semantical one: how the relevant data items can be isolated and how the performance features can be observed from the data. This issue exist in a more severe form in grids due to the (potentially) significantly larger number of resources and processes. The volume of trace data is proportional to the number of processes , the dimension of performance metrics and time . There are two statistical approaches for trace data reduction: clustering tries to reduce , whereas projection reduces . �
�
�
The aim of dynamic statistical clustering [12][10] is finding processes with similar temporal performance trajectories, i.e. identifying behavioral equivalence classes. After clustering performance data for representative processes must be recorded in each equivalence class or cluster (and data for those processes that are out of any cluster) [10]. Dynamic statistical projection pursuit, on the other hand, identifies interesting performance metrics (dimensionality) and in turn can dramatically reduce data volume and perturbation [16]. If performance is described in an ndimensional metrics space, projection pursuit identifies a smaller set of orthonormal vectors. The largest components of these projection vectors represent the most successful (significant, interesting) metrics. �
In a grid environment however, due to the inhomogeneity of the utilised resources even processes executing the same code may differ significantly and have different performance characteristics that may jeopardise the effectiveness of clustering. On the other hand, projection pursuit is able to show the significant differences of traces of equivalence classes separated by a clustering procedure. In this respect the two methods are complementary. The data volume can be reduced with respect to the parameter, too. A continuous quantity is transformed into a metrics by sampling. Obviously, lower sampling frequencies can reduce the data volume. Alternatively, the measured quantity over a certain time frame or a certain number of samples can be represented by some statistical properties, e.g. mean, median, minimum or maximum values, etc. that also yields data reduction. �
3.8. Optimisation, performance tuning The aim of performance analysis of parallel programs is to enhance their performance by (partly) rewriting the code, modifying some algorithms or the compiler. Thus, the result of a performance analysis will appear in future runs of the same application. Due to the non-replayable property of a grid application, this approach is not viable on a grid. “[...] this a posteriori tuning model is ill-suited to complex, multidisciplinary applications with time varying resource demands that execute on heterogeneous collections of geographically distributed computing resources.” [13]. Instead, there are two alternatives for grid applications: active, on-line real-time performance tuning, steering or modifying the strategy how the virtual machine is built up. The former approach can improve the performance of the application during the same run. The latter does not improve the performance of the actual application but can improve the average performance of future executions. Interactive steering of programs is the on-line configuration by algorithms or by human users, with the purpose of affecting the program’s performance or execution behaviour [7]. Steering may comprise of automatic configuration of small program fragments, adaptation of program components in real-time applications or application specific actions like changing the decomposition geometry, shifting the decomposition boundaries or replacing expensive operations with less accurate ones [7].
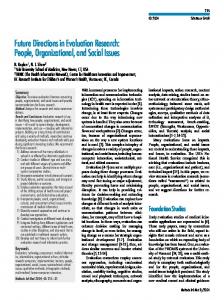
4. The Mercury monitor Performance analysis requires a monitoring entity that is able to provide necessary data related to the execution. As it was shown before, the semantical difference between grids and conventional distributed systems poses special problems. In the following the Mercury monitor is introduced as an example and its special features are highlighted that can support high level analysis. Details about Mercury and its implementation can be found in [4][2][3]. The Mercury monitor has a layered structure (see Figure 1) consisting of Local Monitors (LM), Main Monitors (MM) and Monitor Service (MS). At the lowest level sensors connected to processes (P) get actual measured data that is gathered by LMs for a single node. This producerconsumer relationship is then repeated at LM-MM and MM-MS levels allowing the separation of local and grid metrics. Local metrics are those that are directly measured on a resource and are highly dependent on the physical parameters. They can be transformed by MMs into metrics that are interpreted within a site and these metrics can be further transformed into grid metrics by MS. The layered structure also allows preprocessing specific to each level. In such a way raw trace data are not necessarily presented to
Submitter Grid User Grid Resource
Jobmanager
MS
LRMS
LM
MM
LM P
LM P
P
Figure 1. Architecture of the Mercury monitor
the user rather, filtered, extracted and uniform information is transfered to higher levels. Realisation of sensors may be resource and site specific allowing the most suitable data reduction and transformation. The Mercury monitor is able to monitor both the infrastructure and the application [2] thus, can support the co-analysis of these entities. Application monitoring poses special requirements since these entities may reside on different sites, may migrate and are vulnerable. The Mercury monitor specifies an architecture but it is flexible to handle the dynamic and heterogeneous nature of grids. For instance, sensors and actuators can be easily added to the monitor according to local needs, and similarly, the realisation of LM and MM can be node and site specific. The aim is to provide a transparent and controllable service for the user at the MS interface. The key ideas in the architecture of Mercury with respect to the challenges of grid monitoring are summarised in the followings. 1. Simultaneous monitoring of the application and the infrastructure. In grid environments it is crucial that the infrastructure can fundamentally determine the performance. Therefore, resource or job monitors alone are not sufficient to solve a complex performance analysis. The notion of sensors is independent of the entity they are measuring and therefore, Mercury supports monitoring both resources and jobs however identifying the jobs at different levels needs support as follows. 2. Conversion between virtual and physical levels. Processes are identified locally by the operating system by process identifiers (PIDs). The local resource management system (LRMS) controls jobs running on hosts
belonging to a grid resource. It allocates hosts to jobs, starts and stops jobs on user request and possibly restarts jobs in case of an error. The LRMS identifies the job it manages by a local job identifier (LJID). To monitor a job the relation between LJIDs and PIDs must be known. This is required because some metrics (e.g. CPU usage and low level performance metrics provided by hardware performance counters) are only available for processes, while other metrics (such as high level job status) can only be get from the LRMS by the LJID. The LRMS is the only component that has all the information about which processes belong to a job, thus it should have an interface for the monitoring system to provide the mapping between PIDs and LJIDs to support monitoring. In practice however, current LRMS implementations usually do not provide such an interface thus another way to get the mapping between PIDs and LJIDs is necessary. The jobmanager in Figure 1. represents the grid service, which allows grid users to start jobs on a grid resource. The easiest and most secure way to identify processes belonging to a job is to start each job under a different user account distinct from accounts used by other currently running grid jobs. A free user account can be taken from a pool of accounts that are reserved for running grid jobs. In this way, processes of a job can be identified by the user ID. The jobmanager also allows the user to control the execution of the job. To reference jobs started by the jobmanager yet another identifier the grid job ID (GJID) is used. The jobmanager maintains the mapping between GJIDs and LJIDs and must provide an interface for the monitoring system to get this information together with the user ID that is assigned to this job. The multi-level setup of the monitoring system is useful for making this mapping transparent. When a grid user connects to the MS and requests monitoring of a grid job by a GJID, the MS can convert the GJID to a LJID and pass it to the MM. The MM then converts the local job ID to a user ID and passes it to the appropriate LMs that take the actual measurements. 3. Grid metrics. As it was introduced in 3.4, measurable quantities may have different meaning at physical and virtual levels. An early report on Mercury [3] proposes the separation of local and grid metrics. Local metrics are those that are directly measured on a resource and are highly dependent on the physical parameters while grid metrics are derived from one or more local metrics by applying a specific, well defined algorithms to them. The layered structure of Mercury and the monitoring agents make it possible to separate grid metrics form the physical characteristics of the resource. Note, that Mercury does not specify any metrics just
provides a framework where they can be defined and transformed. 4. An infrastructure for data preprocessing. Similarly to the support of grid metrics, where the meaning of data is transformed, any other sort of data processing can be introduced in Mercury. In such a way the raw data got from the sensors can be completely hidden from the user by highly structured, processed information. 5. Active steering. Monitoring is an information flow from the sensors to the users. If this flow is reversed, control can be propagated from user to the components of the monitoring system or to the actuators at the lowest level. The flexible structure of Mercury allows the addition of any specific actuator and control flow.
5. Related work This paper aimed at summarising the special problems and requirements of performance analysis in grids based on a semantic approach. These issues have appeared in other works yet, there is no system or proposal that has solved all of them. The existing solutions are surveyed here. The application signature model presented in [18] introduces the application intrinsic metrics solely dependent on the application code and problem parameters that expresses the demands the application places on resources. The application signature is a trajectory in the n-dimensional metric space. The achieved application performance is represented by the execution metrics and the execution signature is a trajectory in the execution metric space the application traces through. The execution metrics reflects both the application demands on the resources and the response of the resources to those demands. Such signature scheme has been developed for CPU and network performance. Although they address well the problem of application and infrastructure coanalysis, these metrics are just one of the possible divisions of performance to application signature and a scaling factor. There is no solution for universal grid metrics. The most advanced proposal suggests that instead of strict and exact numerical values, less rigorous symbolic control could be adequate for grids: “Although sensors provide the quantitative data needed [...], our experience [...] has shown that qualitative data on current and future resource demands is an effective complement” [14]. Autopilot uses qualitative data (fuzzy values) for interactive steering but does not address explicitly the possibility of qualitative or symbolic metrics. The proposal for grid benchmarking in [15] has two important findings: Grid applications have necessarily a different structure than the conventional distributed ones. According to
the workflow idea grid applications are composed of larger chunks of computation and there is a data or control dependency between them. The Computationally Intensive Grid Benchmarks (CIGBs) try to grasp those details of a grid infrastructure that are relevant from performance point of view. In this way this set is able to detect and spot various performance problems. Yet, the application of grid benchmarks is questionable as it was explained in 3.5. Autopilot realises dynamic optimisation by integrating instrumentation with resource policies and decision procedures [17]. Distributed sensors capture quantitative application and system performance data. Software actuators can enable and configure application behaviour and resource management policies. Both sensors and actuators are placed into the source code. Actuators at run time are controlled by fuzzy logic decision procedures based on the performance sensor data. The quantitative performance data is transformed by the qualitative behavioral classification tools based on hidden Markov models and neural networks to describe certain behaviour patterns. Applicability of Autopilot has been tested at realising a Portable Parallel File System (PPFSII) [17]. On-line program steering assumes that application builders write their code such that steering is possible, users provide performance information necessary for steering decisions, the latency of such information is less than the required rate of steering [7]. This assumption however, does not hold for grid applications at the present.
6. Summary The aim of this paper is to survey the possible challenges of grid performance analysis above the monitoring level, the existing solutions and possible directions. First the fundamental semantical differences of conventional distributed systems and grids were discovered. Due to these fundamental differences, usual approaches do not necessarily work or are not effective in a grid environment. Grids open a way for novel applications and their diversity makes it necessary to redefine performance. Accordingly, performance metrics and performance characterisation have a new dimension, too. The heterogeneity and the dynamics of the infrastructure, the large number of resources and processes, the lack of any a priori knowledge about the virtual machine poses technical challenges that were listed in this paper. There are some approaches to tackle with some of these problems but there are no existing systems that have addressed all these issues. These high level analysis issues must be supported at a lower level by monitors. The Mercury monitor was introduced as one of the example systems that is capable of supporting the requirements of grid performance analysis.
References [1] Z. Balaton, P. Kacsuk, N. Podhorszki, F. Vajda: Comparison of Representative Grid Monitoring Tools. Report of the Laboratory of Parallel and Distributed Systems, LPDS-2/2000. http://web.datagrid.cnr.it/pls/portal30/docs/1445.PDF [2] G. Gomb´as, Z. Balaton: A Flexible Multi-level Grid Monitoring Architecture. 1st European Across Grids Conference, Universidad de Santiago de Compostela, Spain, Feb. 2003 [3] Z. Balaton, G. Gomb´as: D11.2 Detailed Architecture Specification. GridLab-11-D11.2-01 internal report, 2002. [4] Z. Balaton, G. Gomb´as: Resource and Job Monitoring in the Grid. Proceedings of 9th International Euro-Par Conference, Klagenfurt, Austria, 2003, pp. 404-411. [5] A. Geist, A. Beguelin, J. Dongarra, W. Jiang, B. Manchek, V. Sunderam: PVM: Parallel Virtual Machine - A User’s Guide and Tutorial for Network Parallel Computing. MIT Press, Cambridge, MA, 1994 [6] R. Buyya, D. Abramson, J. Giddy: An Economy Driven Resource Management Architecture for Global Computational Power Grids, The 2000 International Conference on Parallel and Distributed Processing Techniques and Applications (PDPTA 2000), Las Vegas, USA, June 26-29, 2000 [7] W. Gu, G. Eisenhauer, E. Kraemer, K. Schwan, J. Stasko, J. Vetter: Falcon: On-line Monitoring and Steering of Large-Scale Parallel Programs. Technical Report GIT-CC94-21, College of Computing, Georgia Institute of Technology. ftp://ftp.cc.gatech.edu/pub/coc/tech-reports/1994/GITCC-94-21.ps.Z [8] W. Gropp, E. Lusk, A. Skjellum: Using MPI: Portable Parallel Programming with the Message Passing Interface. MIT Press, Cambridge, MA, 1994. [9] G. Haring, C. Lindemann, M. Reiser (eds.): Performance Evaluation: Origins and Directions. Springer State-of-theArt Survey, 2000. [10] O. Y. Nickolayev, P. C. Roth, D. A. Reed: Real-time Statistical Clustering for Event Trace Reduction. Journal of Supercomputing Applications and High-Performance Computing, spec. issue, Vol 11., No. 2., pp. 149-159. [11] Zs. N´emeth, V. Sunderam: Characterizing Grids: Attributes, Definitions, and Formalisms. Journal of Grid Computing, Vol 1 No 1, 2003. pp 9-23. [12] D. A. Reed: Experimental Analysis of Parallel Systems: Techniques and Open Problems. Proceedings of the 7th Int. Conf. on Modelling Techniques and Tools for Computer Performance Evaluation, Vienna, May 1994, pp.25-51. [13] R. L. Ribler, J. S. Vetter, H. Simitci, D. A. Reed: Autopliot: Adaptive Control of Distributed Applications. Proceedings of the 7th IEEE Symposium on High-Performance Distributed Computing, Chicago, IL, July 1998. [14] R. L. Ribler, H. Simitci, D. A. Reed: The Autopilot Performance-Directed Adaptive Control System. Future Generation Computer Systems, Spec. Issue on Performance Data Mining, 18(1), September 2001, pp. 175-187. [15] R.F. Van der Wijngaart, M.A. Frumkin: Computationally Intensive Grid Benchmarks. GGF Working Document, January 2003
[16] J. S. Vetter, D. A. Reed: Managing Performance Analysis with Dynamic Statistical Projection Pursuit. Proc. of SC’99, Portland, OR, Nov. 1999. Electronic publication http://wwwpablo.cs.uiuc.edu/Publications/publications.htm [17] J. S. Vetter, D. A. Reed: Real-time Performance Monitoring, Adaptive Control and Interactive Steering of Computational Grids. The International Journal of High Performance Computing Applications, Vol 14., No. 4., 2000, pp. 357-366. [18] F. Vraalsen, R. A. Aydt, C. L. Mendes, D. A. Reed: Performance Contracts: Predicting and Monitoring Grid Application Behavior. Proceedings of the 2nd Int. Workshop on Grid Computing GRID 2001, Denver, Colorado, Nov. 12. 2001, LNCS 2242 Springer, pp. 154-165.