to the organization's strategy towards its business goals over the coming. 3 years. ..... The new structure proposes a Supervisory role for the corporate office with.
Performance Management System - GEB 1. Purpose Purpose: The purpose of this document is to outline the basic concepts around which the Performance Management System of GEB is to be based. 2. Philosophy of Performance Management System:
The Performance Management System is intended to inculcate a culture of performance orientation, accountability and transparency within the organization. The emphasis of this system is on planning for performance coupled with regular reviews and mid course corrections. The emphasis of all reviews is on learning and improving performance.
The Performance Management System captures the “What” of Performance as well as the “How” of Performance. The Individual Key Performance Indicators (KPIs) and achievements along these will capture the “What” of performance. The organizational competencies and performance along these will capture the “How” of performance. 3. Link between individual KPIs and Unit KPIs KPIs: An important element of the recommended system is the linkage between the Unit KPIs (as have been set) and the individual KPIs. Based on the individual areas of performance defined by the Role and Responsibility Statement for each Role, these KPIs will need to be developed for each role. Measures for capturing performance along these KPIs must be clearly articulated. 4. Key Organizational Competencies:
4.1. Each unit needs to clearly articulate a few competencies that are critical to the organization’s strategy towards its business goals over the coming 3 years. (Examples of competencies would be cost consciousness,
Krishnan Umachandran
innovation, planning and organizing).
4.2. A competency is defined as skills and abilities defined in behavioural terms that can be developed and that will be critical to successful individual or corporate performance. Unit competencies are usually core to a firm’s ability to develop and sustain competitive advantage 5. Stages of Performance Management System: 5.1. Performance Planning Stage Stage: The Unit KPIs are divided into individual KPIs. The levels at which various responsibilities rest must be clearly articulated, along with the metrics that will be used to capture these. The organisational competencies chosen to be strengthened must be clearly articulated and defined. This phase is critical in being able to set the right direction and goals and in being able to clarify the expectations from each role holder. This system is also critical for creating a “buy- in” into the entire Performance Management System. 5.2. Performance Feedback Stage: Continuous feedback along the KPIs needs to be provided to the individual role holders. Much research had shown that individuals are able to monitor their own progress much better through the availability of continuous (and Impartial) metrics that capture performance. Continuous feedback and discussions around performance roadblocks (organizational or individual) will allow for mid course corrections. It is important that the organization and managers understand the systemic roadblocks to performance and attempt to remove these early in the performance cycle. At the same time analysis by the role holder on his or her performance on a continuous basis is far more helpful than taking stock only once a year. 5.3. Performance Appraisal Stage Stage: This is the stage when a formal review of the performance during a particular cycle takes place.
Krishnan Umachandran
5.3.1. Performance Appraisal Cycle Cycle: For the first Performance cycle using the new system, it is suggested that the performance cycle remain annual, with a mid term review . 5.3.2. Role of HR: 5.3.2.1.
HR must communicate widely the form and substance of the
new appraisal system, and continue to train persons on the new system till it is well understood through out. Experience with several organizations has shown that the success of performance management systems rests very strongly in the extent to which the system is understood and the required skills are developed. Since the recommended system is very different from the earlier system of confidential reviews, it is expected that considerable training of people on this system will be required for its success.
5.3.2.2.
At the time of mid term reviews or annual appraisals, HR will
initiate the cycle by reminding appraising managers and appraisees of their individual roles in the process and the key elements that lie behind the philosophy of appraisals.
5.3.2.3.
All completed performance appraisal formats will need to
come back to HR. HR will maintain these in the required personnel files. 5.3.3. Role of the Appraiser Appraiser: The appraiser is usually the manager of the employee and has a role to play throughout the performance management cycle.
Krishnan Umachandran
5.3.3.1.
During the Performance Management Stage, the manager
needs to provide clear KPIs and their measures to his reportee.
5.3.3.2.
During the performance feedback stage, (i.e. during the
course of the Performance Cycle) the manager needs to provide continuous feedback to the appraisee about performance. This may be in the form or regular availability of data around the Individual KPIs, and ongoing informal discussions of performance. At the same time the manager must extend all organizational support that the role-holder may require to perform his or her role well.
5.3.3.3.
During the performance appraisal stage, the appraising
manager needs to review the KPIs of the year and use these for rating the performance of the role holder. At the same time, he will need to appraise the role holder on the competencies displayed by him during this period.
5.3.3.4.
It will usually be the responsibility of the appraising manager
to set up the time for the appraisal meeting. It will also be his responsibility to ensure that during the interview there are no interruptions and that to the extent possible, the discussions happen in a non threatening manner.
5.3.3.5.
Once the appraisal discussion takes place, the appraising
manager needs to understand the views of the appraisee and then decide on the final rating. This needs to then be communicated to the appraisee by the appraiser.
5.3.3.6.
With the end of one performance cycle, the next one begins,
and the appraising manager will need to once again get involved
Krishnan Umachandran
in the performance planning phase of the next performance management system. 5.3.4. Role of the Appraisee Appraisee: The appraisee has an active role to play through the performance cycle .
5.3.4.1.
During the Performance Planning Phase: During the
performance planning phase, the appraisee needs to understand the performance expected by him as well as the competencies required of him. The role holder must ask questions that may be needed to clarify expectations. Organizational support required for the KPIs should be discussed with the appraising manager.
5.3.4.2.
During the Performance Cycle: Continuous self monitoring of
performance along KPIs and competencies. Any difficulties should be discussed with appraising managers. The appraisee should regularly ask for feedback if it is not being given
5.3.4.3.
During the appraisal discussion: The success of this stage
also depends on the appraisee’s ability to understand what he or she needs to do differently in order to do better in the next appraisal cycle. The appraisee needs to be able to put forth differences in opinion a forthright manner. 6. Performance Incentives: After one round of the performance cycle according to the new system is successful, and the system is well understood and accepted by employees, the organization can then add performance incentives to reward those role holders who have performed well. The incentive scheme will have to be designed in detail. Typical schemes have a percentage of PAT available for incentives which are distributed according to performance along pre-agreed parameters.
Krishnan Umachandran
7. Advantages of described performance management system:
7.1. The process of performance planning and breaking the unit KPIs to Individual KPIs allows clarity for how much accountability lies at which level in the organization.
7.2. Individual KPIs clearly articulate to each role holder what is expected from him and how his performance will be measured.
7.3. The process of defining organizational competencies will require each unit to answer basic questions such as : What is the primary basis for our competitive advantage? Which abilities or skills need to be developed throughout the organization for its business objectives to be met.
7.4. Clarity in competencies to be developed provides the entire organization with the direction of movement that will enable the business objectives to be met. In a sense the direction can serve to bind an organization together.
7.5. Constant feedback on KPIs and blocks to performance achievements allows for mid course changes in systems.
7.6. This system has a strong sense of transparency, as each role holder is aware of how he will be appraised and why.
7.7. The continuous feedback, mid term review and annual appraisal discussions are two way communication processes so that feedback is given to the role holder, and the role holder solicits the support he needs .The manager plays an active role in preventing performance problems from getting out of hand.
Krishnan Umachandran
7.8. All elements in the discussed Performance Management System are directly linked to organizational performance. 8. Possible areas of difficulty: The greatest difficulty initially may be in introducing the concept of evaluation of performance (as against the earlier concept of evaluation of persons abilities) . Employees may feel threatened by the “measurement” of their performance so clearly. A second difficulty may be in the lack of skills required to be able to manage the entire performance cycle: planning, feedback and appraisals. 9. Solutions to the above:
9.1. Before the system is formally introduced sufficient communication across the organization on the objectives of the performance management system; its methods and philosophy must take place.
9.2. Extensive training to develop the skills required (of performance planning, giving feedback, conducting reviews) amongst appraising managers in particular. The organization may either do this internally or work with external consultants for this.
9.3. The concept of performance planning, discussions and reviews as a management system ( and not just an HR system) needs to be focused on by the leadership.
Krishnan Umachandran
TIMELINES 10. Phased Implementation of Performance Management System System: Given the nature of transition from the present system to the new Performance management system, the phased implementation of the new system in the following manner is recommended.
Jan 2004. Reviews for previous year to be based on old system, however discussions of new system to take place.
By March 2004. First exercise of detailed Performance Planning to take place. The exercise of individual KPI mapping and Competency Mapping should be completed so that role holders are familiarized with performance expectations.
June – July 2004- First set of mid term reviews along KPIs and competencies to take place
Jan 2005- First Appraisal process according to the new performance management system. Any modifications required / bugs in the system be sorted out.
June 2005- mid term reviews
Jan 2006/7- Incentive Plans may be added to the performance management system to reward good performance.
Krishnan Umachandran
Empowerment.- Delegation of Powers Employee empowerment is a two sided coin. For employees to be empowered the organization must want and believe that employee empowerment makes good business sense and employees must act. Employee empowerment does not mean that management no longer has the responsibility to lead the organization and is not responsible for performance. Effective leadership and accountability is demanded in an organization that seeks to empower employees. This starts with the executive leadership, through all management levels and includes front line supervisors. It is only when the entire organization is willing to work as a team that the real benefits of employee empowerment are realized. For an organization to practice and foster employee empowerment the management must trust and communicate with employees. Employee communication is one of the strongest signs of employee empowerment. Honest and repeated communication from elements of the strategic plan, key performance indicators, financial performance, down to daily decision making. If an organization has not been actively cultivating employee empowerment, it may take considerable time and effort before employees start to respond. Often the first efforts and communications are met with employee derision and mockery. Those who are only interested in trying the latest management fad will give up when met with this response. When considering employee understanding and acceptance of decisions consider how long it takes for the management team to discuss and then make a decision. For management wanting employee empowerment the evidence will not come across the board with wide spread acceptance. A small number will accept the invitation to become more involved. The rest will be watching every move to see what happens. Every communication, decision and action by management will be viewed as either supporting a move to employee empowerment or not. Probably nothing demonstrates the commitment or lack of commitment to employee empowerment more than promotions and selection for leadership positions. Employees know those that attempt to “shine up while dumping down”. For an organization to enjoy the returns from employee empowerment the Organization must diligently work to create the work environment where it is obvious to all that employee empowerment is desired, wanted and cultivated. Management’s responsibility is to create the environment for employee empowerment. When organizational leadership has started to take actions to
Krishnan Umachandran
encourage employee empowerment it is then up to the employees to decided if they wish to take advantage of the opportunity or not. It is not unusual for only a small minority to accept the challenge initially. Also it is very likely that some fraction will never respond. It is the large middle group that must be convinced to practice employee empowerment. It is our conviction that most organizations have exactly the level of employee empowerment the management wants. This is demonstrated by the amount of communications, level of training provided employees, opportunities for personal growth, the solicitation and implementation of ideas, the recognition and reward system, promotion and advancement criteria, and uncountable little signals from management that demonstrate whether employees are valued or not. One of the strongest signs from employees is when they take the lead to advance their skills and knowledge with education and training either provided by the organization or out side the organization. Management has the obligation to create the environment that fosters employee empowerment, employees have the duty to accept the opportunity and demonstrate they are willing and capable. Employee motivation and employee empowerment are part of employee development Every business and work process eventually requires that employees make decisions to do the right thing. For employees to act appropriately there must be employee motivation that is a natural growth from employee development and employee empowerment. As human beings we are all created with a free will and the capability to make decisions. When employees are not making the correct decisions, no matter how good the process or system, problems will soon develop. Active employee development and employee empowerment will help create the environment where employee motivation can develop so more of these decision beneficial to your organization. There are an almost infinite number of small details that no one except the person actually doing the work can ever know. Without employee empowerment it is difficult to take advantage of this knowledge. All of this knowledge is valuable and waiting to be tapped for your organization's benefit. Frequently assumptions are made about employee attitude and willingness to participate based not on the actual employee motivation but employee reaction to the way they are treated by supervision. In many organizations there is essentially no employee empowerment, no freedom to make even basic decisions. These same employees are community leaders, serve on religious boards, are elected officials, do volunteer work, have their own businesses, and in a variety
Krishnan Umachandran
of other ways demonstrate a capability far above what is used in their work. What could happen to your business if through employee development and employee empowerment your employees brought the same dedication, effort and thought to work that they freely give away outside of work? Improvements in productivity of 25% to 50% have been demonstrated when organizations are willing to engage their employee and create an environment where employee motivation is the norm not the exception.. The synergy of work processes /system improvements can be amazing. A proven effective way to get involvement is to focus on the cycle time of important work processes. The importance of cycle time reduction goes much deeper than just being able perform in a process in less time without adding effort. In an organization dedicated to learning how to improve itself, every cycle is an opportunity to learn and improve. An organization with a lower % advantage in cycle time not only has the advantage of lower costs (time is always money) and the ability to do more with the same or fewer resources but also they get the opportunities to learn for every other opportunities for their competitors. In addition to basic problem solving skills an employee development process is needed. This process should stimulate thinking and encourage employees to make positive change in their behavior, attitude and habits of thought about work. Frequently however the biggest changes in these areas have to occur at the management and supervision levels. Turf protection, arbitrary rules, inflexible systems, capricious authority, poor listening, and reservation of the right to make all decisions diminish the likelihood that employee will contribute even a fraction of their capability. True management skill involves the ability to direct, coach, delegate and mentor individuals and teams depending upon the situation and the employee's need. Developing management and supervision with the skill and confidence to behave in this way is not a trivial task. For this reason we strongly recommend that the employee development start at the top of the organization with a consistent philosophy and approach backed up with observable behaviors. Every activity or job has some level of technical skill that must be mastered in order to perform at an acceptable level. Demonstrated knowledge and skills are essential. In some cases employees come to the job with all of those skills. More commonly your employees will have a certain base level of competence but still will require additional development before they can make a positive contribution. Sometimes it can take years for the contribution to pay back the time value of the investment made in an employee. An obvious improvement would be to reduce the amount of time (cycle time) that it takes for new employees to reach the point of net return. The attitude that employee have on the work place can be as important than the actual technical skill level. Most of the time when we speak of an employee having an attitude it goes without saying that we are talking about a poor attitude. When speaking of a positive attitude it is always preceded with the good
Krishnan Umachandran
descriptor. Experience confirms that poor attitude is one of the more common concerns in the work environment. Actually it is not the attitude that is the problem, rather the behaviors that results from that attitude is of concern. When someone is described as having a bad attitude and you press for how anyone else can know if someone has a bad attitude the responses are fairly typical. Attendance problems, marginal quantity or quality of work, interpersonal problems with co-workers or supervisors, poor communications, lack of cooperation in any activity, etc. The list is remarkable similar no matter what the job, company, industry, or part of the world. Our behaviors are how other employees decide what kind of attitude they think we have. Almost everyone will make the connection between behavior and attitude. Our attitudes tend to drive behavior and are a result of our internal values and beliefs, many of which were imprinted at a very early age. We have to live with the early messages for the rest of our lives. That means that if we as individuals are going to change our attitudes we must find a way to over come that early conditioning. Fortunately we can make a conscious choice to add to the values and beliefs system we have imprinted. Each of us can make the conscious decisions to enlarge our individual inventory of experiences. In the correct environment individuals can examine values and beliefs and chose if they want to make a change. The change is not always easy, but the beginning of change lies in changing the habits of thought. The sequence is that our habits of thought drives our attitudes and our attitudes drive our behavior. All three will have a certain amount of harmony or agreement. To make a conscious decision to change we need to change the way we think-change our habits of thought. Changing someone else's attitude is an impossible task. What can be done is to over the circumstances where if someone wants to make a change it is possible. Lasting motivation comes from within. Some things can be done in the short term, but long term motivation and change is a personal event. Leadership qualities and leadership skills The Delegation of Power is an important instrument for empowering the employees to rein the enriched function of Leadership in the team and deliver desired results of the organization through them. Every employee in the helm of affairs be it Functional, departmental or organizational has three characteristics of Positional exhibition. a) Self Portal b) Delivery & Control c) Image Inter-Intra Team
Krishnan Umachandran
Hence the appended format is an eye-opener for reviewing the existing DOP’s and vitalizing the Policies & Procedures for the Future organization. Individual Companies need to work the relevant DOP’s for the levels of the Hierarchy.
Who
Leaders
Delegation of Power
How
Why
What
When Any act subservient to the interest of the Organization resulting in reducing / demeaning the organization or the members of the organization or the premises and precincts thereof. (Option for the organization to exert its power and suitably modify/ alter the provisions to the need the dynamic organization requirements)
Discipline (includes CR’s)
Subordinates
Performance Measurement
Subordinates
Evaluate the performance of the subordinates on standards of measure mutually agreed. Set new standards of Performance as per the dynamic requirements of the market.
Selection & Recruitment
New laterals & existing with required Skill sets
For identifying the need specialties that are unavailable with the existing talent pool and thereupon identifying the required future skill sets and then select for Lateral entry. Opportunity for the existing talented to up-mobile the organization ladder
Morale
Subordinates
Identify ordeal work and situations which are challenging that which has to be recognized and communicated to the team, thereby enthuse enhanced contribution. This includes other such not included in any other settlement and that which is non controversial
Krishnan Umachandran
Communication (including Record Preservation & Destruction)
Inter / Intra – Department / Function / Circle / Div etc.
What areas & levels of activities can be signed for communication. How absence of Superior can be handled
Enrichment
Subordinates
In the absence of the superior what are the delegated activities a subordinate can perform.
Sanctioning
Work related
The activities that requires sanctioning of money for work related purchases
Wages & Salaries ( includes Increments, Allowances, Compensations & Anomalies) Service Conditions ( Leave, Seniority, Transfer, SR’s etc.,) Training & development (includes Examination & Evaluation) Welfare & Facilities ( includes Uniform, Medical, Housing, Recreation, Transport, Education etc.,) Terminal Benefits ( PF, Gratuity, Death Compensations)
ORGANIZATION STRUCTURING GENERATION STRUCTURE The HO of the generation department carries out the following functions;
Krishnan Umachandran
•
Monitoring of all Generating stations.
•
Material Procurement.
•
Environmental Issues.
•
Energy conservation.
•
Efficiency Monitoring.
•
Generation Planning
•
All statutory government requirements.
•
Energy Audit
•
Testing – Equipment and Relays
•
Telecom Network Maintenance and Erection.
•
Purchase
•
Fire
•
Establishment and Human Resources.
•
Finance and Accounts
•
IT
•
Security, Vigilance etc.
The new structure proposes a Supervisory role for the corporate office with specific accountabilities for operational efficiencies at the Power Station levels. The micro level structures for the Generation stations have largely been untouched. The Generation company will be headed by a Chairperson, supported by a Vice Chairperson and Managing Director.
Krishnan Umachandran
The direct reports of the Managing Director and the respective departments is as given below: Head – Power Stations Head – Projects Head – Finance and Accounts Head- HR Head – Management Services Head – R&D cell.
Power Stations: Would include both Thermal and Hydro Generating stations. This department will be responsible for the functioning of the PS inclusive of the Targeted Generation, Efficiency, Technical Audits etc. Projects: Would handle all new projects including the field engineering, Construction, Material Planning etc. Finance and Accounts: All Finance and accounting related activities. Human Resources: Personnel, HRM, Employee Relations & Administration
Sr. No.
Key Performance Indicator
UOM
Unit
Power Station
Head Office
Generation Target Generation in MU s Actual Generation in MU s Generation in MWH
MU s MU s MWH
√ √ √
√ √ √
√ √ √
Auxiliaries Consumption Actual Auxilliaries consumption in MU s Actual Auxilliaries consumption in %
MU s %
√ √
√ √
√ √
Operational / Management Indicators: 1
2
Krishnan Umachandran
3
4
5
GT Loss GT Loss in MU s GT Loss in %
MU s %
√ √
√ √
√ √
Total Auxiliary Consumption Total Auxiliary Consumption in MU s Total Auxiliary Consumption in % As per CEA norms in %
MU s % %
√ √ √
√ √ √
√ √ √
Hrs. Hrs. Hrs.
√ √ √
√ √ √
√ √ √
MWH
√
√
√
MWH
√
√
√
Outages (a) Planned Outage Duration (b) Forced Outage Duration (c) Partial Outage Duration (d) Reduction in Generation due to Major Auxiliary Failure (e) Reduction in Generation due to Major Equipment Failure
5
Plant Load Factor %
%
√
√
√
6
Plant Availability Factor %
%
√
√
√
7
Plant Utilization Factor %
%
√
√
√
8
Actual Heat Rate KCAL / KWH
√
√
√
√
√
√
√ √
√ √
√ √
√
√
√
√
√
√
√
√
√
√
√
√
√
√
√
√
√
√
√
√
√
Design Heat Rate KCAL / KWH 9
10
Actual Efficiency % Design Efficiency % Secondary Fuel Oil consumption in ML / KWH As per CEA norms in ML / MWH
11
% % ML/KW H ML/KW H
Fuel Consumption Coal Factor (Kg /KWH) Oil Factor (ml / KWH) Gas Factor (M3 / KWH)
12
KCAL/ KWH KCAL/ KWH
DM water consumption in M3
KG/KW H ML/KW H M3/KW H M3
Krishnan Umachandran
13
14
15
16
17
Safety Number of accidents per 100 employees Number of fatalities per 100 employees
√ √ √
√ √ √
√ √
√ √
√
√
√ √
√ √
√
√
Days Rs.
√ √
√ √
Days Rs.
√ √
√ √
Days Rs.
√ √
√ √
Days Rs.
√ √
√ √
MT Days ML Days
√ √ √ √
√ √ √ √
mg / NM3
√
√
Nos. Nos.
R&M (a) Targets for R&M activity as per Detailed Project Report Time period in which R&M activity to be completed Cost of R&M activity Rate of Return (RoR) / Environmental benefits (b) Actual work completed for the R&M activity Time period in which R&M acticity is completed Cost of R&M activity Achieved Rate of Return (RoR) / Environmental benefits
Financial Indicators: Stores (a) Fast Moving Inventory No. of days of inventory Value of Inventory (b) Slow Moving Inventory No. of days of inventory Value of Inventory (c) Non Moving Inventory No. of days of inventory Value of Inventory (d) Scrap and un-serviceable Inventory No. of days of inventory Value of Inventory Fuel Coal (MT) No. of days Oil (ML) No. of days
√ √ √
Environment Monitoring Parameters (a) Emission Levels Suspended Particulate Matter
Krishnan Umachandran
SOx NOx (b) Ambient Air Quality Suspended Particulate Matter SOx NOx (c) Liquid Effulent Discharge pH Oil & Grease Suspended Solids Hexavalent Chromium Total Chromium Total Copper Total Iron Zinc Phosphate (d) Utilisation of Fly Ash Target as per Gazette Notification Acutal Utilisation of Fly Ash 18
Hydro Power Plants Actual Generation in MWH Auxiliary Consumption in MWH Reservoir Water Level (Feet / Meters) Equivalent MU s which can be generated
ppm ppm
√ √
√ √
mg / NM3 ppm ppm
√ √ √
√ √ √
mg/lit. mg/lit. mg/lit. mg/lit. mg/lit. mg/lit. mg/lit. mg/lit.
√ √ √ √ √ √ √ √
√ √ √ √ √ √ √ √
% %
√ √
√ √
√ √
√ √
√ √
√ √
√ √
√ √
MWH MWH Ft/Met ers MU s
DISTRIBUTION STRUCUTURES A “Value Chain” decomposes the Distribution Business into the work elements that create value for the organization. This framework facilitates: •
Evaluation of the role of individual distribution activities, and linkages to other activities
Krishnan Umachandran
•
Creation of a commercial mindset among staff by giving them a way to focus on value creation rather than functional disciplines
•
A foundation for organizational design, since organizational units should be defined around the work to be accomplished
Exhibit A depicts a generic Value Chain for the Distribution and Retail Supply business.
CCuusstotommeer r lligeennccee InIntetellig && rkeetin tingg MMaark
CCuusstotommeer r CCoonntatacct t
AAnnaalylyz zee RReeqquueesst,t, DDeessigignn && PPlalann
ire AAccqquuire SSuupppplyly
CCoonndduucct t rk WWoork
BBillill && llecct t CCoolle
SSuuppppoortrt&& itor r MMoonnito SSyysstetemm
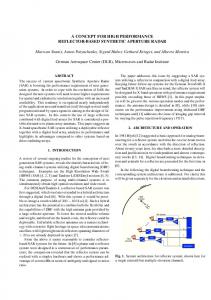
Distribution and Retail Supply “Value Chain Chain”” Exhibit A depicts how the current organizational structure of GEB distribution operations map to the Value Chain. Clearly, a number of organizational units share responsibility for individual work processes, while other work processes are not performed by any unit (e.g. customer intelligence).
Krishnan Umachandran
Customer Customer Customer Intelligence Customer Intelligence Contact Marketing Contact &&Marketing
d
Acquire Acquire Supply Supply
Conduct Conduct Work Work
Bill Bill && Collect Collect
d
Support&& Support Monitor Monitor System System
d
HQ HQ
d
Analyze Analyze Request, Request, Design Design & Plan & Plan
Zone Zone
d
d
d
d
d
d
d
d
d
d
Sub -Sub Division Division
d
d
Divisions Divisions
d
d
Circles Circles
d
Current Organizational Structure
The achievement of improved performance begins with holding individuals and organizations accountable for results. A fundamental principle in improving accountability and performance is the separation of customer service from technical management of the network. Throughout many parts of the world whenever an electricity sector restructures, these two functions are separated. In
Krishnan Umachandran
competitive markets these functions are legally separated as in New Zealand or ring-fenced as in Victoria, Australia to reduce the chances for self-dealing between subsidiaries. In a less than fully competitive market, the separation of these functions still has merits since each function has a distinct set of skills and value that it brings to the market. It is the Consultants’ belief that these two functions are important and that an Additional Engineer should not be asked to take priority of one over the other.
Unbundling Distribution NETWORK NETWORK Distribution • Maintenance • Construction • Materials • Control Center
Issues
CONSUMER SERVICE Retail Marketing Supp ly Supply • New Product & Services • Billing and Collections • Bulk Electric Trading • Account Management • Customer Service
• Where should GEB focus invest today? today? • What does Distribution look like? • What does Retail Marketing Supply looklook like? like?
Defining the organization so as to separate these two work areas achieves the following: •
Clarifies authority and accountability
•
Allows officers to focus on particular tasks
•
Allows human resources to be consolidated in focused units so as to enhance utilization, particularly with respect to emergency.
Krishnan Umachandran
Another principle is to ensure that responsibilities of a unit are balanced by accountability. For example, •
Units that book revenues from a particular customer class are responsible for servicing those customers.
•
Units that are responsible for reducing non-technical losses have authority to reduce theft and take actions to reduce these losses.
These principles lead to the following work process allocations: •
Sub-Divisions are responsible for LV customer service
•
Divisions no longer have any customer service functions, and are responsible solely for technical management of the network.
•
Circles are responsible for 11 KV and greater customer service
•
The Zone is responsible for management of the overall DMC and execution of tasks that can be centralized to maximize resource utilization, e.g. materials management, human resources, revenue protection, system planning and operation of remote metering systems to name a few.
This allocation of work meets another criterion not stated earlier, namely that the organizational restructuring minimizes the disruption to the existing organization. Key Performance Indicators corresponding to these activities are presented later in this section. The functions of each of these units are described below, and mapped out according to the value chain in Exhibit 2.19
Krishnan Umachandran
Sub-Divisions: The Sub-Division will now focus exclusively on serving small customers (those connected at 400 V or below). The activities of the SubDivision will include: •
Connecting and disconnecting small consumers
•
Reading meters
•
Dispatching bills
•
Collecting payments
•
Operating a counter service for service requests, payments, and complaints
•
Emergency work on 400 V lines, including removal of hooks
•
Servicing 11 kV fuses
The Sub-Division will maintain a small operational inventory to ensure that adequate supplies are on hand to fulfil these responsibilities. It will also forecast new connections and load growth among LV customers in the area it serves. The Sub-Division will be the basic unit of energy accounting. All consumers will be metered, and all 0.4, 11 kV lines entering or leaving a Sub-Division will be remotely metered to facilitate calculation of losses. Losses, collections, and speed and accuracy of handling customer transactions and requests will be important performance indicators. Emergency work on 400 V lines and 11 kV fuses has also been included as a Sub-Division responsibility since:
Krishnan Umachandran
•
Sub-Division can service these facilities most rapidly because of their proximity
•
The presence of meter readers and other Sub-Division staff in a relatively small area increases the likelihood of detection and rapid response.
Divisions: The existing Divisions will be refocused on purely technical management of the network, although they will retain the function of bill preparation since currently bills are prepared at Divisions. The Divisions will no longer be responsible for any customer interaction. The role of the Divisions will be to ensure availability of network so that Circles and Sub-Divisions receive reliable supply to serve their customers. The Divisions will focus on: •
Responding to emergencies in the network from 11kV down to the 11/0.4 kV substations
•
Maintaining the network from 11 kV down to the 0.4 kV lines
•
Supervising construction of the 11 and 0.4 kV network
•
Network planning from 11 kV down to the 0.4 kV lines
•
Preparation of bills based on meter reading data from the Sub-Divisions.
The Division will also maintain a small operational store to ensure that adequate supplies are on hand to fulfill these responsibilities. The Division will also perform basic accounting and disbursement functions related to the above functions and
Krishnan Umachandran
the functions of the Sub-Divisions. Performance of the Divisions will be measured in terms of network reliability.
Circles: Like the Sub-Divisions, the Circles will focus on customer service, but to large customers. Officers reporting directly to the Circle Manager will perform day-to-day customer service. In addition, the Circle will handle district liaison, and will prepare energy accounts for the Sub-Divisions within its area. Specifically, the Circle will: •
Connect and disconnect large consumers (i.e. all consumers connected at 11 kV and greater and that is not part of GETCL)
•
Dispatch bills and collect payments from these large consumers
•
Handle large customer requests and complaints
•
Perform meter testing for large consumers though many of the top accounts should focus on installing an Automatic Meter Reading system
•
Prepare energy accounts for the Sub-Divisions within its area
•
Forecasting new connections and load growth attributable to large consumers
•
Roll-up of load forecasts and both capital and revenue expenditure (O&M) budgets from the Divisions and Sub-Divisions in its area.
•
Liaise with district officials
•
Perform basic accounting and disbursement functions, including the rollup of accounts for all Divisions and Sub-Divisions in its area
Krishnan Umachandran
•
Maintain a small store to ensure that adequate supplies are on hand to fulfill these responsibilities.
As with the Sub-Divisions, losses, collections, and speed and accuracy of handling
large
consumer
transactions
and
requests
will
be
important
performance indicators.
Zone: The Zone will be responsible for overall management of the DMCs as well as functions that are most efficiently performed when they are centralized. Specifically, the Zone will: •
Conduct customer research (e.g. customer needs and satisfaction surveys)
•
Roll-up the DMC load forecast, investment plan and budget, and work with corporate to prepare the overall financial performance target for DMC’s area of supply.
•
Conduct procurement of bulk commodities used by multiple units in the Zone which do not require testing or compliance with standards
•
Manage the central DMC store, and ensure sufficient inventories are on hand
•
Testing and commissioning of new network facilities
•
Operation of the future remote metering system
•
Preparation of bills for large consumers
Krishnan Umachandran
•
Review energy accounts, investigating discrepancies, and providing legal assistance associated with revenue protection and customer complaints
•
Maintain accounts as agreed with GEB
•
Design and supervise implementation of the information technology and communications systems used throughout the DMC.
•
Implement human resource policies, including bonus allocations, transfers, recruitment, etc.
Leaders of all of these units will have common management roles including preparation of their budgets, performance review of their staff, etc.
List of Shared Services:
1. Human Resources. 2. Finance and Accounts. 3. Testing. 4. Fire Safety and Environment. 5. Security. 6. Information Technology. 7. PR and Corporate Communications.
Krishnan Umachandran
Rational for Alignment with existing Positions & Organization Structure :
The structure proposed is made workable by aligning the existing HO structure and disintegrating the current Hierarchy & Work Flow Design towards a better performing Corporate Structure of the future . Care is ensured that Morale of the employees is empathized and Current favorable conditions of Employment is sustained.
Rationale for Fitment of the Proposed Positional Role-Holders with the existing Designations Sl.No
Scale
Existing the like …
and Proposed
1
18400-500-22400
CE / GM
Vice President
2
16000-450-20050
ACE / AGM
Chief General Manager
3
13000-400-18600
SE / DGM
General Manager
4
10400-350-12150-37515525
EE / DS
Asst. General Manager
5
8500-300-11200-32512500-350-14250
6
Accounts Officer, Sr. Manager Asst.Sec, Labour Welfare Officer, Security Officer, Asst. Legal Adviser, Private Sec., etc 8000-300-11000-325-13600 Dy.Engr
7
6500-250-9000-275-11750
Jr.Engr
Manager
Krishnan Umachandran
S.N o.
Key Performance Indicator
Unit
Subdi vision
Div isio n
Ci rc le
Distri butio n
√
√
√
√
√
√
√
√
Operational / Management Indicators: 1
Planning - Budget Vs Actual Capital Budget - Budget Capital Budget - Actual O&M Budget - Budget O&M Budget - Actual
2
3
4
5
6
Line Breakdowns at 11 KV (a) Sustained Fault per 100 circuit Km length (b) Transient Tripping per 100 circuit Km length Average Outage Duration Average duration of scheduled outage Average duration of forced outage due to emergency shutdown Percentage availability of Power
Rs. Crores Rs. Crores Rs. Crores Rs. Crores
Nos.
√
√
√
Nos. Hrs Hrs
√
√
√
√
√ √ √
Hrs %
√ √
√ √
√ √
Number of Network maintenance staff (a) Per 100 Kilometer of line (HT + LT) (c) Per 1000 consumers
Nos. Nos.
√ √
√ √
√ √
Safety No. of accidents per 100 employees No. of fatalities per 100 employees
Nos. Nos.
√ √
√ √
√ √
Nos.
√
√
√
%
√
√
√
Nos. Nos.
√ √
√ √
√ √
Nos. Nos.
√ √
√ √
√ √
Transformer Failures (a)Distribution Transformers (DTRs) (b) % Failures of Distribution Transformers (% to Total DTRs) Meter Testing (a) 1 Phase Meters received for Testing (pending + added during the period) New Meters Old Meters (b) 3 Phase Meters received for Testing (pending + added during the period) New Meters Old Meters
√
√
√ √
Krishnan Umachandran
(c) Inspection of meters disputed by consumers (pending + added during the period) 1 Phase 3 Phase (c1) Number of disputed meters inspected 1 Phase 3 Phase (d) Repaired / Replaced meters 1 Phase 3 Phase (e) Inspection of wrapped meters - 1Phase (f) Inspection of wrapped meters - 3 Phase (g) % of inspected wrapped meters to total wrapped meters - 1 Phase (h) % of inspected wrapped meters to total wrapped meters - 3 Phase (i) Average time to test and repair meter 1 Phase 3 Phase 7
8
Metal Meter Boxes & Meter Sealing (a) Metal Meter Box installed on existing 1 phase connections (b) % of Metal Meter Boxes to Total 1 Phase consumers (c) Metal Meter Box installed on existing 3 phase connections (d) % of Metal Meter Boxes to Total 3 Phase consumers (e) Sealings done on 1 Phase installations (f) % of sealings to total 1 Phase installations (g) Sealings done on 3 Phase installations (h) % of sealings to total 3 Phase installations (i) % of Installations inspected for working of Capacitors for 3 HP and above consumers Theft Total number of connections checked (a) Residential (b) Commercial (c) Industrial LT (d) Industrial HT (e) Agriculture (f) Others Total number of connections detected (Theft + Malpractices)
Nos. Nos.
√ √
√ √
√ √
√ √ √ √
√ √ √ √
√ √ √ √
%
√
√
√
%
√ √ √ √
√ √ √ √
√ √ √ √
√
√
√
√
√
√
√ √ √ √ √
√ √ √ √ √
√
√
√
√
√ √ √ √ √ √
√ √ √ √ √ √
Nos. Nos. Nos. Nos. Nos. Nos.
√ √
Hrs Hrs
Nos.
√
% Nos. % Nos. % Nos. %
√
√ √
%
Nos. Nos. Nos. Nos. Nos. Nos.
√ √ √ √ √ √
√
√ √
Krishnan Umachandran
(a) Residential (b) Commercial (c) Industrial LT (d) Industrial HT (e) Agriculture (f) Others Percentage of Cases (Thefts + Mal Practices) detected Units Assessed Amount Assessed Amount Collected % Amount Collected / Amount Assessed Number of FIRs filed Number of court cases Number of court cases in which decision has been awarded Cases under compounding Number of counsumers arrested Number of employees arrested 9
10
11
Procurement and Stores Value of items in inventory per month Number of days of Inventory Number of stores staff per Rs. Crore of inventory T & D Losses (a) Distribution Loss: [(Total energy input to the Distribution System - Total energy sales to the consumers incl. Agriculture assessment for un-metered Agriculture consumers)* 100% / Total energy input to the Distribution System] (b) Surrogate Factor for system losses (SFSL): [((Total energy input to the Distribution System - Total energy sales (metered) to the consumers)* 100% / Total energy input to the Distribution System)] Consumption (a) H.T. Sales (Billed Units) % HT Sales to Total Consumption (b) L.T.metered sales (Billed Units) %LT sales to Total Consumption (c) Total Agricultural Consumption (Metered + Assessed) % Agriculture sales to Total Consumption (c1) Metered Agricultural Consumption
Nos. Nos. Nos. Nos. Nos. Nos.
√ √ √ √ √ √
√ √ √ √ √ √
% MUs Rs. Rs. % Nos. Nos.
√ √ √ √ √ √ √
√ √ √ √ √ √ √
√ √ √ √ √ √ √
Nos. Nos. Nos. Nos.
√ √ √ √
√ √ √ √
√ √ √ √
Rs. Days
√ √
√ √
√ √
Nos.
√
√
√
%
√
√
√
%
√
√
√
MU % MU %
√ √
√ √ √ √
√ √ √ √
√ √ √ √
√ √
√ √
√ √
√ √
MU % MU
√ √ √ √ √ √
Krishnan Umachandran
% of metered agricultural consumption to total Agriculture consumption (c2) Assessed Agricultural Consumption % of assessed agricultural consumption to total Agriculture consumption (d) Total Consumption (a+b+c) (e) % metered sales to Total Consumption = (a+b)/d Total metered sales = (a+b) 12
14
15
% MU
√
√
√
√
%
√
√
√
√
√
√
√
√
√
√
√
√
√
√
√
√
√
√
√
√
√
√
√
√
√
√
√
% Days Rs. Rs. % Nos. Nos. Rs. Nos. Nos.
√ √ √ √ √ √ √ √ √ √
√ √ √ √ √ √ √ √ √ √
√ √ √ √ √ √ √ √ √ √
√ √ √ √ √ √ √ √ √ √
Nos. Nos. Nos.
√ √ √
√ √ √
√ √ √
√ √ √
% Nos. Rs.
√ √ √
√ √ √
√ √ √
√ √ √
Nos.
√
√
√
Specific Consumption H.T.(Units billed/no. of consumers) Domestic (Units billed/No. of Consumers Billed) Commercial (Units billed/No. of Consumers Billed) L.T.Industrial (Units billed/No. of Consumers Billed) Agricultural (Metered Consumption/No. of Consumers) Agricultural (Assessed Consumption/No. of Consumers)
13
% MU
Arrears % Reduction in revenue arrears Number of days of arrears Debit Arrears Reduction in Debit Arears % Reduction in debit arrears Number of PDC consumers Number of litigation cases Amount involved in litigation cases Number of decrees Number of decrees executed Disconnections Number of consumers liable for disconnections Number of disconnection notices issued Number of actual disconnections % of actual disconnections to consumers liable for disconnections Number of reconnections Amount Recovered Replacement of Defective meters Number of defective meters required to be replaced 1 Phase
Kwh/co nsumer Kwh/co nsumer Kwh/co nsumer Kwh/co nsumer Kwh/co nsumer Kwh/co nsumer
Krishnan Umachandran
3 Phase Number of defective meters replaced 1 Phase 3 Phase Average time taken to replace defective meters 1 Phase 3 Phase
Nos.
√
√
√
Nos. Nos.
√ √
√ √
√ √
Nos. Nos.
√ √
√ √
√ √
√ √
√ √ √ √ √
√ √ √ √ √ √ √
√ √ √ √ √ √ √
√
√ √ √ √ √ √ √
√ √ √ √ √ √ √
√
Customer Service Indicators 16
17
18
Applications received during the period New applications (opening balance (surveyed, unsurveyed & paid) + applications received during the period) LT Domestic LT Commercial LT Industrial Agricultural Other LT HT Services Total
Nos. Nos. Nos. Nos. Nos. Nos. Nos. Nos.
Connections Released during the Period LT Domestic LT Commercial LT Industrial Agricultural Other LT HT Services Total
Nos. Nos. Nos. Nos. Nos. Nos. Nos.
√ √ √ √ √
Nos. Nos.
√ √
√ √
√ √
Nos.
√
√
√
Hrs
√
√
√
√
Hrs
√
√
√
√
Hrs
√
√
√
√
Hrs
√
√
√
√
Customer Complaints Number of complaints related to meters Number of complaints related to bills Number of complaints related to payments made by consumers Number of complaints related to nonavailability of power Average time taken to redress complaints related to meters Average time taken to redress complaints related to bills Average time taken to redress complaints related to payments made by consumers Average time taken to redress complaints related to non-availability of power
√
Nos.
Krishnan Umachandran
19
Average time taken to provide new connection (A category connection) Numbers of complaint centres per 1000 consumers for complaints handling - for urban area only Number of Payment counters per 1000 consumers Efficiency Ratios Average employee cost Average no. of consumers / sq. km Average consumption / consumers (consumer category wise) Average Manpower / MU sold Average manpower / 1000 consumers Revenue per Employee Employee Cost to revenue Employee Cost per unit sold Average Revenue / Unit sold % of Receiving energy which is billed % Revenue collected / Revenue billed Total energy billed / total energy consumed Actual Sales as a percentage of forecast sales Percentage of budged expenditure Vs actual expenditure Number of billing staff per 1000 consumers Number of meter readers per 1000 consumers % of amount billed that is paid on time
Hrs
√
√
√
√
Nos.
√
√
√
√
Nos.
√
√
√
√
Rs. Nos.
√ √
√ √
√ √
√ √
Units Nos. Nos. Rs. lakhs % Rs./unit Rs./unit % % % %
√ √ √
√ √ √
√ √ √
√ √ √
√ √ √ √ √ √ √
√ √ √ √ √ √ √ √
√ √ √ √ √ √ √ √
√ √ √ √ √ √ √ √
√ √ √ √
√ √ √ √
√ √ √ √
% Nos. Nos. %
√ √ √
Krishnan Umachandran
TRANSMISSION STRUCUTURES The organizational structuring have been done allowing the organization to: •
Keep the same operational structure in place to reduce the disruption to the existing organization.
•
Clarifies authority and accountability.
•
Allow officers to focus on individual tasks.
Based on visits to the Transmission Circle, Division and Subdivision and also keeping the above factors in mind the structure was arrived at.
The Highlights of the proposed structure are: •
Places all Transmission operations and construction assets under one department.
•
Places Load Dispatch and Communication Assets under one department.
•
Places all Management Services under one department.
•
Human Resources has been placed under one department. This has been done keeping in mind the need for focus in HR Functions due to the New Performance centric culture of the reformed set up and the several employee issues that may arise during the restructuring process.
•
Finance and Accounts is to be consolidated under one department.
Krishnan Umachandran
Technical manages all transmission and will be responsible for network O&M, Capital Projects, testing and procurement of transmission materials and management of materials. The consultants recommend that the existing circle remain in place so as to reduce disruptions within the organization.
Load Dispatch and Communications manages all communications assets and will acquire the load dispatch capabilities. The consultants recommend that the current Load Dispatch organization structure remain the same. In addition, communications should continue to initially operate within its current divisional arrangement.
Management Services manages all non-physical assets and contains the most diverse range of skills.
This department will contain everything from
Administration to a regulatory cell.
Krishnan Umachandran
S.No .
Critical Parameter
Unit
Management Indicators: Planning: Budget Vs Actual Capital Budget O&M Budget Realization Vs Forecast
Rs. Rs. Rs.
System Operation System Availability 66 KV 132 KV 220 KV 400 KV Frequency Excursion (Number & Duration) Voltage Excursion (Number & Duration)
% % % % Nos / Hrs Nos / Hrs
Sub Station √
√ √ √ √
66 KV 132 KV 220 KV 400 KV Emergency Work of Transmission Forced outages per 100 km-circuit Number of faults per 100 kmcircuit Efficiency System Losses 66 KV 132 KV 220 KV 400 KV Safety Number of accidents per 100 employees Number of fatalities per 100 employees
Divis ion √
Circl e √
Tran s co √
√ √
√ √ √
√ √ √
√ √ √ √
√ √ √ √
√ √ √ √
LDC
√
√
√ √ √ √
√ √ √ √
√ √ √ √
√ √ √ √
Nos.
√
√
√
√
Nos.
√
√
√
√
% % % %
√ √ √ √
√ √ √ √
√ √ √ √
√ √ √ √
Nos.
√
√
√
√
Nos.
√
√
√
√
Krishnan Umachandran
Customer Service Indicators Scheduled Work Number of new substation requests Number of new substation requests completed Length of time until completion Completed by agreed date Emergency Work Number of forced outages Average Incident duration Number of load shedding incidents per year Estimated MWh loss due to load shedding per year Metering & Settlement Complaints of misread meters Complaints of settlement miscalculations % of Meters Functioning Properly Average Replacement Time of faulty meters % of Meters tested Customer Satisfaction Incorrect Meter readings, bills and payments Solved disputes / Total disputes Average time to settle the disputes Complaints settled / Number of complaints
Financial Indicators Maintenance Cost Per KM OHL Per KM Cable Per KM GIL Per Substation Per GIS LDC Emergency Cost Per KM OHL
Nos.
√
√
√
Nos. Days Y/N
√
√ √ √
√ √ √
√ √ √
Nos. Hrs
√ √
√ √
√ √
√ √
Nos.
√
√
√
√
√
√
√
MWh
Nos.
√
√
√
√
Nos. %
√ √
√ √
√
√
Hrs. %
√
√
√
√
√
√
Nos. %
√ √
√ √
√ √
Days
√
√
√
%
√
√
√
√
Rs. Rs. Rs. Rs. Rs. Rs.
√ √ √ √ √
√ √ √ √ √
√ √ √ √ √
√ √ √ √ √ √
Rs.
√
√
√
√
√
√
Krishnan Umachandran
Per KM Cable Per Substation LDC Employee Related Employee Cost per employee Energy Transmitted per employee Length of Transmission line per employee
Rs. Rs. Rs. Rs. MU s Km circui t
√ √
√ √
√ √
√ √ √
√
√ √
√ √
√ √
√ √
√
√
√
√
Krishnan Umachandran