âHyper-local, directions-based ranking of places,â. PVLDB, vol. 4, no. 5, pp. 290â301, 2011. [29] M.-H. Park, J.-H. Hong, and S.-B. Cho, âLocation-based.
International Journal of Computer Applications (0975 – 8887) Volume 136 – No.8, February 2016
Personalized Recommender System using Collaborative Filtering Technique and Pyramid Maintenance Algorithm Minakshi Pachpatil
Anjana N. Ghule
ME (CSE) Govt.Engg.College ,Aurangabad Maharashtra, India
Asst.Professer GECA, Aurangabad Maharashtra, India
ABSTRACT Location aware recommender system(LAS) make use of spatial ratings for generating personalized recommendations.It uses Collaborative filtering techniques to generate recommendations based on user location,item location or both user and item location . LAS uses spatial ratings for spatial items , Spatial ratings for Non-spatial items, Non spatial ratings for spatial items to generate personalized recommendation. For spatial ratings for non spatial items LAS uses user partitioning technique where spatial ratings are distributed as per user location in the pyramid. Pyramid Maintenance algorithm provided to achieve required scalability or locality.LAS is scalable as number of γ-cells are increased in pyramid and to improve locality α-cells are increased to maintain CF Model. LAS is efficient as compare to traditional recommendation system because algorithm provided is strong enough to cope challenge of locality and scalability.
Preference locality: preference locality suggests that user ratings from one spatial region are different from ratings in another spatial region. Recommendations should be generated by those ratings which are spatially close to the querying user. Travel Locality: when recommended items are spatial then user has to travel minimum distance when visiting these venues. This property is termed as “travel locality”.
2. LAS OVERVIEW This section provides overview of LAS query model and Collaborative filtering method.
2.1 LAS Query Model Application has given UserId U, K Numeric limit, Location of the user L, then LAS generates K-recommended items for querying user. It can support snap shot queries and continuous queries.
Keywords
2.2 Item-based Collaborative Filtering.
Recommender system, spatial location, locality,pyramid structure.
Main idea of collaborative filtering is to use past opinions of user community to predict which item current user will prefer or interested in. Pure collaborative filtering approach takes user-item matrix as a input and produces following types of output. (1) list of n-recommended items which contains those items that user not purchased before. (2) (numerical) prediction indicating to what degree current user will like the items. In Collaborative filtering assumes a set of n items I={i1,i2,…in} and a set of m users U={u1,u2,…..um}, and each user ui has list of items Iui for which user expressed opinions. Opinions can be numeric rating e.g.(1 to 5 where 1 represents bad choice and 5 represents best choice) or unary rating (e.g.checkboxes) .Active user Ua for whom the collaborative filtering generates the k-recommended items.
1. INTRODUCTION The goal of recommender system is to generate personalized recommendations for items or products of interest. Suggestions for books on Amazon[1],or movies on Netflix are example of recommender system. Recommender systems make use of Collaborative filtering that make use of past community opinions to find similar users or items to generate number of personalized items.Content based filtering that make use of user profile or description of items. Currently working recommendation system make use of (user , item, rating) attributes which is not produce location based recommendations. Spatial recommender system embeds user /item location with ratings e.g. location based social networks(e.g. Forsquare and Facebook Places[4]) allow check-in at spatial destination & rate their visits, Sindbad [3] a location based social network system injects location awarenesss within every aspect of social interaction and functionality in the system.LAS produces high quality recommendations using Collaborative filtering in an efficient manner. System produces recommendations using three types of spatial ratings in a single framework. (1)Spatial ratings for non spatial items represented using 4-tuple (user, ulocation, item, rating) where ulocation is the user location , e.g. user at home gives rating to the movie/books/restaurant etc.(2)Nonspatial ratings for spatial items having 4 tuples(user, item, ilocation, rating),here item location is specified.e.g. user from unknown location rating a restaurant/hotels. (3) Spatial ratings for spatial items has 5- tuples(user, ulocation, item, ilocation, ratings).e.g. user at his/her location rating a restaurant visted for lunch. Two techniques that motivate the need for location aware
It has two forms. Prediction: Predicted value is specified in same way as opinions are expressed by active user ua. It is the numerical value expressing predicted likeliness of item ij. Recommendation: A list of items Ir that active user ua will like most it is the items such that Ir ∩ Iua=ᶲ. In item based collaborative filtering [9] prediction is computed using similarity between items. Cosine similarity is used to compute similarity as it produces more accurate result. The similarity between two items a and b is defined as a rating vector ͞a an d ͞b as shown in fig .2 [8]. Similarity difference is calculated as follows.
The possible similarities are between 0 and 1,where 1 indicates strong similarity. After the similarity between the
25
International Journal of Computer Applications (0975 – 8887) Volume 136 – No.8, February 2016 items are calculated the next stage is to predict the rating using prediction.For user u and product p prediction is calulated as follows.
Prediction is the sum of ru,i, a user u’s rating for item i ,weighted by sim(i ,p) similarity of product p to candidate item i,then normalized by similarity score between i and p. User receives as recommendations the top k-item ranked by pred(u ,p).
3. SPATIAL USER RATINGS FOR NONSPATIAL ITEMS LAS produces recommendations for spatial ratings for nonspatial items using the tuple(user, uloction, item, rating). Main aim is to achieve preference locality i.e. user opinions are spatially unique, To produce recommendations there are 3 requirements. (1)Scalability: System should be scalable as number of users goes on increasing. (2)Locality: while generating the recommendations consider the ratings of those user spatially close to the querying user. (3)Influence: ability to control the size of spatial neighborhood by system users.User partitioning technique is use to generate recommendations. This technique uses pyramid structure where space is partitioned into different levels of the pyramid as per user location attribute. System then produces recommendations using remaining attributes(user, item, rating). Shape of the pyramid is driven by three goals scalability, influence, locality.
Statistics Cell(β-cell) It contains statistics which is within its spatial region. Difference between α-cell and β-cell is that βcell does not maintains Collaborative filtering model.It is light weight cell as it require less space as compare to α-cell. Empty Cell(γ-cell) γ-cell is a cell that does not maintain statistics and collaborative filtering model. So it is the most light weight cell as it has no CF model. α- cell is responsible for answering recommendation queries as it contains collaborative filtering model. Pyramid structure that contains only α- cells achives highest locality. Statistics maintained in β- cell determines whether the children of that cell is of αcells for locality point of view. γ- cells is leaf cells in the pyramid. Based on the tradeoff between locality and scalability cells are upgrade or downgrade. To achieve locality more α- cells are maintained in the pyramid and to achieve scalability more γ-cells are maintained. β –cells comes as intermediary cells which further increase the locality where scalability is not affected.
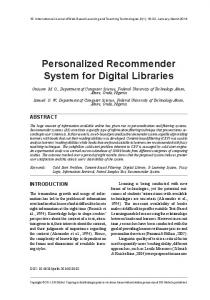
Fig.4 Pyramid Data Structure.
Fig.5[8] Example of Item Ratings Statistics Table. Fig. 1[8] Item-based CF Model generation. (a) Rating Matrix. (b)Item based CF Model.
Fig.2. Item-based Similarity calculation.
3.1 Data Structure The pyramid divides the space into h different levels. It make use of partial in-memory pyramid structure[11] as shown in fig.4. For a level h pyramid partitions the space into 4h equal area grid cells. At level 0 (root) representing the total geographic area as a one cell. Level 1 partitioned the space into 4 equi-area cells, and so on. Each cell is represented as by unique cell id. As per the need of recommendation locality and scalability pyramid maintains three types of cells. Empty Cell(γ-cell),Recommendation model cell(α-cell), Statistics Cell(β-cell), Empty Cell(γ-cell)[8]. Recommendation Model Cell(α-cell) Each (α-cell) stores an item based collaborative filtering model. This model is built using spatial ratings located in spatial region of that cell. The α-cellis the root cell of the pyramid and represent traditional item based collaborative filtering model. α-cell maintain items ratings statistics which is in its spatial extents. If Cp is α-cell it contains rating statistics of its 4 cells as shown in fig. 5. For item i1 ratings located in child cells equal to 109,3200,14,54.
3.2 Data Structure Maintainance Root cell in the pyramid represents entire region and cells in lowest level representing more localized regions.Initially pyramid is constructed using all spatial ratings and all the cells in the pyramid is α-cells. Then invoke cell type maintenance step which scans each cells and downgrades cells to (β –cell or γ –cell) if necessary. As number of users and items added to the system data will goes on increasing. So that size collaborative filtering model as well as number of recommendations produced from each cell also increasing. Cell maintenance is invoked when cell receives N% new ratings, which is computed from the existing ratings. Features of pyramid maintenance as follows. (1) Maintenance is performed offline using old pyramid cells. (2) Maintenance does not reconstruct the whole pyramid at once ,only one cell is rebuilt at a time. (3)Maintenance is performed only when N% received by the cell.
ratings are
3.3 Maintainance Algorithm Algorithm1 provides pseudocode for pyramid maintenance algorithm. It receives input as a Cell C, level h. This algorithm includes three main steps. Step I: Statistics Maintenance :Parameters in cell C for each item i represents number of user ratings associated with its
26
International Journal of Computer Applications (0975 – 8887) Volume 136 – No.8, February 2016 four children.Item ratings statistics table contained ratings which are in spatial extents of cells. If N% new ratings received then cell switching decision is made. Step II: Model Rebuild: As the cell receives new ratings the second step is to rebuild Item based collaborative filtering model. Model is rebuild at cell C only if cell is α-cell. It is necessary to rebuild the model as new ratings enter the system and it should be evovlve in Collaborative filtering model. Step III: Cell Child Quadrant Maintenance: Pyramid is driven by three goals scalability, influence, locality. Locality and scalability is achieved by cell switching decision. If Cell C child quadrant cells are α-cells then these cells are downgraded to β-cells by calling function CheckDowngradetoScells. If child quadrant cells are β-cells then cells are switched to α-cells by calling function CheckUpgradetoMCells. If child quadrant cells are β-cells then LAS first considers to swith the cells to α-cells i.e. cell upgradation is done. If cells are not switched to α-cells then downgraded to γ-cells. Cell switching decision is taken completely in quadrants.
3.3.1 Recommendation Locality Running Example : Two level pyramid in which root cell is cp and it is divided into four cells c1,c2,c3,c4 shown in fig.6. Eight users u={u1,u2,……,u8} and eight items i={i1,i2,….i8}. each user has given ratings to available items. As shown in fig. 6(b) user u2 and u5 belongs to cell c2 both rated the items i2,i5. So the similarity score calculated at c2 is similar to similarity score calculated at parent cell cp. As both the users belongs to same cell. This will not be same if users belong to different cell. LAS loses the locality if CF model produced at child cells different than the CF model at parent cell. System calculates locality gain/lost as follows. Locality Loss/Gain: Table2 gives mathematical notions used for calculating locality loss/gain. Items ratings pair set (RPc,i) is a set of pairs of users have rated item I in cell c. e.g. RPcp,i7 is the item rating pair set for item i7 in cell cp with three elements i.e. RPcp,i7 = { , ,}. For each item define the Skewed Item Rating Set RSc,I which is total number of user pairs in cell c that rated the item I such that user pairs does not belongs to same cell c. i.e. Skewed item ratings set for i2 in cell cp is null as users u2 and u5 rated item i2 located in same child cell c2. Skewed item ratings set for i4 is RScp,i4={, , }.Using these parameters calculate the item locality loss LGc,i for each item as follows. Defination1 Item Locality Loss(LGc,i) it is defined as degree of locality loss of item when four children cell of cell c is downgraded to β-cell , such that 0 this metric treats the absolute error between them, i.e., |pi,qi| equally. The MAE is computed by _rst summing these absolute errors of the N corresponding ratings-prediction pairs and then computing the average. Formally,
Fig 6[8].(a) Two Level Pyramid. (c) Locality loss/gain. (b) Recommendation model and Item ratings distribution. The value of RSc,I and RPc,I is derived from item ratings statistics table.Value of LGc,i is used to calculate overall cell locality loss.
The lower the MAE, the more accurately the recommendation engine predicts user ratings. Decision support accuracy metrics evaluate how effective a prediction engine is at helping a user select high quality items from the set of all items. These metrics assume the prediction process as a binary operation either items are predicted (good)
28
International Journal of Computer Applications (0975 – 8887) Volume 136 – No.8, February 2016 or not (bad). With this observation, whether a item has a prediction score of 1:5 or 2:5 on a five-point scale is irrelevant if the user only chooses to consider predictions of 4 or higher. We used MAE as our choice of evaluation metric to report prediction experiments because it is most commonly used and easiest to interpret directly.
4.3 Experimental Results In this section we present our experimental results of applying item-based collaborative fltering techniques for generating predictions. Our results are mainly divided into two parts quality results and performance results.
4.3.1 Quality Experiments 1.Recommendation Quality for Varying Pyramid Levels: These experiments test the recommendation quality improvement that LAS achieves over the standard (nonspatial) item-based collaborative filtering method. Quality Metric To measure quality, we build each recommendation method using 80% of the ratings from each data set. For each rating t in this 20%, we request a set of k ranked recommendations S by submitting the user and ulocation associated with t. We first calculate the quality as the weighted sum of the number of occurrences of the item associated with t (the higher the better) in S. The weight of an item is a value between zero and one that determines how close the rank of this item from its real rank.
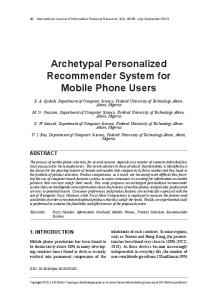
Fig.8 Quality Experiments for varying value of M. When M=0 it represents traditional collaborative filtering system and when M=1 it shows fully maintained pyramid. For M values between zero and one, the quality improvement of LAS increases for higher values of M due to the increase in recommendation locality. LAS achieves better quality improvement over LARS because LAS maintains α-Cells at lower levels of the pyramid. 3. Recommendation Quality using MAE Fig.shows quality improvement at varying ratio of training and test dataset(variable x).at x=0.5 value of MAE is 0.0156.
Fig. compares the quality improvement for varying locality (i.e., different levels of the adaptive pyramid) using the our dataset. The quality of LARS increases as more localized pyramid cells are used to produce recommendation, which verifies that user partitioning is indeed beneficial and necessary for location-based ratings. Fig.9 Quality Experiments for MAE. When value of x=0.8 it almost tend to 0.i.e. if the density of dataset increase it shows better performance without loosing the quality.
Fig.7 Quality Experiments for varying locality. 2. Recommendation Quality for Varying M These experiments compares the quality improvement achieved by both LARS and LAS for different values of M. Fig. depicts the effect of M on the quality of LARS using our data set. We report quality numbers using the pyramid height of four.
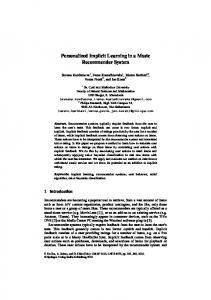
3. Recommendation Quality using MAE Fig.depicts the storage and aggregate maintenance overhead required for an increasing number of ratings. We again plot LAS-M=0 and LAS M=1 to indicate the extreme cases for LAS. As shown in fig. the impact of increasing the number of ratings from10K to 500K on storage overhead. LAS-M=0 requires the lowest amount of storage since it only maintains a single collaborative filtering model. LAS-M=1 requires the highest amount of storage since it requires storage of a collaborative filtering model for all cells (in all levels) of a complete pyramid. The storage requirement of LAS is in between the two extremes since it merges cells to save storage.
29
International Journal of Computer Applications (0975 – 8887) Volume 136 – No.8, February 2016 [11] W. G. Aref and H. Samet, “Efficient processing of window queries in the pyramid data structure,” in Proc. ACM Symp. PODS, New York, NY, USA, 1990. [12] R. A. Finkel and J. L. Bentley, “Quad trees: A data structure for retrieval on composite keys,” Acta Inf., vol. 4, no. 1, pp. 1–9, 1974. [13] A. Guttman, “R-trees: A dynamic index structure for spatial searching,” in Proc. SIGMOD, New York, NY, USA, 1984.
Fig.10[8] Scalability of adaptive pyramid using storage.
5. CONCLUSION LAS overcomes the problem faced by traditional recommender system. It uses User partitioning technique and travel penalty to concern with spatial ratings and spatial item ratings. Algorithm provides efficiency for sclability and locality. As CF model is maintained depending upon the number of α-cells in the pyramid it assuares quality of recommendations as well as fast response time as number of user goes on increasing.
6. REFERENCES [1] G. Linden, B. Smith, and J. York, “Amazon.com recommenda-tions: Item-to-item collaborative filtering,” IEEE Internet Comput., vol. 7, no. 1, pp. 76–80, Jan./Feb. 2003. [2] P. Resnick, N. Iacovou, M. Suchak, P. Bergstrom, and J. Riedl, “GroupLens: An open architecture for collaborative filtering of netnews,” in Proc. CSWC, Chapel Hill, NC, USA, 1994. [3] The facebook blog. Facebook Available: http://tinyurl.com/3aetfs3
Places
[Online].
[4] G. Adomavicius and A. Tuzhilin, “Toward the next generation of recommender systems: A survey of the state-of-the-art and pos-sible extensions,” IEEE Trans. Knowl. Data Eng., vol. 17, no. 6, pp. 734–749, Jun. 2005. [5] MovieLens [Online]. http://www.movielens.org/
Available:
[6] Foursquare [Online]. Available: http://foursquare.com [7] New York Times - A Peek into Netflix Queues [Online]. Available: http://www.nytimes.com/interactive/2010/01/10/nyregio n/ 20100110-netflix-map.html
[14] K. Mouratidis, S. Bakiras, and D. Papadias, “Continuous monitor-ing of spatial queries in wireless broadcast environments,” IEEE Trans. Mobile Comput., vol. 8, no. 10, pp. 1297–1311, Oct. 2009. [15] K. Mouratidis and D. Papadias, “Continuous nearest neighbor queries over sliding windows,” IEEE Trans. Knowl. Data Eng., vol. 19, no. 6, pp. 789–803, Jun. 2007. [16] M. F. Mokbel, X. Xiong, and W. G. Aref, “SINA: Scalable incremental processing of continuous queries in spatiotemporal databases,” in Proc. SIGMOD, Paris, France, 2004. [17] J. L. Herlocker, J. A. Konstan, L. G. Terveen, and J. T. Riedl, “Evaluating collaborative filtering recommender systems,” ACM TOIS, vol. 22, no. 1, pp. 5–53, 2004. [18] M. J. Carey and D. Kossmann, “On saying "Enough Already!" in SQL,” in Proc. SIGMOD, New York, NY, USA, 1997. [19] S. Chaudhuri and L. Gravano, “Evaluating top-k selection queries,” in Proc. Int. Conf. VLDB, Edinburgh, U.K., 1999. [20] R. Fagin, A. Lotem, and M. Naor, “Optimal aggregation algo-rithms for middleware,” in Proc. ACM Symp. PODS, New York, NY, USA, 2001. [21] J. Bao, C.-Y. Chow, M. F. Mokbel, and W.-S. Ku, “Efficient evalu-ation of k-range nearest neighbor queries in road networks,” in Proc. Int. Conf. MDM, Kansas City, MO, USA, 2010. [22] G. R. Hjaltason and H. Samet, “Distance browsing in spatial databases,” ACM TODS, vol. 24, no. 2, pp. 265– 318, 1999. [23] K. Mouratidis, M. L. Yiu, D. Papadias, and N. Mamoulis, “Continuous nearest neighbor monitoring in road networks,” in Proc. Int. Conf. VLDB, Seoul, Korea, 2006.
[8] J. J. Levandoski, M. Sarwat, A. Eldawy, and M. F. Mokbel, “LARS: A location-aware recommender system,” in Proc. ICDE, Washington, DC, USA, 2012.
[24] D. Papadias, Y. Tao, K. Mouratidis, and C. K. Hui, “Aggregate nearest neighbor queries in spatial databases,” ACM TODS, vol. 30, no. 2, pp. 529–576, 2005.
[9] B. Sarwar, G. Karypis, J. Konstan, and J. Riedl, “Itembased collab-orative filtering recommendation algorithms,” in Proc. Int. Conf. WWW, Hong Kong, China, 2001.
[25] S. Börzsönyi, D. Kossmann, and K. Stocker, “The skyline opera-tor,” in Proc. ICDE, Heidelberg, Germany, 2001.
[10] J. S. Breese, D. Heckerman, and C. Kadie, “Empirical analysis of predictive algorithms for collaborative filtering,” in Proc. Conf. UAI, San Francisco, CA, USA, 1998.
[26] M. Sharifzadeh and C. Shahabi, “The spatial skyline queries,” in Proc. Int. Conf. VLDB, Seoul, Korea, 2006. [27] N. Bruno, L. Gravano, and A. Marian, “Evaluating top-k queries over web-accessible databases,” in Proc. ICDE, San Jose, CA, USA, 2002.
30
International Journal of Computer Applications (0975 – 8887) Volume 136 – No.8, February 2016 [28] P. Venetis, H. Gonzalez, C. S. Jensen, and A. Y. Halevy, “Hyper-local, directions-based ranking of places,” PVLDB, vol. 4, no. 5, pp. 290–301, 2011. [29] M.-H. Park, J.-H. Hong, and S.-B. Cho, “Location-based recom-mendation system using Bayesian user’s preference model in mobile devices,” in Proc. Int. Conf. UIC, Hong Kong, China, 2007. [30] Netflix News and Info - Local Favorites [Online]. Available: http://tinyurl.com/4qt8ujo
history,” in Proc. Int. SIGMOD,Germany, 2006.
Conf.
UIC,
Berlin,
[32] V. W. Zheng, Y. Zheng, X. Xie, and Q. Yang, “Collaborative loca-tion and activity recommendations with GPS history data,” in Proc. Int. Conf. WWW, New York, NY, USA, 2010. [33] M. Ye, P. Yin, and W.-C. Lee, “Location recommendation for location-based social networks,” in Proc. ACM GIS, New York, NY, USA , 2010.
[31] Y. Takeuchi and M. Sugimoto, “An outdoor recommendation system in based on user location
IJCATM : www.ijcaonline.org
31