d Developme an n
t
l of Biodiv rna ers ou
g
oprospec tin , Bi ity
J
ISSN: 2376-0214
Journal of Biodiversity, Bioprospecting and Development
Research Article Review Article
Tripathi et al., J Biodivers Biopros Dev 2016, 3:2 http://dx.doi.org/10.4172/2376-0214.1000157
Open OpenAccess Access
Perspectives of Forest Biodiversity Conservation in Northeast India Shri Kant Tripathi1*, Arijit Roy2, Deepak Kushwaha2, Fanai Lalnunmawia1, Lalnundanga1, Hnialum Lalraminghlova3, Chalthleng Lalnunzira1 and Parth Sarathi Roy4 Department of Forestry, Mizoram University, Aizawl, Mizoram, India Indian Institute of Remote Sensing, Dehradun, Uttarakhand, India 3 Department of Environmental Science, Mizoram University, Aizawl, India 4 University Center of Earth and Space Science, Hyderabad, Telangana, India 1 2
Abstract Forests are major repositories of biodiversity and provide essential goods and services for humanity. Biodiversity loss is a major threat to forest ecosystem and emerging as a great challenge to humanity. Estimation of biodiversity or biological richness of a region is a difficult task that is an impossible goal without technological inputs. The Northeast India, part of Indo-Burma biodiversity hotspot, is one of the still relatively undisturbed regions of the world harbouring almost 50% of the flowering plant of the Indian subcontinent. This region is economically less developed and forests are under tremendous pressure from the anthropogenic influences mainly due to the local traditional shifting (jhum) cultivation practices. This article aims to bring an overview on current state of forest biodiversity and its conservation strategies in the Northeast India including traditional knowledge of conservation in this region. Further, the emphasis has been placed on various approaches of biodiversity characterization with the use of information technology like GIS to plan proper conservation and prioritization for sustaining the biodiversity of the region.
Keywords: Biodiversity; Conservation; Remote sensing; GIS; Northeast India
Introduction Forest biodiversity represents the variability of life in all its form and at all of its level of organization including structure, functioning and ecological processes [1-4]. It can be delineated into compositional diversity, structural diversity and the functional diversity that represents the whole gamut of diversity present within a forest [4,5]. The distribution and magnitude of the biodiversity that exists today has evolved over 3.5 billion years as a result of speciation, migration, extinction and recently human influences during the years. These processes mainly operated in natural vegetated areas and thus, the forest ecosystems have been the major repositories of biodiversity. The adverse effects of human impacts on forest biodiversity are increasing dramatically and threatening the foundation of sustainable development. Loss of biodiversity resources threatens our food supply chain, sources of wood, medicine and energy etc. and most precious ecosystem services. The need of the hour is conservation and sustainable use of biodiversity as an integral component of economic development [6,7]. The strength of biological diversity was at all-time high when the humans entered the industrial age with population of more than one billion; the natural resources then were abundant and freely available to sustain the humanity’s needs and development [8]. The increased multifarious human activities and overall negative indulgence with natural ecosystems and landscapes are destroying and changing magnitude of the earth’s carrying capacity to support life. The major anthropogenic factors like changes in land use, atmospheric CO2 concentration, nitrogen loading and acid rains, climate, and biotic exchanges (deliberate or accidental introduction of plant and animal species to an ecosystem) have been considered as leading drivers to cause deleterious effects on the biological diversity in the variety of ecosystems over the world [9]. Further, these authors have considered land use change as an important driver of change in tropical regions either singly or in combination with other. The current rate of tropical forest loss and disturbances has resulted in 5% to 10% loss of all forest J Biodivers Biopros Dev ISSN: 2376-0214 IJBBD, an open access journal
species in one decade during the last quarter century [10]. Large-scale alteration of the landscapes for economic, industrial and infrastructure development and consequent habitat degradation, fragmentation and depletion are considered to be the prime causes of biodiversity loss in tropics. Therefore, there is an urgent need to conserve germplasm in situ before it is lost forever, because a large percentage of biological wealth and its importance are still unknown to us. Many important species are lost particularly from the tropical regions before they are being known to science. The natural ecosystems are the repository of biodiversity and the tropical ecosystems have the largest share of the world’s vascular plant species i.e., 45% of the total as they provide a large number of species niches and thus distinctly prevail as the most complex ecosystems. India, the second most populous country in the world, is the eleventh mega-biodiversity center in the world and the third in Asia with its share of ~11% of the total plant resources. The floral wealth of India comprises more than 47,000 species including 43% vascular plants. Nearly 147 genera are endemic to India [11]. The vast geographical expanse of the country has resulted in enormous ecological diversity, which is comparable to continental level diversity scales across the world. It has representation of twelve biogeographic provinces, five biomes and three bioregions [12]. Natural forests and forest plantations together cover 21.02% of the geographical area in India. India, one of the twelve ‘Vavilovian Centres of Origin’ and diversification of cultivated plants, is known as the ‘Hindustan Centre of Origin of Crop Plants’ [13]. About 320 species belonging to 116 genera and 48 families
*Corresponding author: Shri Kant Tripathi, Department of Forestry, Mizoram University, Aizawl, Mizoram-796004, India, Tel: 0389 233 0654; E-mail:
[email protected] Received April 09, 2015; Accepted March 14, 2016; Published March 25, 2016 Citation: Tripathi SK, Roy A, Kushwaha D, Lalnunmawia F, Lalnundanga, et al. (2016) Perspectives of Forest Biodiversity Conservation in Northeast India. J Biodivers Biopros Dev 3: 157. doi:10.4172/2376-0214.1000157 Copyright: © 2016 Tripathi SK, et al. This is an open-access article distributed under the terms of the Creative Commons Attribution License, which permits unrestricted use, distribution, and reproduction in any medium, provided the original author and source are credited.
Volume 3 • Issue 2 • 1000157
Citation: Tripathi SK, Roy A, Kushwaha D, Lalnunmawia F, Lalnundanga, et al. (2016) Perspectives of Forest Biodiversity Conservation in Northeast India. J Biodivers Biopros Dev 3: 157. doi:10.4172/2376-0214.1000157
Page 2 of 9 of wild relatives of crop plants are known to have been originated in India [14]. Biodiversity is intricately related to the plant community as it determines the biological diversity of the ecosystem and provide the basis for the living for the animals in the ecosystems. Plant community influences the ecosystem functioning essential for the survival of the species, and its heterogeneity is an important indicator for biodiversity assessment at landscape level. Furthermore, plant species generally exists in association and any change in the species composition may lead to changes in the plant community resulting in changes to the native biodiversity of the region because of the dependence of other animals, birds and microbes. The change in the biodiversity is due to three basic ecological processes: 1) invasion of exotic plants; 2) progressive succession as a part of the ecological process and 3) retrogressive succession due to natural and anthropogenic pressures on the ecosystems. Assessment of the changes in the biodiversity or the state of the biodiversity is evident from the presence of indicator species and the distribution and the abundance of the keystone species. The loss of species and changes in the local and global climate and their future consequences is the main concern for ecologist and environmentalist over the world. In recent decades much interest has been focused on Earth’s biodiversity after the realization of their importance for human society and the ever increasing pressure posed by humans on these systems [6]. At present, biodiversity is accessed across the whole gamut of technological realms-right from molecular techniques, satellite technologies and computer based models of the climate. The ecologists are emphasizing the broader views of the planet Earth that includes the effect of life on earth, our role in influencing the species and ecosystem functioning, evolutionary changes in species and solutions to climate change effects on the earth [15]. Broader views on all aspects of biodiversity and ecosystem functioning are being evaluated (in >38 countries) over the World through the Long Term Ecological Research (LTER) networks (with >600 sites) which is on the way of development in the country like India through the Ministry of Environment and Forest, Government of India [16]. The human population has started realizing the significance of biodiversity after the formulation of United Nations Convention on Biological Diversity (UNCBD) during the United Nations Conference on Environment and Development (UNCED) at Rio de Janeiro in June 1992, which was aimed to conserve biodiversity, promote sustainable use of its components, and encourage suitable sharing of the benefits arising from the utilization of genetic resources. The Convention on Biological Diversity (CBD) obliges signatory nations to undertake an inventory of their biodiversity to provide basic information about its distribution and abundance. India was one of the first signatory’s
nations to CBD [17]. Natural ecosystems, the store houses of biodiversity, are being regulated by the variety of species present there, and thus certain threshold level of biodiversity is important for the proper functioning of the ecosystems below which they may not sustain their normal functioning [18]. Biodiversity is the basis for ecosystem services and life support system for humans. Human societies derive many essential goods (i.e., food, fodder, fuel, timber, pharmaceutics and energy) and services (i.e., air and water, decomposition of wastes, recycling of carbon and nutrients, regulation of climate, regeneration of soil fertility, and maintenance of biodiversity) from natural ecosystems [7,19]. This article presents an overview on current state of forest biodiversity and its conservation strategies in the Northeast India including traditional knowledge of conservation in northeast region in India. The article also discusses various approaches of biodiversity characterization and use of information technology mainly GIS to plan proper conservation and prioritization strategies for sustaining biodiversity in Northeast India.
Biodiversity of northeast india Northeast India is composed of eight states viz. Assam, Arunachal, Nagaland, Meghalaya, Manipur, Mizoram, Tripura and Sikkim (Table 1). Geographically, this region occurs at the juxtaposition of Indo-Malaya, Indo-China, Indo-Myanmar and Indo-Bangladesh and joins the foot-hill of Himalayan Mountains. The immense variety of the climatic, edaphic and altitudinal variations in this region pay the way for a great range of ecological habitats for the Northeast India. Basically, the region represents sub-tropical belt that extends from the foothill of Himalaya in the west to southeast China in the east. Besides, the Himalayan temperate and sub-alpine zone extends from Northern Pakistan and adjacent Afghanistan through Northeast India. Thus, this region is the geographic gateway for much of India’s variety of the living organisms, and constituting rich variation in the flora and fauna and as a consequence the region identified as Indo-Burma hotspot that is one of the 35 Global biodiversity hotspots recognized [20]. The eight states of Northeast India abode several endemic flora and fauna. Besides, the region has wide range of physiographic, cultural and economic diversity with certain inter and intra-state peculiarities. The region show wide topographical variations that vary from the flood plains of Assam to highest mountain peaks of Khanchanzonga (8586 m) in Sikkim. The region is characterized by highest rainfall areas like Cherrapunji (which has recently shifted to Mawsynram about 50 km apart from Cherrapunji) in Meghalaya. The states like Mizoram has highest percentage of forest cover with a characteristic of steep slopes [21]. The Northeast India, having high rainfall and favourable climatic
Forest Cover (km2) Assessment (2009) Geographical Area Moderately 2 (km ) Very Dense Forest Open Forest Dense Forest
Geographical Area (%)
Change compared to 2007 Assessment (km2)
Sl. No:
State
1
Arunachal Pradesh
83743
20868
31519
15023
67410
80.5%
-74
2
Assam
78438
1444
11404
14825
27673
35.07%
-19
3
Manipur
22327
730
6151
10209
17090
76.54%
-190
4
Meghalaya
22429
433
9775
7067
17275
77.02%
-46
5
Mizoram
21081
134
6086
12897
19117
90.68%
-66
6
Nagaland
16570
1293
4931
7094
13318
80.33%
-146
Total Forest
7
Sikkim
7096
500
2161
698
3359
47.34%
0
8
Tripura
10486
109
4686
3182
7977
76.04%
-8
9
Total
262170
25511
76713
70995
173219
66.07%
Table 1: Forest cover change in Northeast region of India [21].
J Biodivers Biopros Dev ISSN: 2376-0214 IJBBD, an open access journal
Volume 3 • Issue 2 • 1000157
Citation: Tripathi SK, Roy A, Kushwaha D, Lalnunmawia F, Lalnundanga, et al. (2016) Perspectives of Forest Biodiversity Conservation in Northeast India. J Biodivers Biopros Dev 3: 157. doi:10.4172/2376-0214.1000157
Page 3 of 9 conditions, occupies 7.7% of India’s total geographical area hosting 50% of the flowering plants (ca. 8000 species), of which 2526 species are endemic [11,20]. The region is described as the ‘cradle of flowering plants’ because of its diversified angiosperm and many important cultivated plant species and some domesticated animals are originated from this region [22-25]. The region is now experiencing severe alterations in land use and land cover type, due to shifting cultivation (locally known as jhuming), indiscriminate felling and illegal deforestation [26]. These coupled with socio-economic changes have caused loss of natural habitats and complex assemblies of species. About 0.45 million families in the northeast region annually cultivate 10,000 km2 forests, whereas, the total area affected by jhuming is believed to be 44,000 km2 [27]. With the phenomenal increase in the human population, the jhum cycle has been decreased (from 25-30 years earlier) to about 4-5 years and even less in some areas [28]. This has accelerated the process of degradation of natural ecosystems. The highest change was recorded in Manipur followed by Nagaland, Arunachal Pradesh, Mizoram and lowest in Sikkim with no change (Table 1). Therefore, for maintaining pristine biodiversity these complex ecosystems need to be conserved in situ. Area is not only a storehouse of endemic flowering plants but also hosts the reptile, amphibian and butterflies as well as mammals. Collecting information about the biodiversity of the parts of the Eastern Himalayas, an Indian hot spot for biodiversity, is a challenging task. The primitive flowering plants e.g., Magnolia pealiana, M. qustavii, Myrica esculenta; carnivorous plants like Nepenthes khasiana, Lilium mackliniae are listed in Annexure I of Convention on International Trade in Endangered Species of Wild Fauna and Flora [29]. This region originated some important gene pools of citrus, banana, mango and rice. Tropical forests found in Indo-Myanmar border area are dominated by Dipterocarpus macrophyllus, D. turbinatus; Shino-Japanese floristics elements, e.g., Quercus spp. Schima wallichi; Western China element like Aneneonerupiwla, Magnolia campbelli; Tibetan element like Hippophae; Siberian elements like Potentilla, Pedicularis etc. Out of the India’s 1300 species of orchids northeast region hosts to about 800 species. The listed threatened species includes Paphiopedillium spp., Vanda spp., Renanthera imschootiana, Cymbidium spp., Thunia marshalliana etc. Besides, there are many plants having great medicinal values like Dendrobium nobile, D. denudens, etc. Many species of Rhododendron sabode; edible plants like Parkia roxburghii, Clerodendrum colebrookianum and highly valued economic tree of Aquilariam alacensis are listed in Appendix II of CITES and schedule VI of the Wildlife Protection Act 1972. Hedychiums of Zingiberaceae family are common in the region. Out of 136 bamboo species recorded in India about 64 species are found in northeast region. The conifers of Pinus keysia; Gymnosperms of Cycas pectinata and Gnetum gnemon and broad-leaved Gymnosperms of Podocarpus neirifolia are present in the region. Of non-flowering plants like ferns, half of the total species recorded in the country are found in this region. Some important ferns are Dipteris wallichii, Asplenium nidus, Angiopteris evecta, Cythea gigantea etc. and fern-allies like Lycopodium and Sellaginella are also diverse in the region. Among saprophytic plants Ballanophora dioca, Aginitia indica, Manopar ahimalayana, Epipogium roseum, Euryale ferox etc. are botanical curiosities of the region. Recently Singh reported changes in plant diversity including medicinal plants and soil nutrients during stand development in subtropical semi-evergreen forest of Mizoram [30]. They reported that Schima wallichii was the dominant species in the degraded forest areas and less dominant in undisturbed areas. Castanopsis tribuloides was among the dominant species in the undisturbed and the moderately J Biodivers Biopros Dev ISSN: 2376-0214 IJBBD, an open access journal
disturbed but this species was replaced by Sterculia villosa in the highly disturbed stand, and the shift in position of species and families from undisturbed to highly disturbed stands has been reported to be linked with degree of disturbance.
Socio-economic and environmental issues in Northeast India Northeast region has highest forest cover (17.04 Mha) which is 66.81% of the total geographical area [31]. The region comprising eight sister states as stated above and can be physiographically categorized into the eastern Himalaya, Northeast hills and the Brahmaputra and Barak valley plains [32]. It is located at the confluence of the IndoChinese, Indo-Malayan and Afro-tropic bio-geographic realms [23,24]. The region provides a great variability of habitats and harbour diverse biota with high level of endemism [33]. Rich faunal and floral diversity with high degree of endemism in the region coupled with rapid changes due to development and resource exploitation has led to declaration of this region as one of the global biodiversity hotspot [34]. Northeast region is part of both “Himalaya” and “Indo-Burma” biodiversity hotspots. North east India harbours primary tropical to alpine forests in its almost undisturbed state due to variability in climate and topography and comparatively lesser disturbance in states like Arunachal Pradesh. The region is also rich in medicinal plants and several rare and endangered taxa [5,22,35,36]. The tribal population of the Northeast India constitutes about 30% of the total population and settled in hills with skewed manner. A majority of the tribes is having own forest land and they have marked as a private land with temporary boundary. Due to un-even distribution of tribe group or sub-tribe group, they are not able to avail basic government facilities such as sources of daily livelihood, food, school, medicine etc. In such condition the tribes totally depend on the forest resources for the livelihood and other necessary requirements. They adapted a unique socio-cultural aspect of this region which influences the forest cover is Shifting cultivation or Jhum to earn revenue for sustaining the life. Shifting cultivation, is a traditional system of agriculture carried out without tilling the soil, is often cited as a reason for the loss of forest cover of the region [37-40]. Shifting cultivation is the one of the major responsible driver of deforestation and degradation in Northeast India [41]. According to FSI about 2 Mha area of Northeast India has been affected due to shifting cultivation. Most of the states of northeastern India, primary dense forest become degraded into secondary open forest or scrubland within few years, which leads to biodiversity loss primarily because of the practicing shifting agriculture. On the basis of 2007 assessment, FSI has reported forest cover loss of 201 km2 in Nagaland between 2005-2007, followed by Arunachal Pradesh, Tripura and Assam losing 119, 100 and 66 km2 respectively to Jhum, fuel wood and timber extraction [42]. The reason of the extended shifting cultivation in last three decades is the absence of effective landuse policy. Present land use policy is based on totally traditional method which gives clear identity of land ownership to do anything for livelihood. Forest based industries were encouraged for revenue without considering of biodiversity hotspot areas. The saw mills has increased five times from last two decades which is also a responsible of clear cutting/logging of primary forest of blue pine and tropical evergreen forest of Arunachal Pradesh, Tripura, Manipur and Assam. Encroachment in forest land is also responsible for degradation in forest area which is totally influenced by political issues [43]. Several biodiversity hotspot areas across the border and in catchment area
Volume 3 • Issue 2 • 1000157
Citation: Tripathi SK, Roy A, Kushwaha D, Lalnunmawia F, Lalnundanga, et al. (2016) Perspectives of Forest Biodiversity Conservation in Northeast India. J Biodivers Biopros Dev 3: 157. doi:10.4172/2376-0214.1000157
Page 4 of 9 have been totally eliminated through illegal cutting by migrated populations from the neighboring country across the border area. Srivastava reported depletion of 232.19 km2 area between 1994 and 2001 in Sonitpur district, Assam due to clear cutting of the forest for valuable timber extraction [5]. Chatterjee and Dey have also reported that Taxus wallichiana has been logged in illegal way for the medicinal values [44]. Grazing, trampling and browsing through domestic cattle give the biotic pressure on the regenerated forest under present socioeconomic condition. The cattle entered in a biodiversity rich area in foothills as well as in other part of forest, where they consume younger plantation which leads to degradation of forest. It happened in those areas where the local/migrated people settled down in the vicinity of the forest and they release the cattle to graze anywhere in the forested area.
Biodiversity distribution in Northeast India According to recent studies by Roy the Northeast India, despite various anthropogenic pressures, has still stands one of the highest biodiversity ranking areas in the country [5]. The region has some of
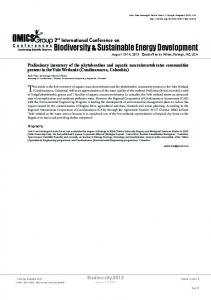
the extensive tropical evergreen forests in India. Since the Northeast India is the confluence of three different geological origins, the resultant biodiversity has evolved from association of biota from three different biogeographic realms [20]. The region has one of the least infrastructural developments in the South Asian region and has considerable forest cover. Geologically the region can be divided into the Himalayan Region, the Brahmaputra plains and the Garo and Khasi Hills in the south. Using satellite remote sensing and other spatial databases, around 19 forest types have been identified in Northeast (Figure 1). Among the dominant vegetation cover moist deciduous forest has the largest area (33900 km2), followed by subtropical broadleaf forest (26241 km2), Himalayan moist temperate (24559 km2), and semi-evergreen forests (13942 km2). Among the secondary vegetation, abandoned jhum contributes 22502 km2 in the entire north east India. This region has some of the richest contiguous forest in the country. Arunachal Pradesh has contiguous forests of more than 20868 km2 and harbours some of the richest biologically rich regions in the country.
Figure 1: Vegetation type and land-use map of Northeast India [5].
J Biodivers Biopros Dev ISSN: 2376-0214 IJBBD, an open access journal
Volume 3 • Issue 2 • 1000157
Citation: Tripathi SK, Roy A, Kushwaha D, Lalnunmawia F, Lalnundanga, et al. (2016) Perspectives of Forest Biodiversity Conservation in Northeast India. J Biodivers Biopros Dev 3: 157. doi:10.4172/2376-0214.1000157
Page 5 of 9 Forests of Northeast India showed varied levels of fragmentation (Figure 2) and are mostly influenced by the prevailing socio-economic practices and customs [5]. One of the most important causes of forest fragmentation in this region is shifting cultivation which is locally called ‘Jhum’. In fact more than 50% of the forest fragmentation in Mizoram and Manipur is due to jhum. In this region the moist deciduous forests have the maximum area under high fragmentation followed by subtropical broadleaf and semi-evergreen forests. The ease of access is one of the major factors influencing the fragmentation in these forests. Furthermore, the soil of these forests has high nutrient content and hence the indigenous people prefer these forests for practicing shifting cultivation. This practice is widespread in the region and causes significant loss to the health of forest and environment. Over the past century, fossil fuel combustion and agricultural activities have doubled the concentrations of reactive nitrogen (N) in the atmosphere that has resulted in significantly increased N deposition rates in industrialized regions of the world [45-49]. Chronic N deposition has been reported to cause N saturation in natural ecosystems that accelerate nutrient leaching, soil acidification and forest decline [50-53]. Singh and Tripathi reported the phenomenon of environmental nutrient loading, particularly N, and possible ecological implications of nutrient loads (N and P) in variety of natural and modified ecosystems in India [54]. Biomass burning and vehicular exhaust have led to increase in the emissions of greenhouse gases (like CO2, CO, CH4, N2O, NO) in the
atmosphere and consequently N loadings in the primary and secondary forests of this region. The state of Mizoram has the highest forest cover (~89% of the total land area) and burnt area (736 km2) for shifting cultivation leading to largest emissions of greenhouse gases [55]. The data on the biological richness in the Northeast India (Figure 3) showed the maximum area under high biological richness. The subtropical broadleaf forest had the highest area under very high biological richness (Figure 4) followed by semi-evergreen, evergreen and temperate coniferous forests [5].
Biodiversity conservation Northeast India is biodiversity rich zone occurs in the IndoBurma biodiversity hotspots. The region is experiencing high degree of anthropogenic pressure mainly because of age old shifting agriculture practice for livelihood of growing tribal population. In this system of agriculture, the piece of land is slashed and burned and the cultivated for one or two years then left abandoned for long time to restore the fertility. In the meantime farmers move to other places for the continuation of the same practice. This practice is detrimental for the health of forest and the environment of the region. Recently, Government of Mizoram has launched a New Land Use Policy (NLUP) for farmers to replace the age old shifting cultivation. In this policy, the Government provides monitory financial support for the farmers to
Figure 2: Fragmentation map of Northeast India [5].
J Biodivers Biopros Dev ISSN: 2376-0214 IJBBD, an open access journal
Volume 3 • Issue 2 • 1000157
Citation: Tripathi SK, Roy A, Kushwaha D, Lalnunmawia F, Lalnundanga, et al. (2016) Perspectives of Forest Biodiversity Conservation in Northeast India. J Biodivers Biopros Dev 3: 157. doi:10.4172/2376-0214.1000157
Page 6 of 9
Figure 3: Biological Richness map of Northeast India.
35000 30000 25000 20000 15000 10000 5000 0
Very High High Medium Low
Figure 4: Vegetation type wise distribution of biologically rich areas in Northeast India [5].
set up alternate source of income generation through dairy, piggery, poultry farms etc. for their livelihood. India’s national forest policy formulated in 1952 recommended 33% J Biodivers Biopros Dev ISSN: 2376-0214 IJBBD, an open access journal
forest cover in the country which was revised in 1988 and emphasized the need to maintain two third forest cover in hills and mountains. Government of India has launched different programs from time to
Volume 3 • Issue 2 • 1000157
Citation: Tripathi SK, Roy A, Kushwaha D, Lalnunmawia F, Lalnundanga, et al. (2016) Perspectives of Forest Biodiversity Conservation in Northeast India. J Biodivers Biopros Dev 3: 157. doi:10.4172/2376-0214.1000157
Page 7 of 9 time for the in situ conservation of biodiversity through protected area networks. Through protected area network, the country has 96 national parks, 603 wildlife sanctuaries including 18 biosphere reserves which cover about 4.8% of the geographical area of the country. Establishing protected area network is ongoing process and thus more area will be covered in the future. Table 2 includes a list of protected area networks (i.e., biosphere reserves, national parks, wildlife sanctuaries and tiger reserves) in different states of Northeast India. Most of the protected areas are having small size and are under the pressure because of the use and abuse of resources by the neighbouring human settlements. Another important conservation strategy by the community in India is sacred groves, which are protected to worship for their ancestral sprit and deities. Number of small and large sacred grooves has been reported to be as low as 5000 to as high as 100000 covering about 1%2% of the country’s geographical area and forms the repository of rich floral and faunal biodiversity in this region [56-59]. Thus systematic biodiversity conservation efforts would be required to conserve the biodiversity, with special attention in tropical regions. These efforts would require a critical monitoring and base line information in quantitative terms at each level of biodiversity organization, i.e., from gene to species and from regional to the global scales. A proper assessment in the form of concise numerical information showing intra-ecosystem and inter-ecosystem diversity will provide a base for modeling projected biodiversity change and strategies for its conservation [4]. Since biodiversity is a multidimensional concept so it cannot be expressed through a single scalar quantity. It can better be represented if it covers the range of information like geographical (latitude and longitude), abiotic (temperature and precipitation), taxonomic variety (taxonomic information of the species) and life form variations (size or the biomass) to describe the diversity of ecosystems [4]. It is a difficult task to record the compositional, structural and functional diversity of an ecosystem or a landscape. However, it is prerequisite to collect such information for the proper understanding of the global biodiversity assessment and better strategies for its conservation. Using the database generated as part of the Biodiversity characterization at landscape level, it is possible to prioritize the biologically rich areas most vulnerable to loss or degradation [5]. It is well known that patch sizes influence the rate of species loss [60]. Identification of biologically rich areas which have relatively smaller patches can provide critical insights into the distribution of the biologically rich areas with respect to the disturbances and fragmentation. It can be safely assumed that the smaller patches have the highest risk of endemic species loss (Table 3). On categorizing the patch sizes with landscape level biological richness in the Northeast India it was observed that most of the areas where the shifting cultivation is prevalent fall under high risk zone and should be put under highest priority for conservation practices. Further, improvement of conservation status of endemic species under threatened categories along with their abiotic conditions would be required by using critical site based information. For example, Adhikari has suggested improvement in conservation status of Ilex khasiana Purk, a critically endangered species endemic to Khasi hills of Northeast India, through Maximum Entropy distribution model using 16 environmental parameters from 16 localities of Khasi hill range [61].
Conclusion India encompasses a variety of climatic conditions (like tropical, subtropical, temperate, alpine etc.) due to wide variations in temperature and precipitation. Climatic variations make the country J Biodivers Biopros Dev ISSN: 2376-0214 IJBBD, an open access journal
Total Number Number Number of Number of Protected of Wildlife of Tiger Biospheres National Parks Area (km2) Sanctuary Reserves
Sl. No:
State
1
Arunachal Pradesh
5000
1
2
Assam
3010
3
Manipur
2500
4 Meghalaya 5
Mizoram
2
11
2
1
5
18
3
-
1
1
-
3500
2
2
3
-
2200
-
2
8
1
6
Nagaland
2250
-
1
3
-
7
Sikkim
4500
1
1
7
-
8
Tripura
1600
-
2
4
-
9
Total
24560
5
16
55
6
Table 2: Protected areas in Northeast region of India [21]. Sl. No:
Vegetation type
Area (Km2)
1
Evergreen
5245.89
% of Area 2.11
2
Sub-tropical broad leaved
26241.4
10.54
3
Montane wet temperate
1423.82
0.57
4
Himalayan moist temperate
24559.5
9.86
5
Sub alpine
246.06
0.1
6
Semi-evergreen
13942.53
5.6
7
Moist deciduous
33900.76
13.61
8
Sal mixed moist deciduous
0.01
0
9
Teak mixed moist deciduous
0.15
0
10
Temperate coniferous
4467.13
1.79
11
Sal
513.96
0.21
12
Teak
16.84
0.01
13
Dipterocarpus
851.53
0.34
14
Bamboo
7668.8
3.08
15
Pine
2196.98
0.88
16
Fir
141.59
0.06
17
Fresh water swamp forest
197.25
0.08
18
Riverine
0.02
0
19
Sacred groves
25.46
0.01
20
Cryptomeria
2.42
0
21
Degraded forest
8362.35
3.36
22
Current jhum
9683.17
3.89
23
Scrub
5518.45
2.22
24
Moist alpine scrub
4551.7
1.83
25
Grassland
5723.35
2.3
26
Riverine grasslands
147.09
0.06
27
Swampy grassland
409.72
0.16
28
Orchard
5701.84
2.29
29
Tea
0.02
0
30
Agriculture
45712.82
18.35
31
Abandoned jhum
22502.53
9.03
32
Barren land
913.13
0.37
33
River bed
4126.4
1.66
34
Water body
4503.18
1.81
35
Wet lands
288.88
0.12
36
Settlement
660.73
0.27
37
Snow
8535.96
3.43
38
Unclassified
92.68
0.04
39
Total Area
249076.1
100
Table 3: Area covered by different vegetation types in Northeast India [5].
Volume 3 • Issue 2 • 1000157
Citation: Tripathi SK, Roy A, Kushwaha D, Lalnunmawia F, Lalnundanga, et al. (2016) Perspectives of Forest Biodiversity Conservation in Northeast India. J Biodivers Biopros Dev 3: 157. doi:10.4172/2376-0214.1000157
Page 8 of 9 rich in flora and fauna making it a ‘mega biodiversity country’ in the world. Geographically, India has about 2.4% of the total land area of the world but it accounts for about 8% of the total number of species found over the world. Because of the rich biodiversity wealth of the country, critical biodiversity assessment and its conservation strategies is important task ahead among the ecologists and the environmentalists. In the past, the species diversity has been reported mainly on the basis of the data collected on number of species present within the ecosystem through phyto-sociological measurements that do not account for the biodiversity in total. To have complete information about the biodiversity of the region requires use of advance technological tools like remote sensing and GIS in addition to the field data. Biological status of forests in a hotspot includes the basic information regarding the forest structure, species density, mean basal area, the diversity index, etc. Moreover, parameters like the area under different forest covers, the ecologically and medicinally important trees/plants, and their uses will help us to understand the threats on the local flora and plans can be made for biodiversity conservation. References 1. Chapin FS, Sala OE, Huber-Sannwald E (2001) Global biodiversity in changing environment. Ecological Studies, Springer p: 376.
resource availability, and larger scale processes regulating arboreal ant species richness. Australian Ecology 28: 305-314. 19. Costanza R, Ralph A, Rudolf De G, Stephen F, Monica G, et al. (1997) The Value of the World’s Ecosystem Services and Natural Capital. Nature 387: 253260. 20. Myers N (1988) Threatened biotas: “hot spots” in tropical forests. Environmentalist 8: 187-208. 21. SFR (2011) India State of Forest Report 2011. Forest Survey of India, Government of India Publication, Dehradun. 22. Jain SK, Rao RR (1983) An assessment of threatened plants of India. Botanical Survey of India, Calcutta. 23. Takhtajan A (1969) Flowering Plants-Origin and Dispersal. Oliver & Boyd Ltd, Edinburgh. 24. Takhtajan A (1969) Flowering Plants-Origin and Dispersal. Tr. Jeffrey, Edinburgh. 25. Agarwal KC (1996) Biodiversity. Agra Botanical Publishers, India. 26. Roy PS, Tomar S (2000) Biodiversity characterization at landscape level using geospatial modelling. Biological Conservation 95: 95-109. 27. Anonymous (2009) Report of the inter-ministerial national task force on rehabilitation of shifting cultivation areas. Report submitted to the Ministry of Environment and Forests, Government of India p: 95.
2. Tilman D, Reich PB, Knops J, Wedin D, Mielke T, et al. (2001) Diversity and productivity in a long-term grassland experiment, Science 294: 843-845.
28. Grogan P, Lalnunmawia F, Tripathi SK (2012) Shifting cultivation in steeply sloped regions: a review of management options and research priorities for Mizoram state, Northeast India. Agroforestry Systems 84: 163-177.
3. Norberg J, Swaney DP, Dushoff J, Lin J, Casagrandi R, et al. (2001) Phenotypic diversity and ecosystem functioning in changing environments: A theoretical frame work. Proceedings National Academy of Sciences, USA 98: 1137611381.
29. CITES (1973-2013) Convention on International Trade in Endangered Species of Wild Fauna and Flora: an International agreement between the Governments to ensure that the International trade in specimen of wild animals and plants does not threaten their survival.
4. Roy A, Tripathi SK, Basu SK (2004) Formulating diversity vector for ecosystem comparison. Ecological Modeling 179: 499-513.
30. Singh SHB, Mishra BP, Tripathi SK (2015) Recovery of plant diversity and soil nutrients during stand development in subtropical forests of Mizoram, Northeast India. Biodiversitas 16: 205-2012.
5. Roy A, Srivastava VK (2012) Geospatial approach to identification of potential hotspots of land-use and land-cover change for biodiversity conservation. Current Science 102: 1174-1180.
31. FSI (2009) State of Forest Report 2009, Forest Survey of India, Ministry of Environment and Forests, Dehradun.
6. Heywood VH, Watson RT (1995) Global biodiversity assessment. Cambridge University Press, Cambridge p: 1140.
32. Rodgers WA, Panwar SH (1988) Biogeographical classification of India. New Forest, Dehradun.
7. Maynard S, James D, Davidson A (2010) The development of an Ecosystem Services Framework for South East Queensland. Environ Manage 45: 881-895.
33. Myers N, Mittermeier RA, Mittermeier CG, da Fonseca GA, Kent J (2000) Biodiversity hotspots for conservation priorities. Nature 403: 853-858.
8. Chowdhary HJ, Murti SK (2000) Plant Diversity and Conservation in India-An Overview. BSI, Dehradun.
34. CI (2009) Conservation International. Annual Report pp: 1-42.
9. Sala OE, Chapin FS, Stuart F, Armesto JJ, Eric Berlow, et al. (2000) Global Biodiversity Scenarios for the Year 2100. Science 287: 1770-1774. 10. McNeely JA, Miller KR, Reid WV, Mittermeir RA, Werner TB (1990) Conserving the world’s biological diversity. International Union for Conservation of Nature and Natural Resources, World Resources Institute, Conservation International, World Wildlife Fund-US and the World Bank, Washington, DC. 11. Nayar MP (1996) Hot Spots of Endemic Plants of India, Nepal and Bhutan. Tropical Botanical Garden and Research Institute, Thiruvananthapuram. 12. Cox CB, Moore PD (1993) Biogeography: an ecological and evolutionary approach. Blackwell Publications, Oxford p: 326. 13. Vavilov NI (1951) The Origin, Variation, Immunity and Breeding of Cultivated Plants: Selected Writings. Ronald Press, New York. 14. Arora RK, Nayar ER (1984) Wild relatives of crop plants in India. NBPGR Sci. National Bureau of Plant Genetic Resources, New Delhi. 15. Tripathi SK (2009) Dimensions of ecology: from global change to molecular ecology. Current Science 97: 1527-1528. 16. Tripathi SK (2010) The need for establishing long-term ecological research stations network in India. Current Science 98: 21-22. 17. CBD (1992) Convention on Biological Diversity: text and annexes. Secretariat of the Convention on Biological Diversity, Montreal, Canada pp: 1-34. 18. Ribas CR, Schoereder JH, Pic M, Soares SM (2003) Tree heterogeneity,
J Biodivers Biopros Dev ISSN: 2376-0214 IJBBD, an open access journal
35. IUCN (1995) World Conservation Union, Centres of Plant Diversity: Asia, Australia and the Pacific. IUCN Publications Services Unit, Cambridge, UK. 36. IIRS (2002) Indian Institute of Remote Sensing, Biodiversity Characterization at Landscape Level in North East India Using Satellite Remote Sensing and Geographic Information System. Joint project of Department of Biotechnology and Department of Space, Government of India. 37. Roy PS, Harish K, Kushwaha SPS, Roy A, Saran S (2012) India’s plant diversity database at landscape level on geospatial platform: prospects and utility in today’s changing climate. Current Science 102: 1136-1142. 38. Ramakrishnan PS (1981) Cropping and yields in agricultural systems of the northeastern hill region of India. Agro-Ecosystems (7) in Shifting Cultivation and Sustainable Development. Man and the Biosphere Series, Paris/New Delhi: UNESCO/Oxford University Press pp: 11-25. 39. Uhl C, Jordan CF, Montagnini E (1983) Traditional and Innovative approaches to agriculture on Amazon basin terra firma sites: in Nutrient cycling in agricultural ecosystems pp: 73-95. 40. Kushwaha SPS (1990) Forest-type mapping and change detection from satellite imagery. ISPRS Journal of Photogrammetry and Remote Sensing 45: 175-181. 41. Borthakur DN (2002) Shifting cultivation in North-East India. An approach towards control. In Deb Bimal J, Development priorities in North-East India. Concept Publishing Company, New Delhi, India. 42. FSI (2007) State of Forest Report 2005, Forest Survey of India, Ministry of Environment and Forests, Dehradun.
Volume 3 • Issue 2 • 1000157
Citation: Tripathi SK, Roy A, Kushwaha D, Lalnunmawia F, Lalnundanga, et al. (2016) Perspectives of Forest Biodiversity Conservation in Northeast India. J Biodivers Biopros Dev 3: 157. doi:10.4172/2376-0214.1000157
Page 9 of 9 43. Kumar, Anuradha (2002) A controversial eviction drive. Frontline 19: 1-15. 44. Chatterjee S, Dey S (1997) A preliminary survey of Taxus baccata var. wallichiana in Tawang district of Arunachal Pradesh. Indian Forester 8: 746754. 45. Driscoll CT, Whitall D, Aber J, Boyer E, Castro M, et al. (2003) Nitrogen pollution in the northeastern United States: sources, effects, and management options. Bioscience 53: 357-374. 46. Galloway JN, Aber JD, Erisman JW, Seitzinger SP, Howarth RW, et al. (2003) The nitrogen cascade. Bioscience 53: 341-356. 47. Elliott EM, Kendall C, Wankel SD, Burns DA, Boyer EW, et al. (2007) Nitrogen isotopes as indicators of NOx source contributions to atmospheric nitrate deposition across the Midwestern and north-eastern United States. Environ Sci Technol 41: 7661-7667. 48. Galloway JN, Cowling EB (2002) Reactive nitrogen and the world: 200 years of change. Ambio 31: 64-71. 49. Holland EA, Dentener FJ, Braswell BH, Sulzman JM (1999) Contemporary and pre-industrial global reactive nitrogen budgets. Biogeochemistry 46: 7-43. 50. Aber JD, Nadelhoffer KJ, Steudler P, Melillo JM (1989) Nitrogen saturation in northern forest ecosystems. Bioscience 39: 378-386.
54. Singh KP, Tripathi SK (1999) Impact of environmental nutrient loading on the structure and functioning of terrestrial ecosystems. Curr Sci 79: 316-323. 55. Chand TRK, Badarinath KVS (2007) Quantification of trace gas emissions from shifting cultivation areas using remote sensing and ground-based measurements. Current Science 92: 891-894. 56. Malhotra KC (1998) Anthropological dimensions of sacred groves in India: An overview. In: Ramakrishnan PS, Saxena KG, Chandrashekara UM (eds.) Conserving the Sacred for Biodiversity Management, Oxford and IBH Publishing Co, New Delhi pp: 423-38. 57. Mishra BP, Tripathi OP, Tripathi RS, Pandey HN (2004) Effect of Anthropogenic disturbance on plant diversity a red community structure of Sacred Grove in Meghalaya North east India. Biodiversity and conservation 13: 421-436. 58. Khan ML, Khumbongmayum AD, Tripathi RS (2008) The Sacred groves and their Significance in conserving biodiversity: An Overview. International J Ecol Environ Sci 34: 277-291. 59. Pushpangdan P, Rajebdraprasad M, Krishnan PN (1998) Sacred groves of Kerala. In: Ramakrishnan PS, Saxena KG, Chandrasekar UM. Conserving the Sacred: For Biodiversity Management. Oxford and IBH Publishing Co, New Delhi p: 480.
51. Agren GI, Bosatta E (1988) Nitrogen saturation of terrestrial ecosystems. Environ Pollut 54: 185-197.
60. Prugh LR, Hodges KE, Sinclair AR, Brashares JS (2008) Effect of habitat area and isolation on fragmented animal populations. Proc Natl Acad Sci, USA 105: 20770-20775.
52. Magill AH, Downs MR, Nadelhoffer KJ, Hallett RA, Aber JD (1996) Forest ecosystem response to four years of chronic nitrate and sulfate additions at Bear Brooks Watershed, Maine, USA. For Ecol Manag 84: 29-37.
61. Adhikari D, Barik SK, Upadhyay K (2012) Habitat distribution modelling for reintroduction of Ilex khasiana Purk: a critically endangered tree species of northeastern India. Ecological Engineering 40: 37-43.
53. McNulty SG, Aber JD, Newman SD (1996) Nitrogen saturation in a high elevation New England spruce-fir stand. For Ecol Manag 84: 109-121.
OMICS International: Publication Benefits & Features Unique features: • • •
Increased global visibility of articles through worldwide distribution and indexing Showcasing recent research output in a timely and updated manner Special issues on the current trends of scientific research
Special features:
Citation: Tripathi SK, Roy A, Kushwaha D, Lalnunmawia F, Lalnundanga, et al. (2016) Perspectives of Forest Biodiversity Conservation in Northeast India. J Biodivers Biopros Dev 3: 157. doi:10.4172/2376-0214.1000157
J Biodivers Biopros Dev ISSN: 2376-0214 IJBBD, an open access journal
• • • • • • • •
700+ Open Access Journals 50,000+ editorial team Rapid review process Quality and quick editorial, review and publication processing Indexing at major indexing services Sharing Option: Social Networking Enabled Authors, Reviewers and Editors rewarded with online Scientific Credits Better discount for your subsequent articles
Submit your manuscript at: http://www.omicsonline.org/submission
Volume 3 • Issue 2 • 1000157