8048 Vol. 10, 8048 – 8058, December 1, 2004
Clinical Cancer Research
Pharmacokinetic Model-Predicted Anticancer Drug Concentrations in Human Tumors James M. Gallo,1 Paolo Vicini,2 Amy Orlansky,1 Shaolan Li,1 Feng Zhou,1 Jianguo Ma,1 Sharon Pulfer,1 Michel A. Bookman,3 and Ping Guo1 1
Departments of Pharmacology and 3Medical Oncology, Fox Chase Cancer Center, Philadelphia, Pennsylvania; 2Department of Biomedical Engineering, University of Washington, Seattle, Washington
ABSTRACT In an era when molecular and targeted anticancer therapeutics is a major focus and when understanding drug dynamics in tumor is critical, it seems advantageous to be able to relate drug concentrations in tumors to corresponding biological end points. To that end, a novel method, based on physiologically based hybrid pharmacokinetic models, is presented to predict human tumor drug concentrations. Such models consist of a forcing function, describing the plasma drug concentration-time profile, which is linked to a model describing drug disposition in tumors. The hybrid models are originally derived from preclinical data and then scaled to humans. Integral to the scale-up procedure is the ability to derive human forcing functions directly from clinical pharmacokinetic data. Three examples of this approach are presented based on preclinical investigations with carboplatin, topotecan, and temozolomide. Translation of these preclinical hybrid models to humans used a Monte Carlo simulation technique that accounted for intrasubject and intersubject variability. Different pharmacokinetic end points, such as the AUC tumor, were extracted from the simulated human tumor drug concentrations to show how the predicted drug concentrations might be used to select drug-dosing regimens. It is believed that this modeling strategy can be used as an aid in the drug development process by providing key insights into drug disposition in tumors and by offering a foundation to optimize drug regimen design.
Received 4/29/04; revised 9/2/04; accepted 9/2/04. Grant support: Partial grant support provided by NIH grants, CA72937 (J. M. Gallo) and CA83638 (J. M. Gallo), a Specialized Program of Research Excellence in Ovarian Cancer, and P41 EB001975 (P. Vicini). The costs of publication of this article were defrayed in part by the payment of page charges. This article must therefore be hereby marked advertisement in accordance with 18 U.S.C. Section 1734 solely to indicate this fact. Requests for reprints: James. M. Gallo, School of Pharmacy, Temple University, 3307 N. Broad St., Philadelphia, PA 19140. Phone: 215707-9699; Fax: 215-707-3678; E-mail:
[email protected].
INTRODUCTION The development of anticancer drugs is an enormous undertaking requiring substantial financial and scientific resources. A primary goal of this arduous process is to identify one or more agents possessing desired therapeutic, toxicological, and pharmacokinetic profiles. Promising drug candidates that meet in vitro benchmarks of activity will be screened for pharmacokinetic properties in, typically, two animal species either as single administrations or in a cassette dosing format (1, 2). Rapid drug elimination or poor oral bioavailability are the most likely drug properties that will support termination of drug development. Favorable pharmacokinetic profiles illicit a host of toxicological studies and usually additional pharmacokinetic investigations. Therapeutic efficacy studies in animal models for anticancer drugs may either precede or follow the pharmacokinetic profiling studies. Regardless of the sequence of pharmacokinetic, toxicological, and efficacy studies, measurement of drug or active metabolite concentrations in solid tumors and the subsequent development of associated pharmacokinetic models is not a routine process and certainly not mandated by regulatory requirements. Thus, it is quite feasible for leading drug candidates to enter phase I clinical trials without a comprehensive profile of tumor drug concentrations. The absence of this information is unfortunate on a number of counts, not the least of which is the lack of understanding of what factors impact on drug penetration into tumors. Phase I clinical trials are routinely initiated at drug doses chosen from toxicity considerations, for example, starting doses may be 1/10th of the LD10 in a mouse (3). The choice of the drug administration schedules are most often chosen semiempirically, which facilitates multiple treatment regimens to flourish. Given this drug development standard, it is a reasonable assertion that ample consideration has not been given to how tumor drug concentrations in preclinical models might be used to aid the drug development process and to foster the rational design of drug administration regimens in humans. We chose to address this deficiency through the development and application of physiologically based hybrid pharmacokinetic models (4, 5). These models consist of a forcing function, an equation describing plasma drug concentrations, and a tissue or tumor compartment that can retain the physiologic attributes, such as organ blood flow, of the tissue. Forcing functions have also been used in the development of complex models for bone-seeking elements (6) and the analysis of imaging data (7). The compact nature of the hybrid model, requiring drug concentration measurements in two tissues, plasma and tumor, enables preclinical models to be scaled to predict human tumor drug concentration measurements. This “scaling procedure” can be accomplished by substitution of a human forcing function, readily derived from available clinical pharmacokinetic data. The often referred to global physiologically based pharmacokinetic models that are based on multiple tissue compartments and
Clinical Cancer Research 8049
associated drug concentration measurements require a complex scale-up methodology that does not take advantage of a forcing function (8 –10). We chose two preclinical investigations in which to show how preclinical hybrid models could subsequently be applied to predict human tumor drug concentrations. One investigation involved the combination of carboplatin and topotecan administered to rats bearing intraperitoneal tumors, a syngeneic model of ovarian cancer (11). The second investigation used a xenograft model of brain tumors that overexpressed vascular endothelial growth factor (VEGF; ref. 12) to examine temozolomide tumor concentrations, assessed by microdialysis, in the absence and presence of TNP-470, an angiogenesis inhibitor. From a modeling perspective, the goals were to devise pharmacokinetic models to characterize carboplatin, topotecan, and temozolomide disposition in animal tumors and then to scale the models to predict drug concentrations in human tumors.
MATERIALS AND METHODS Drugs and Chemicals Topotecan was kindly provided by Glaxo Smith Kline (King of Prussia, PA). Temozolomide was kindly provided by Schering-Plough (Kenilworth, NJ). Carboplatin [cis-diammine (1,1-cyclobutanedicarboxylato)-platinum] was purchased from Sigma Chemical Co. (St. Louis, MO). ␣-D-Glucose was purchased from Aldrich Chemical Company, Inc. (Milwaukee, WI), and USP 0.9% sodium chloride injection was purchased from Abbott Laboratories (North Chicago, IL). Drug-free rat plasma was purchased from Lampire Biological Laboratories (Pipersville, PA). High-performance liquid chromatography (HPLC)-grade acetonitrile and acetic acid were purchased from Fisher Scientific (Fair Lawn, NJ). Purified water was obtained from a Nanopure deionization system (Barnstead/Thermolyne, Dubuque, IA) and was used for all aqueous solutions. Bond Elut SCX cartridges (100 mg/1 mL) were purchased from Varian Incorporated (Harbor City, CA). Centrifree centrifugal filter devices were purchased from Millipore (Bedford, MA). Preclinical Pharmacokinetic Studies of Carboplatin and Topotecan NuTu19 cells were grown to about 80% confluency in RPMI 1640 with 10% fetal bovine serum at 37°C, 5% CO2 as described previously (11). The media were removed, and the cells were trypsinized with 0.04% trypsin/EDTA, centrifuged at 1,000 rpm for 10 minutes and resuspended in RPMI 1640 at a concentration of 25 ⫻ 106 cells/mL for implantation. Fischer 344 female rats (130 to 150 g) were implanted intraperitoneally with 15 ⫻ 106 NuTu19 tumor cells and allowed to grow for about 30 days. Rats were anesthetized with a 3:2:1 (v/v/v) mixture of ketamine hydrochloride (100 mg/mL): acepromazine maleate (10 mg/mL):xylazine hydrochloride (20 mg/mL) at a dose of 1 mL/kg. The right common carotid artery and jugular vein were exposed, and two polyethylene 50 cannulas were implanted with the tips directed toward the heart. Arterial cannulas were used for drug administrations, and jugular vein cannulas were used for blood sampling. The cannulas were tied into place and exteriorized at the back of the neck. Animals were allowed to recover with food and water allowed
ad libitum for at least 12 hours before entering the pharmacokinetic studies. On the basis of the sequence-dependent toxicity reported in patients, carboplatin and topotecan were administered in two combination sequences (13, 14). The CT sequence consisted of 30 mg/kg of carboplatin administered on day 1 followed by 0.5 mg/kg of topotecan given on days 1 to 3. The reverse TC sequence used 0.5 mg/kg of topotecan on days 1 to 3 followed by 30 mg/kg of carboplatin on day 3. Preliminary pharmacokinetic studies, consisting of single agent administrations of carboplatin and topotecan at different dose levels, were used to choose drug doses for the combination studies. In both the CT and TC sequences, carboplatin and topotecan were given as 30-minute constant rate intraarterial infusions in 5% D-glucose and normal saline, respectively. Two study designs were used to obtain plasma and tumor drug concentration measurements over a time period from 30 to 510 minutes and from 30 to 540 minutes for carboplatin and topotecan, respectively. Serial blood sampling protocols with frequent sample collections were used to define the forcing function (see below) for each drug, whereas serial sacrifice designs were used to collect tumor samples. For carboplatin, 250 L blood samples were centrifuged to obtain plasma and then stored at ⫺80°C until analyzed by a liquid chromatography-mass spectrometry method (15). Plasma was quickly harvested from topotecan blood samples and then immediately precipitated with cold methanol (plasma:methanol, 1:3 v/v). After centrifugation, the resultant supernatant was stored at ⫺80°C until analyzed for the lactone form by HPLC (16). Tumors analyzed for either carboplatin or topotecan were rapidly removed after sacrifice and stored at ⫺80°C until analyzed by either liquid chromatography-mass spectrometry method for carboplatin (15) or by HPLC, for topotecan lactone. Preclinical Pharmacokinetic Studies of Temozolomide We have previously studied the pharmacokinetics of temozolomide in preclinical xenograft models of brain tumors in an effort to determine how antiangiogenic drugs might influence the tumor concentrations of temozolomide (17, 18). These investigations used steady-state administration schedules of temozolomide in nude rats bearing brain tumor xenografts. Another study has been completed in the same xenograft model that used a nonsteady-state administration schedule of temozolomide to facilitate the definition of a pharmacokinetic model for temozolomide in the tumor. These data were used herein to develop a preclinical pharmacokinetic model for temozolomide that was subsequently applied to humans. Male adult nude rats bearing subcutaneous gliomas derived from human SF188 glioma cells that overexpressed VEGF (12), referred to as V⫹ tumors, received implantation of both a carotid artery and jugular vein cannula on the last day of a 9-day treatment regimen of either TNP-470 30 mg/kg (administered every 48 hours for a total of 5 doses) or vehicle control subcutaneously. On the following day, linear microdialysis probes were inserted into the tumors and perfused with Ringer’s solution at a rate of 2 L/minute. After an approximate 45-minute equilibration period, 40 mg/kg of temozolomide was given at a 10-minute constant rate infusion intra-arterially followed by serial collection of blood via the jugular vein cannula and dialysate fluid exiting the probe. Dialysate samples were col-
8050 Model-Predicted Anticancer Drug Concentrations
lected directly into individual vials that contained 5 L of 1 eq/L HCl to preserve the chemical stability of temozolomide. Plasma and the dialysate fluid samples were stored at ⫺80°C until analyzed for temozolomide by HPLC (17). Drug Concentration Analyses Carboplatin. We have reported previously a liquid chromatography-mass spectrometry method to measure carboplatin in plasma and tissues (15). Both intra-day and inter-day accuracy, expressed as the percentage of bias, and precision, expressed as the percentage of coefficient of variation, values were ⬍15% for both plasma and tumor samples. Topotecan. Plasma (20 L) was extracted with 60 L of cold methanol (⫺20°C) immediately after separation from blood by vortexing for 10 seconds. After centrifugation for 1 minute at 10,000 rpm, the methanol extract was stored at ⫺80°C until analyzed. For analysis of the lactone form of topotecan, 50 L of the thawed methanol extract was diluted with water, between 50 to 450 L, and then aliquots of 30 L were injected onto the HPLC within 5 minutes. We prepared tumor homogenates in water at a ratio of 1:4 (g/ml) in an ice bath using a mechanical homogenizer (Tekmar, Cincinnati, OH). An aliquot of the homogenate (100 L) was extracted with 300 L of cold methanol (⫺20°C) by vortexing for 30 seconds and then centrifuged for 2 minutes at 10,000 rpm. For measurement of the lactone form of topotecan, 90 L of the methanol extract was diluted with 90 L of water with 90 L of the resultant mixture injected onto the HPLC within 5 minutes. We separated topotecan on a reversed-phase analytical column (Zorbax SB C18, 75 ⫻ 4.6 mm, 3.5 m particle size, Hewlett-Packard, Palo Alto, CA) using a mobile phase (0.9 mL/minute) of methanol:water (47:53, v/v) that contained 10 mmol/L N,N,N⬘,N⬘-tetramethylethylenediamine and 17.2 mmol/L hexanesulfonic acid (pH 6.0 adjusted by H3PO4). Eluents were detected by fluorescence at an excitation wavelength of 382 nm and an emission wavelength of 512 nm. The above methods provided intra-day accuracy and precision values of ⬍8% for both plasma and tumor samples, whereas corresponding inter-day values were normally ⬍15%, except at the lowest tumor concentration of 11 ng/g, in which the precision was 19%. Temozolomide. Our method for the determination of temozolomide in plasma and interstitial fluid samples has been reported previously (17). Both intra-day and inter-day accuracy and precision values were ⬍15% for both plasma and dialysate samples. Preclinical Pharmacokinetic Models. The pharmacokinetic models used to characterize carboplatin, topotecan, and temozolomide in tumors can be classified as hybrid physiologically based pharmacokinetic models (4). Hybrid pharmacokinetic models were designed to focus on a single tissue of interest, such as a tumor, and avoid the complexities and considerable resources of developing a global or whole animal physiologic model. The hybrid pharmacokinetic model can retain a physiologic representation of the tissue that can facilitate greater insight on the variables that influence drug disposition. There are two components of a hybrid pharmacokinetic model, a forcing function describing the plasma drug concentrationtime profile and the model for the tissue.
The procedure to develop hybrid pharmacokinetic models for carboplatin and topotecan coupled the plasma drug concentration measurements obtained from the serial blood sampling studies with the tumor drug concentration measurements from the serial sacrifice studies into a single modeling exercise. Because there were multiple plasma and tumor drug concentrations values at each time point as a result of pooling the data, a weighting function equal to the reciprocal of the individually determined variance of the measured concentrations at each time point was used. Different compartment models were fit by weighted least-squares regression to the pooled observed plasma and tumor concentrations for either carboplatin or topotecan. One, two, and three compartment models were examined for the plasma drug concentrations, whereas one and two compartment models were evaluated for the tumor models. The hybrid pharmacokinetic model for temozolomide was based on the combined serial plasma and interstitial fluid temozolomide concentrations. The availability of tumor interstitial fluid drug concentrations facilitated the use of models that depicted a separate compartment for interstitial fluid. Similar to the model development procedure for carboplatin and topotecan, the measured temozolomide concentrations from individual animals were pooled into a single data set. These data were available for temozolomide under both vehicle control and TNP-470 treatment conditions; thus, a hybrid pharmacokinetic model was attained for each treatment condition. These two treatment conditions coincided with our interest in examining how angiogenesis inhibitors, such as TNP-470, might alter temozolomide concentrations in tumors. The best-fit hybrid pharmacokinetic models for carboplatin, topotecan, and temozolomide were chosen based on statistical criteria generated by the SAAM II computer program (ref. 19; available from the SAAM Institute, Inc., Seattle, WA3), which included the Akaike Information Criteria, to judge model parsimony, and asymptotic SDs of the fitted parameters, to judge model identifiability. Clinical Pharmacokinetic Models. Hybrid pharmacokinetic models were used to predict human tumor carboplatin, topotecan, and temozolomide tumor concentrations. These models, just as the preclinical hybrid models, required both a forcing function and a model to describe drug disposition in tumors. The most important assumption was that the tumor models used for the human predictions were assumed to be equivalent to those derived in the preclinical setting. Forcing functions that described the plasma concentrations for each drug were derived from published clinical pharmacokinetic data based on values for total clearance, the volume of distribution, and the rate constants associated with distribution and elimination. The forcing function for topotecan was derived from van Warmerdam et al. (20), who obtained pharmacokinetic data following topotecan schedules of 1.5 mg/m2 administered as a 30-minute constant rate infusion daily ⫻5. These parameters were consistent with those reported by others (21). The pharmacokinetic data for carboplatin was not as extensive as that for topotecan; however, a comprehensive study by Elferink et al. (22), which
3
http://www.saam.com.
Clinical Cancer Research 8051
used 30-minute intravenous infusions and measured ultrafiltrate carboplatin plasma concentrations in ovarian cancer patients, permitted a carboplatin forcing function to be derived. In this investigation the, AUCplasma was equal to a mean of 5.67 mg-min./mL, which is very compatible with numerous clinical trials that used AUC-based dosing schedules (23, 24). The forcing function for temozolomide was derived from a 1compartment first-order oral absorption model that was based on patients with brain tumors, either glioblastoma multiforme or anaplastic astrocytoma, who participated in phase I and II trials (25). Each complete hybrid pharmacokinetic model was then used in a population modeling program, PopKinetics (available from the SAAM Institute, Inc., Seattle, WA3), that enabled carboplatin, topotecan, and temozolomide tumor concentrationtime profiles to be simulated under different conditions. The simulation conditions were set to vary the SD or coefficient of variation of specific parameters associated with the tumor compartment and the residual error associated with the simulated plasma and tumor drug concentrations. In this manner, both intrasubject (i.e., residual error, within-subject) and intersubject (i.e., coefficient of variation of model parameters, withinpopulation or between-subject) errors were incorporated into each simulated data set. Intersubject variability in the forcing function was not explicitly expressed in the simulations because this variability was accounted for in the original pharmacokinetic model for each drug. This source of variability can be included in the simulations if desired, and its impact on predicted tumor drug concentrations can be determined. In any case, a goal to minimize interpatient variability in plasma concentrations should be sought because these measurements are readily observed in patients. The coefficient of variations were set at 25% for the blood-tumor exchange parameters (i.e., K34 and K43), and the residual error was set at 10% for tumor concentrations and 5% for plasma concentrations for all simulations. The simulated concentrations for each drug were then refit by the appropriate hybrid pharmacokinetic model to provide the best-fit parameter estimates and associated predicted plasma and tumor drug concentrations. This enabled us to determine the predicted model performance under each simulation condition. The resultant predicted drug concentration time profiles could then be analyzed to address different questions that pertained to the distribution of each drug in the tumor. The AUC values (n ⫽ 200) for carboplatin in plasma and tumor, as well as the tumor/plasma ratios were determined from the predicted concentrations. From the simulated topotecan lactone plasma and tumor concentration data sets (n ⫽ 200), the area under the topotecan concentration-time curve (AUC) was calculated and also expressed as tumor/plasma ratios. In addition, the fraction of the time topotecan tumor concentrations ⱖ10 ng/mL, set as a minimally effective cytotoxic concentration. Simulated temozolomide plasma and tumor compartment concentrations were obtained under two treatment conditions, control and in the presence of an angiogenesis inhibitor, TNP-470, analogous to the treatment conditions used for the preclinical investigations. For each condition, the AUC values in plasma and in the interstitial fluid compartment of the tumor were calculated.
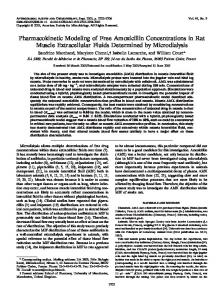
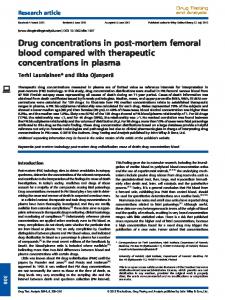
RESULTS Preclinical Pharmacokinetic Models. The hybrid pharmacokinetic models for carboplatin and topotecan were derived from measured plasma and tumor drug concentrations obtained after administration of combination regimens of carboplatin and topotecan. As most chemotherapeutic treatment plans involve drug combination regimens, the carboplatin-topotecan regimen is relevant to the treatment of ovarian cancer. In patients, the sequence of carboplatin-topotecan administration has resulted in different toxicity profiles with the so-called forward sequence of carboplatin on day 1 followed by topotecan on days 1 to 5 being more myelosuppressive than the backward sequence of topotecan on days 1 to 5 and carboplatin on day 5 (13, 14). Our current preclinical investigations were undertaken to determine whether there was a sequence-dependent pharmacokinetic interaction between carboplatin and topotecan that could provide insight as to the cause of the clinical observations and to direct additional pharmacodynamic studies. Because our data showed no evidence of a pharmacokinetic interaction between carboplatin and topotecan, we combined the drug concentration measurements from both the forward and backward sequence studies into single data sets for carboplatin and topotecan for the purposes of developing hybrid pharmacokinetic models. The best-fit hybrid pharmacokinetic model obtained for both carboplatin and topotecan consisted of a 2-compartment model to characterize systemic drug disposition and a 1compartment model for tumor drug concentrations (see Fig. 1). The associated model-predicted and observed drug concentrations are illustrated in Figs. 2 and 3 for carboplatin and topotecan, respectively. Both models described the observed data well; however, the model for carboplatin was more robust (i.e., lower parameter SDs and coefficients of variations), which can be attributed to the less variable plasma and tumor drug concen-
Fig. 1 Hybrid pharmacokinetic model containing a 2-compartment plasma disposition model and 1-compartment tumor model. This model configuration was the best-fit model describing either the carboplatin or topotecan preclinical plasma and tumor concentration data. The forcing function, describing the plasma drug concentration-time profile, is directly generated from the 2-compartment structure and then is input into the tumor compartment. The notation used for the rate constants, K12 and K21, is consistent with the SAAM II conventions.
8052 Model-Predicted Anticancer Drug Concentrations
used this model to investigate drug interactions between angiogenesis inhibitors and cytotoxic agents (17, 18), and we have found, with respect to the combination of TNP-470 and temozolomide that TNP-470 reduced tumor concentrations of temzolomide under steady-state conditions. The current study used a nonsteady-state temozolomide schedule that facilitated the definition of a hybrid pharmacokinetic model. The availability of interstitial fluid temozolomide concentrations enabled the use of a 3-compartment model for the
Fig. 2 Model-predicted (—) and observed E carboplatin plasma (A) and tumor (B) concentrations in rats bearing intraperitoneal NuTu19 tumors, a preclinical model of ovarian cancer. The best-fit model is illustrated in Fig. 1, and resulted in the following parameter values (mean ⫾ SD) for carboplatin: K01 ⫽ 0.0394 ⫾ 0.0036, K12 ⫽ 0.0041 ⫾ 0.0013, K21 ⫽ 0.0174 ⫾ 0.0026, K34 ⫽ 0.0269 ⫾ 0.0035, K43 ⫽ 0.0107 ⫾ 0.0020, V1 ⫽ 36.2 ⫾ 3.9. The units for all rate constants (K values) are minutes⫺1 and milliliters for the volume of distribution of the central compartment (V1).
trations compared with topotecan. Because our primary goal, to show a methodology to predict human tumor drug concentrations, could be achieved with the current data sets, collection of additional topotecan data was not pursued. The hybrid pharmacokinetic model for temozolomide was based on plasma and tumor interstitial fluid temozolomide concentrations collected in a xenograft model of rats bearing subcutaneous gliomas that overexpressed VEGF (12). We have
Fig. 3 Model-predicted (—) and observed F topotecan plasma (A) and tumor (B) concentrations in rats bearing intraperitoneal NuTu19 tumors, a preclinical model of ovarian cancer. The best-fit model is illustrated in Fig. 1, and resulted in the following parameter values (mean ⫾ SD) for topotecan K01 ⫽ 0.0811 ⫾ 0.2278, K12 ⫽ 0.0825 ⫾ 0.1238, K21 ⫽ 0.3989 ⫾ 1.540, K34 ⫽ 0.0132 ⫾ 0.0096, K43 ⫽ 0.0424 ⫾ 0.0138, V1 ⫽ 108.6 ⫾ 262.6. The units for all rate constants (K values) are minutes⫺1, and milliliters for the volume of distribution of the central compartment (V1).
Clinical Cancer Research 8053
tumor, which consisted of vascular, interstitial fluid, and intracellular subcompartments (see Fig. 4). The numerous parameters associated with this model resulted in a model identifiability problem when all of the parameters were estimated by the model-fitting procedure. Therefore, to minimize parameter estimation problems, the hybrid pharmacokinetic model was obtained in sequential fashion by first fitting a 2-compartment model to the temozolomide plasma concentrations to define the forcing function. The resultant forcing function was then held constant in the hybrid model that was fit to the remaining interstitial fluid temozolomide drug concentrations. As a further means to reduce the parameter estimation problem and consistent with the nature of physiologic models, parameters that can be reasonably estimated by methods other than the model-fitting procedure should be set constant and thus removed from the model optimization procedure. Thus, only those parameters in which information was lacking were estimated through the model-fitting exercise. Accordingly, the physiologic volumes of the three tumor subcompartments and the tumor blood flow were based on literature values given the actual tumor mass (26, 27). The nature of the interactions between angiogenesis inhibitors and cytotoxic drugs has led us to believe that alterations in drug transport at the vascular-interstitial fluid barrier were responsible for the interactions, rather than alterations at the interstitial fluid-intracellular barrier. Therefore, it was assumed that the intercompartmental transfer rate constants from the interstitial fluid and intracellular compartments were equal in both the control and TNP-470 groups and were held constant to further avoid model identifiability issues. Given these conditions, only the transfer rate constants between the vascular and interstital fluid compartments were estimated by the hybrid model-fitting procedure. Figures 5 and 6 depict the observed and model-predicted temozolomide plasma and interstitial fluid concentrations for
Fig. 5 Model-predicted (—) and observed F temozolomide plasma (A) and tumor (B) concentrations under control treatment conditions in rats bearing subcutaneous gliomas that overexpress VEGF. See Table 1 for parameter values.
Fig. 4 Hybrid pharmacokinetic model containing a 2-compartment plasma disposition model and 3-compartment tumor model. This model configuration was the best-fit model describing temozolomide preclinical plasma and tumor concentration data in the absence (control) and presence (TNP-470) of an angiogenesis inhibitor. The model was obtained in a sequential manner; first defining the forcing function based on the plasma drug concentration-time profile and then fitting the parameters for the tumor compartment. See Table 1 for the parameter values.
the control and TNP-470 treatment conditions, respectively. The corresponding model parameters obtained by the sequential model development procedures are given in Table 1. These parameters indicate that total clearance of temozolomide is equivalent in each treatment group, and the most profound differences are in the transfer rate constants (i.e., K34 and K43) at the vascular-interstitial fluid barriers. These terms represent both diffusional and convective transport, with the lower values for the TNP-470 group being consistent with a reduction in microvessel density and membrane permeability. The relative
8054 Model-Predicted Anticancer Drug Concentrations
tumor model obtained from the preclinical studies, and thus, the intercompartmental transfer rate constants, K34 and K43, were initially equivalent in the rat and human hybrid models. The simulated data sets introduced error (25% coefficient of variation) into these parameters to account for intersubject variation and to provide a statistical framework to address therapeutic questions. Table 2 provides the mean parameter values for carboplatin and topotecan models obtained by fitting the hybrid model to the simulated data sets that considered 25% variability in the tumor compartment parameters, K34 and K43. The ability to generate many plasma and tumor drug concentrations from the hybrid models provides an opportunity to consider drug treatment questions. From the carboplatin tumor concentrations, the area under the concentration-time curve (AUCtumor) was calculated and represented as a distribution (Fig. 7). The mean (⫾SD) AUC values were AUCtumor ⫽ 2.34 ⫾ 0.90 mg/minute/mL, AUCplasma ⫽ 5.49 ⫾ 0.14 mg-min/ mL, which corresponded to a mean ratio of AUCtumor/ AUCplasma ⫽ 0.43 ⫾ 0.16, and were indicative of low drug uptake into the tumor. The simulations conducted with the topotecan hybrid model yielded a series of topotecan lactone plasma and tumor concentrations. These concentrations, just as for carboplatin, were used to determine AUC values and were as follows: AUCtumor ⫽ 9.29 ⫾ 3.62 g-minute/mL, AUCplasma ⫽ 2.69 ⫾ 0.08 g-minute/mL, and the AUCtumor/AUCplasma ⫽ 3.46 ⫾ 1.36. The relative uptake of topotecan into tumors is much higher than for carboplatin. In addition to the determination of AUC values, we considered the duration of time topotecan
Table 1
Hybrid model parameters for temozolomide in rats
Parameters ⫺1
Fig. 6 Model-predicted (—) and observed F temozolomide plasma (A) and tumor (B) concentrations under TNP-470 treatment conditions in rats bearing subcutaneous gliomas that overexpress VEGF. See Table 1 for parameter values.
K01 (minutes ) K12 (minutes⫺1) K21 (minutes⫺1) V1 (mL) K34 (minutes⫺1) K43 (minutes⫺1) K46 (minutes⫺1) Q (mL/minutes ) fu Vv (mL) Vif (mL) Vic (mL)
Control 0.0157 (7.6) * 0.086 (25.6) 0.0488 (43.7) 553.1 (7.5) 0.173 (13.9) 0.740 (15.0) 0.5 0.93 0.8 0.16 0.62 0.78
TNP-470 0.0183 (10.1) 0.0803 (22.6) 0.0737 (39.8) 479.7 (10.0) 0.0475 (8.22) 0.164 (10.5) 0.5 0.93 0.8 0.16 0.62 0.78
* Values in parenthesis indicate % coefficient of variation of parameter estimate obtained by weighted least-squares regression.
inequality in K34 and K43 would indicate changes in interstitial fluid pressure; however, until independent measurements of interstitial fluid pressure are available, specific assignment of diffusion and convective transport components cannot be made. Clinical Pharmacokinetic Models. The hybrid pharmacokinetic models used to predict human tumor drug concentrations consist of a forcing function, derived from literature data, and a tumor compartment analogous in structure to the preclinical model. The forcing functions are based solely on human pharmacokinetic data, whereas the parameters associated with the tumor compartment may be derived from both animal and human data. The tumor compartments for carboplatin and topotecan were assumed to be analogous to the 1-compartment
Table 2
Model parameters for human hybrid pharmacokinetic models for carboplatin and topotecan
Parameters ⫺1
K01 (minutes ) K12 (minutes⫺1) K21 (minutes⫺1) K34 (minutes⫺1) K43 (minutes⫺1) V1 (L)
Carboplatin
Topotecan
0.015 (7.9) * 0.011 (39.8) 0.018 (78.2) 0.027 (26.4) 0.011 (26.6) 9.59 (7.2)
0.022 (7.9) 0.010 (6.6) 0.025 (12) 0.013 (27) 0.043 (29) 42.0 (9.6)
* Values represent mean (% coefficient of variation) of modelfitted estimates from simulated error datasets (N ⫽ 200) for each drug.
Clinical Cancer Research 8055
Fig. 7 Distribution of predicted human tumor carboplatin AUC values determined from the hybrid pharmacokinetic model, N ⫽ 200.
tumor concentrations were equal to or greater than a designated value. From a survey of the National Cancer Institute panel of tumor cells (28), inhibitory concentrations, expressed as GI50 values, ranged from about 9 ng/mL to 114 ng/mL depending on the cell line. By setting the desired tumor concentration to 10 ng/mL, the simulated topotecan tumor concentration data sets could be analyzed to determine the fraction of time during a 12 hour period (approximately equal to the time concentrations could be measured after a single dose) that concentrations were ⱖ10 ng/mL (Fig. 8). It can be seen that about 50% of cases produced topotecan tumor concentrations about the designated values of 10 ng/mL for 50% of the time after a single dose. This type of analysis could provide an important criteria to design drug-dosing regimens once a desired or target tumor concentration is substantiated. The hybrid pharmacokinetic model used to predict human temozolomide tumor concentrations illustrates a number of interesting features in the formulation of the model. The threesubcompartment structure for the tumor, predicated after the measurement of interstitial fluid concentrations in the preclinical model, enabled compartment-specific drug concentrations to be predicted, concentrations that may more readily be related to biological or pharmacodynamic endpoints. The 3-compartment structure also introduces tumor blood flow and physiologic volumes into the model, and because these are derived from human data, the reliance on animal-based parameters is decreased. The temozolomide preclinical investigation was conducted to asses whether angiogenesis inhibitors, in this case TNP-470, altered tumor drug concentrations by comparing temozolomide concentrations under control and TNP-470 treatment conditions. It was found that the ratio of temozolomide AUCif/AUCplasma was reduced by 29% (P ⬍ 0.05) in the TNP-470 group compared with the control. The model param-
eters that reflect this difference are K34 and K43 and represent both diffusional and convective transport. Delineation of the contribution of convective transport, and therefore diffusion, will require separate measurements of interstitial fluid pressure in the absence and presence of TNP-470. Passive diffusion of temozolomide should be equivalent in and out of the interstitial fluid compartment and based on reductions in tumor microvessel density (17) should be less in the TNP-470 –treated group compared with the control group. The inequity in K34 and K43 can be attributed to net convective transport into the interstitial fluid space. Hybrid model-predicted human temozolomide tumor concentrations were obtained under control and TNP-470 treatment conditions that are illustrated (Fig. 9) as the distribution of AUC if values for control and TNP-470 regimens. The mean (⫾ SD) ratio of the unbound AUCif/AUCplasma equaled 1.12 (0.62) and 0.92 (0.48) for control and TNP-470 groups, respectively, which indicated a significant (P ⬍ 0.05) reduction in the ratio attributable to TNP-470. This finding was consistent with our findings in the preclinical rat model based on a much smaller number of subjects, and supported the ability of TNP-470 to reduce microvessel density and membrane permeability. By comparing the preclinical (Fig. 4) and clinical (Fig. 10) hybrid pharmacokinetic models for temozolomide, the human-based parameters can readily be depicted, which left the vascular: interstitial fluid (i.e., K34 and K43) and interstitial fluid:intracellular (i.e., K46) transport parameters to be equivalent in the rat and human models.
DISCUSSION Determination of drug concentrations in tumors is neither done routinely nor in a systematic manner, which is unfortunate
Fig. 8 Histogram indicating the number of data sets (total N ⫽ 200) in which model-predicted topotecan tumor concentrations were ⱖ10 ng/ mL, expressed as a fraction of time over a dosing interval of 12 hours.
8056 Model-Predicted Anticancer Drug Concentrations
The transition from preclinical to clinical drug development most often resides in setting initial phase I drug doses upon toxicity data in animals. Dose and schedule selection grind forward until a maximum-tolerated dose is determined, which can then provide a basis to design phase II trials. In an era of new drug discovery and high-throughput screening tools that attempt to identify targeted and less toxic agents, standard toxicity criteria will unlikely indicate the most efficacious doses and schedules. A greater reliance on pharmacokinetic properties in the tumor, and preferably, tumor-based pharmacokineticpharmacodynamic relationships should provide a rational means to select the most efficacious drug dosing regimens. Interspecies scaling principles, embodied by allometric relationships, have been used to bridge preclinical and clinical pharmacokinetic information by prediction of drug clearance and the volume of distribution (30, 31). Although such quantitative approaches are viewed as a positive step, there have been no provisions to use tumor drug concentrations. The ultimate goal of the current investigation was to delineate a pharmacokinetic modeling technique that addresses some of the perceived deficiencies in standard drug development approaches by focusing on drug disposition in tumors. The hybrid pharmacokinetic modeling approach was chosen to characterize drug disposition in tumors and then scaled to predict human tumor drug concentrations. The forcing function used in hybrid models supplants the global physiologically based approach of representing a blood
Fig. 9 Distribution of predicted human temozolomide tumor AUCif values under control (A) and TNP-470 (B) treatment conditions, N ⫽ 100 for each condition. It can be seen that the AUCif values obtained following a therapeutic regimen of TNP-470 are shifted to smaller values compared with the control treatment.
because the tumors contain the target cells and molecules. This potential lack of information on drug disposition in tumors limits an understanding not only of drug transport but also of pertinent pharmacokinetic-pharmacodynamic relationships that could aid the drug development process. Opportunities to gather data on drug disposition in tumors are missed in lieu of performing drug efficacy studies in multiple tumor models. Even academic-minded organizations have adopted this standard drug development mindset of performing an abundance of preclinical efficacy studies to select anticancer drug combinations and regimens (29). It would seem that greater attention to understanding and characterizing drug disposition in tumors is warranted and could alleviate a substantial reliance on antitumor efficacy studies.
Fig. 10 Human hybrid pharmacokinetic model for temozolomide that was applied to simulate concentrations for both control and TNP-470 treatments. The human-based parameters are indicated in boldface (i.e., A, K, Ka, Q, fu, Vv, Vif, Vic), whereas those assumed to be equivalent to the preclinical values are in regular font. Parameters that were common to both the control and TNP-470 models were tumor blood flow, Q ⫽ 30 mL/minute; fraction unbound in plasma, fu ⫽ 0.86; volume of the vascular compartment, Vv ⫽ 5 mL; volume of the interstitial fluid compartment, Vif ⫽ 20 mL; volume of the intracellular compartment, Vic ⫽ 25 mL; absorption rate constant, Ka ⫽ 0.0443 minute⫺1; and elimination rate constant, K ⫽ 0.0063 minute⫺1, K46 ⫽ 0.5 minute⫺1. Mean (SD) fitted parameters that differed between control and TNP-470 treatments were the following for control: A ⫽ 1.46 (0.0024) ug/mL, K34 ⫽ 0.0168 (0.042) minute⫺1, and K43 ⫽ 0.0638 (0.0147) minute⫺1. Mean (SD) fitted parameters that differed between control and TNP-470 treatments were the following and for the TNP-470 model: A ⫽ 1.42 (0.0054) g/mL, K34 ⫽ 0.0470 (0.0098) minute⫺1, and K43 ⫽ 0.0156 (0.0443) minute⫺1.
Clinical Cancer Research 8057
or plasma compartment with a combined venous return from the tissues, explicitly dependent on the anatomic representation of the whole animal, and an output arterial drug concentration. The hybrid model preserves the physiologic representation of the target tissue but greatly simplifies the modeling resources by use of the forcing function. Moreover, it is the forcing function that permits a relatively straight-forward means to derive human hybrid pharmacokinetic models from a combination of preclinical (tumor disposition) and clinical (forcing function) data. The three drugs, carboplatin, topotecan, and temozolomide used to show the hybrid modeling approach are commonly used to treat various types of cancer. The combination of carboplatin and topotecan is used in ovarian cancer and was being studied in our preclinical model to determine whether sequence-dependent changes in myelosuppression observed in patients could be attributed to pharmacokinetic interactions. On the basis of plasma and tumor drug measurements collected after both sequences of carboplatin and topotecan administrations, we found no differences in the pharmacokinetics of either carboplatin and topotecan. Application of the hybrid modeling approach to carboplatin and to topotecan resulted in a 1-compartment tumor model, the simplest tumor model structure that lumps the vascular, interstitial fluid, and intracellular compartments into a single compartment. This lumped single compartment has two parameters (K34 and K43) that determine drug distribution in and out of the tumor. In contrast, the hybrid model for temozolomide used a 3-compartment tumor model that depicted vascular, interstitial fluid, and intracellular subcompartments. This structure introduces tumor blood flow and physiologic volumes into the model that provides not only a means to assess how these parameters impact on drug disposition but that also can be based on human data when the hybrid model is applied to humans. Overall, the three preclinical hybrid models agreed with the observed data and provided a means to show the technique in humans. The largest concern with the current hybrid modeling approach is the assumption that drug dynamics in the tumor are equivalent in animals and in humans. Until measurements of tumor concentrations in patients are available, this assumption cannot be verified. This assumption in the current formulation of the hybrid models resides in the rate constants (i.e., Kxy, time⫺1) associated with the tumor compartment (see Figs. 1 and 10). The availability of human tumor drug concentration measurements may indicate a means to scale such parameters as a function of time. Nonetheless, the framework for development of human hybrid pharmacokinetic models has been delineated, which in addition, does permit a priori predictions to be made. Further, integration of the Monte Carlo simulations into the hybrid model offers a statistical basis to address therapeutic questions that rely on pharmacokinetic inferences. The human hybrid models were used to illustrate how questions concerning drug distribution in tumors could be addressed. Using a Monte Carlo simulation approach, we generated and further analyzed distinct tumor drug concentration profiles based on a desired question or end point. For each drug, the distribution of AUCtumor values and the AUCtumor/AUCplasma ratios were determined, which provided an assessment of drug exposure in tumors. When such endpoints are connected to specific experimental conditions, such as in the case of TNP-470
therapy and temozolomide, an understanding of how factors impact on tumor drug distribution can be determined. Because carboplatin is dosed based on a target AUC in plasma, it may be found that a target AUC in tumor is most relevant to therapy, particularly if a biological or pharmacodynamic end point in tumor could be incorporated into the analysis. The predicted topotecan tumor concentrations were used to illustrate how another drug exposure criteria could be assessed. By setting a minimum effective drug concentration in tumors, in this case 10 ng/mL, we determined the fraction of time after a single dose that effective tumor concentrations were maintained. Although the relevance of in vitro cytotoxicity data to in vivo therapy warrants further consideration, particularly because the in vitro drug exposure times are long (typically 96 hours), the ability to predict in vivo cytotoxic drug concentrations provides an alternate means to select the most desirable drug dosing schedules, and this ability could limit the use of less quantitative approaches. The use of unbound interstitial fluid drug concentrations in the hybrid model for temozolomide illustrates a potentially important feature of relating pharmacokinetic models to pharmacodynamic end points because for many drugs, free drug concentrations are considered pharmacologically active. Given the emergence of targeted therapy, hybrid pharmacokineticpharmacodynamic models may find great applicability. In summary a new modeling technique has been developed that can help bridge the gap between preclinical and clinical drug development. The unique features of the approach are the ability to quantitate drug disposition in tumors in a physiologic manner and to readily scale preclinical hybrid models to humans through the use of a forcing function. Furthermore, because drug concentrations in human tumors are not routinely available, a Monte Carlo simulation approach was incorporated into the technique to account for intrasubject and intersubject variability. In this manner, statistical assessments can be made on what factors impact on tumor drug concentrations and which drug dosing regimens may yield optimal therapeutic responses.
REFERENCES 1. Modit NB. Pharmacokinetics and metabolism in drug discovery and preclinical development. In: Schoenwald RD, editor. Pharmacokinetics in drug discovery and development. Boca Raton: CRC Press, 2002. p. 57–71. 2. White RE, Manitpisitkul P. Pharmacokinetic theory of cassette dosing in drug discovery screening. Drug Metab Dispos 2001;29:957– 66. 3. Graham MA, Kaye SB. New approaches in preclinical and clinical pharmacokinetics. In: Workman P, Graham MA, editors. Pharmacokinetics and cancer chemotherapy, vol. 17. Plainview, NY: Cold Spring Harbor Press, 1993. p. 27– 49. 4. Gallo JM, Etse JT, Doshi KJ, Boudninot FD, Chu CK. Hybrid pharmacokinetic model to describe anti-HIV nucleoside brain disposition following parent and prodrug administration in mice. Pharm Res 1991;8:247–53. 5. Wada DR, Ward DS. The hybrid model: a new pharmacokinetic model for computer-controlled infusion pumps. IEEE Trans Biomed Eng 1994;41:134 – 42. 6. Foster DM, Aamodt RL, Henkin RI, Berman M. Zinc metabolism in humans: a kinetic model. Am J Physiol 1979;237:R340 – 49. 7. Bertoldo A, Vicini P, Sambuceti G, Lammertsma AA, Parodi O, Cobelli C. Evaluation of compartmental and spectral analysis models of [18F]FDG kinetics for heart and brain studies with PET. IEEE Trans Biomed Eng 1998;45:1429 – 48.
8058 Model-Predicted Anticancer Drug Concentrations
8. Gallo JM. Pharmacokinetics: Model Structure and Transport Systems. In: Amidon GL, Lee PI, and Topp EM, editors. Transport processes in pharmaceutical systems, vol. 102. New York, NY: Marcel Dekker; 2000. p. 55– 86. 9. Rowland M, Balant L, Peck C. Physiologically based pharmacokinetics in drug development and regulatory science: a workshop report (Georgetown University, Washington DC, May 29 –30, 2002). AAPS PharmSci. 2004;6:E6. 10. Theil FP, Guentert TW, Haddad S, Poulin P. Utility of physiologically based pharmacokinetic models to drug development and rational drug discovery candidate selection. Toxicol Lett 2003;138:29 – 49. 11. Rose GS, Tocco LM, Granger GA, et al. Development and characterization of a clinically useful animal model of epithelial ovarian cancer in the Fischer 344 rat. Am J Obstet Gynecol 1996;175:593–9. 12. Ma J, Zhou-Li F, Klein-Szanto A, Gallo JM. Modulation of angiogenesis by human glioma xenograft models that differentially express vascular endothelial growth factor. Clin Exp Metastasis 1998;16: 559 – 68. 13. Athale UH, Stewart C, Kuttesch JF, et al. Phase I study of combination topotecan and carboplatin in pediatric solid tumors. J Clin Oncol 2002;20:88 –95. 14. Simpson A, Twelves C, Boddy A, et al. Schedule dependency of carboplatin and topotecan: phase I and pharmacokinetic studies. Proc Am Soc Clin Oncol 1998;17:785. 15. Guo P, Li S, Gallo JM. Determination of carboplatin in plasma and tissues by HPLC-MS. J Chromatogr B Analyt Technol Biomed Life Sci 2003;783:43–52. 16. Rosing H, Doyle E, Davies BE, Beijnen JH. High-performance liquid chromatographic determination of the novel antitumour drug topotecan and topotecan as the total of the lactone plus carboxylate forms, in human plasma. J Chromatogr 1995;668:107–15. 17. Ma J, Pulfer S, Li S, Chu J, Reed K, Gallo JM. Pharmacodynamicmediated reduction of temozolomide tumor concentrations by the angiogenesis inhibitor TNP-470. Cancer Res 2001;61:5491– 8. 18. Ma J, Li S, Reed K, Guo P, Gallo JM. Pharmacodynamic-mediated effects of the angiogenesis inhibitor SU5416 on the tumor disposition of temozolomide (TMZ) in subcutaneous and intracerebral human glioma xenograft models. J Pharmacol Exp Ther 2003;305:833–9.
19. Barrett PH, Bell BM, Cobelli C, et al. SAAM II: simulation, analysis, and modeling software for tracer and pharmacokinetic studies. Metabolism 1998;47:484 –92. 20. van Warmerdam LJ, Verweij J, Schellens JH, et al. Pharmacokinetics and pharmacodynamics of topotecan administered daily for 5 days every 3 weeks. Cancer Chemother Pharmacol 1995;35:237– 45. 21. Garcia-Carbonero R, Supko JG. Current perspectives on the clinical experience, pharmacology, and continued development of the camptothecins. Clin Cancer Res 2002;8:641– 61. 22. Elferink F, van der Vijgh WJ, Klein I, Vermorken JB, Gall HE, Pinedo HM. Pharmacokinetics of carboplatin after i.v. administration. Cancer Treat Rep 1987;71:1231–7. 23. Calvert AH, Newell DR, Gumbrell LA, et al. Carboplatin dosage: prospective evaluation of a simple formula based on renal function. J Clin Oncol 1989;7:1748 –56. 24. Ando M, Minami H, Ando Y, et al. Multi-institutional validation study of carboplatin dosing formula using adjusted serum creatinine level. Clin Cancer Res 2000;6:4733– 8. 25. Jen JF, Cutler DL, Pai SM, et al. Population pharmacokinetics of temozolomide in cancer patients. Pharm Res 2000;17:1284 –9. 26. Bischoff KB, Brown RG. Drug distribution in mammals. Chem Eng Prog Symp 1966;62:33– 45. 27. Fross RD, Warnke PC, Groothuis D. Blood flow and blood-to-tissue transport in 9L gliosarcomas: the role of the brain tumor model in drug delivery research. J Neurooncol 1991;11:185–97. 28. Weinstein JN, Myers TG, O’Connor PM, et al. An informationintensive approach to the molecular pharmacology of cancer. Science (Wash D C) 1997;275:343–9. 29. Houghton PJ, Adamson PC, Blaney S, et al. Testing of new agents in childhood cancer preclinical models: meeting summary. Clin Cancer Res 2002;8:3646 –57. 30. Lin JH. Applications and limitations of interspecies scaling and in vitro extrapolation in pharmacokinetics. Drug Metab Dispos 1998;26: 1202–12. 31. Sukbuntherng J, Cropp G, Hannah A, Wagner GS, Shawver LK, Antonian L. Pharmacokinetics and interspecies scaling of a novel VEGF receptor inhibitor, SU5416. J Pharm Pharmacol 2001;53:1629 –36.