Espinosa-Soto et al. BMC Evolutionary Biology 2011, 11:5 http://www.biomedcentral.com/1471-2148/11/5
RESEARCH ARTICLE
Open Access
Phenotypic plasticity can facilitate adaptive evolution in gene regulatory circuits Carlos Espinosa-Soto1,2*, Olivier C Martin3, Andreas Wagner1,2,4
Abstract Background: Many important evolutionary adaptations originate in the modification of gene regulatory circuits to produce new gene activity phenotypes. How do evolving populations sift through an astronomical number of circuits to find circuits with new adaptive phenotypes? The answer may often involve phenotypic plasticity. Phenotypic plasticity allows a genotype to produce different - alternative - phenotypes after non-genetic perturbations that include gene expression noise, environmental change, or epigenetic modification. Results: We here analyze a well-studied model of gene regulatory circuits. A circuit’s genotype encodes the regulatory interactions among circuit genes, and its phenotype corresponds to a stable gene activity pattern the circuit forms. For this model, we study how genotypes are arranged in genotype space, where the distance between two genotypes reflects the number of regulatory mutations that set those genotypes apart. Specifically, we address whether this arrangement favors adaptive evolution mediated by plasticity. We find that plasticity facilitates the origin of genotypes that produce a new phenotype in response to non-genetic perturbations. We also find that selection can then stabilize the new phenotype genetically, allowing it to become a circuit’s dominant gene expression phenotype. These are generic properties of the circuits we study here. Conclusions: Taken together, our observations suggest that phenotypic plasticity frequently facilitates the evolution of novel beneficial gene activity patterns in gene regulatory circuits.
Background Novel adaptive phenotypes endow organisms with new means to survive and reproduce. Such new phenotypes arise through a process that involves natural selection and random genotypic change caused by mutation. Life’s ability to adapt through random change is remarkable, as many man-made systems do not have this ability [1,2]. It is a result of how genotypic change translates into phenotypic change [1,3]. Different classes of biological systems, ranging from protein and RNA molecules [4-6] to regulatory circuits [7] and genome-scale metabolic networks [8], share some similarities in how they translate genotypic change into phenotypic change. First, any genotype G produces some phenotype P in the absence of environmental and other perturbations. We will refer to such a ‘default’ phenotype as G’s native phenotype (analogous to the * Correspondence:
[email protected] 1 University of Zurich, Dept. of Biochemistry, Bldg. Y27 Winterthurerstrasse 190 CH-8057 Zurich, Switzerland Full list of author information is available at the end of the article
native conformation of a protein). Second, in all these systems genotypes exist in vast genotype spaces. In a genotype space, the distance between two genotypes indicates the number of mutations that set those genotypes apart. Third, the set of genotypes with the same native phenotype define a “genotype network”. For any two genotypes on a genotype network, there exists a sequence of small genetic changes that leads from one genotype to the other, without ever changing the native phenotype. Genotype networks are typically vast and extend far through genotype space. A population that evolves on a genotype network through mutation and selection can traverse large regions of genotype space, while the population’s bulk preserves the same phenotype. While doing so, members of the population can explore different phenotypes that occur in different regions of genotype space. Because genotype networks extend far through this space, they facilitate exploration of many novel phenotypes [5,8-12]. In sum, genotype networks allow access to a wide range of new, potentially adaptive phenotypes [13,14].
© 2011 Espinosa-Soto et al; licensee BioMed Central Ltd. This is an Open Access article distributed under the terms of the Creative Commons Attribution License (http://creativecommons.org/licenses/by/2.0), which permits unrestricted use, distribution, and reproduction in any medium, provided the original work is properly cited.
Espinosa-Soto et al. BMC Evolutionary Biology 2011, 11:5 http://www.biomedcentral.com/1471-2148/11/5
Despite the existence of genotype networks, finding a specific novel phenotype through a blind evolutionary search is challenging, partly because genotype spaces are very large, partly because the fraction of advantageous novel phenotypes encountered during this search is usually small. For example, many more mutations are deleterious rather than advantageous [15,16]. Here we explore a phenomenon that can facilitate this search, that of phenotypic plasticity. Phenotypic plasticity allows a genotype to produce more than one distinct phenotype [17-19]. Such alternative phenotypes are induced by non-genetic perturbations. Non-genetic perturbations influence the formation of all kinds of phenotypes, but molecular phenotypes illustrate this influence especially well. Consider protein structure phenotypes. Driven by thermal noise - a ubiquitous kind of non-genetic perturbation - the same amino acid sequence (genotype) typically folds into one main, native structure (phenotype), as well as a large spectrum of alternative structures. Several aspects of the protein’s environment can influence which of these structures it forms. They include temperature, pH, but also other proteins, such as chaperones [20] or infective proteinaceous agents (prions) [21]. The same holds for RNA molecules, where a single genotype (nucleotide sequence) can also fold into different structures [6,22,23]. On higher levels of organization, genes and their products interact in regulatory circuits. The genotype determines which of a circuit’s genes interact; the gene activity or gene expression phenotypes resulting from these interactions are, again, influenced by nongenetic factors. For instance, a circuit’s native gene expression phenotype can be altered through stochastic change - intracellular noise - in the number of regulatory molecules inside a cell [24-26]. Biotic or abiotic environmental factors can also change a gene regulatory circuit’s activity pattern and the macroscopic traits it helps build [17,19,27-29]. The genotype network concept can readily accommodate the phenomenon of phenotypic plasticity [22]. Genotypes that produce a given phenotype as their native phenotype belong to the same genotype network, but each of these genotypes may also produce a spectrum of alternative phenotypes. This spectrum may differ among genotypes on the same genotype network, and not all of these genotypes may have equal plasticity. For example, one genotype may readily produce an alternative phenotype, whereas in another genotype, the same phenotype may arise only rarely, for example through an extreme and rare perturbation. In these two genotypes, the phenotype would then have high and low penetrance, respectively. A growing body of work suggests that phenotypic plasticity strongly influences the origin of novel phenotypes
Page 2 of 14
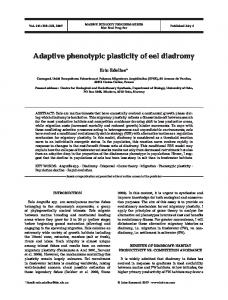
[17-19,30-44]. The earliest support comes from classic work by Waddington [45,46], Schmalhausen [47] and Baldwin [48]. Waddington showed that artificial selection of a phenotype that initially appears only in a few organisms after non-genetic perturbations, can easily result in the trait’s genetic determination [46,49]. More recently, other researchers have made the same observation for diverse traits and different species [37,38,42]. Artificial selection can thus turn an alternative into a native phenotype. In addition, many observations in wild populations suggest that in multiple cases an ancestral alternative phenotype may have facilitated the evolution of new, genetically fixed adaptive traits [17-19,30-36,40]. The phenotypes where plasticity may have facilitated adaptation are very diverse. They include gill surface area in cichlid fishes [33], pigmentation patterns in the crustacean Daphnia melanica [34], and head size in the snake Notechis scutatus [35], to name but a few. Despite an abundance of candidate examples, plasticity’s importance for adaptive evolution is not universally accepted [50,51]. We still do not know whether existing observations from artificial selection experiments or from wild populations are rare oddities or hint at general principles of evolution [39,43,44,52,53]. If important for adaptive evolution, plasticity would facilitate adaptation through a scenario such as the following (Figure 1): Consider a population in ‘search’ of some new superior phenotype Pnew. At some point, genotypes arise that have Pnew as a low-penetrance member of their spectrum of alternative phenotypes. Such genotypes would accumulate through selection, as they occasionally produce Pnew. Second, some mutations in these genotypes produce genotypes where P new has higher
Figure 1 A plasticity-mediated evolutionary path towards a new adaptive phenotype. Each circle represents a genotype. Lines represent mutations that convert one genotype into another. Different colors represent distinct phenotypes. The same background color surrounds genotypes in the same genotype network. Colored areas within circles represent the probability that a genotype produces a particular phenotype. Blue represents an original native phenotype, and red a new beneficial phenotype. We show a sequence of mutations towards the red genotype network. First, the red phenotype arises as a low penetrance alternative phenotype (mutation a). As penetrance increases, the distance to the new genotype network decreases (b). Finally, the new phenotype has become stabilized, that is, a new genotype network has been ‘discovered’ (c).
Espinosa-Soto et al. BMC Evolutionary Biology 2011, 11:5 http://www.biomedcentral.com/1471-2148/11/5
penetrance. These mutant genotypes now accumulate in the population. Finally, the population gains mutational access to Pnew’s genotype network. In this genotype network Pnew is produced as the native phenotype - without any non-genetic perturbations. Here, Pnew has become genetically stabilized. In the above scenario, genotypes that produce a phenotype P new through plasticity have better chances to find P new ’s genotype network. This scenario requires several properties of the organization of genotype space. The conditions are: i) Finding genotypes that can produce a new alternative phenotype Pnew through plasticity must be significantly easier than finding the genotype network of Pnew (i.e. genotypes where Pnew is native). ii) Genotypes near the genotype network of P new should have a tendency to produce Pnew as an alternative phenotype. Otherwise, reaching Pnew’s genotype network would not be easier from genotypes that produce Pnew through plasticity. iii) Mutations of genotypes that produce P new through plasticity must often result in genotypes that can also produce Pnew through plasticity. Otherwise, an evolutionary search of Pnew’s genotype network might not be able to progress through genotypes that can all produce Pnew. iv) The higher the penetrance of Pnew is in a given genotype G, the easier it must be to reach P new ’s genotype network from G. Conditions i)-iii) imply that there must be sets of mutationally connected genotypes that produce Pnew as an alternative phenotype. From some of those genotypes, a single mutation must suffice to reach P new ’s genotype network. Condition iv) implies that selection can promote genetic stabilization of Pnew through gradual increases in Pnew’s penetrance. We here explore whether these conditions are fulfilled in a model of transcriptional regulation circuits. Such circuits produce specific gene activity patterns in different parts and developmental stages of an organism. In doing so, they have a major role in directing developmental processes [54,55]. Many evolutionary novelties involve changes in the gene expression patterns such circuits produce [56-59]. In the circuits we study, the genotype encodes the transcriptional regulatory interactions determined by a circuit’s cis-regulatory regions. A phenotype corresponds to a circuit’s stable gene activity pattern. We show that the requirements we mentioned above are fulfilled for these circuits. Our work suggests that phenotypic plasticity can facilitate adaptive evolution that involves changes in gene activity patterns of regulatory circuitry.
Page 3 of 14
Results The model
Our model represents gene regulatory circuits comprising N genes. The activity of each gene in a circuit is regulated by the activity of other circuit genes. An N by N real-valued matrix A = (aij) specifies the manner in which this regulation occurs. We view this matrix as a circuit’s regulatory genotype. A gene j regulates the activity of another gene i when a ij ≠ 0. The effect of gene j on gene i can be either activating (a ij > 0) or repressing (aij < 0). We call two circuits neighbors (in a regulatory genotype space) if they differ in a single regulatory interaction. We use the integer variable m to denote a circuit’s number of regulatory interactions, i.e. the number of non-zero values in A; we use the real number c to denote a circuit’s interaction density, that is, its number of interactions m divided by the maximally possible number of interactions N2. We describe the activity state of the circuit at time t with a vector s t = ( s (t1) ,..., s (t N ) ) . In our model, cross-regulatory interactions among circuit genes and the circuit’s activity state at time t determine the circuit’s activity state after a time-step of length τ as follows: ⎡ s (t i+) = ⎢ ⎢ ⎣
N
∑ j =1
⎤ a ij s (t j) ⎥ ⎥ ⎦
(1)
where s(x) equals -1 when x < 0, it equals +1 when x > 0, and it equals 0 when x = 0. Despite this model’s simplicity, it has been successfully used to study various aspects of the evolution of gene regulatory circuits, such as the evolution of robustness, of modularity, and of pattern formation [7,11,60-66]. Variants of the model have also proven useful to model developmental processes in plants and animals [67,68]. We here consider circuits that attain a stable gene activity pattern s∞ when their dynamics start from an initial gene activity pattern s0 . Such an initial state is determined by factors outside the circuit, be they genes ‘upstream’ of the circuit, maternal regulators, signals from neighboring cells or environmental factors. We refer to a stable gene activity pattern s∞ as a gene activity phenotype. As in previous research [7], we do not analyze circuits that fail to produce a stable activity pattern. Circuit genotypes with the same gene activity phenotype form vast genotype networks in a space of regulatory circuits [7]. Throughout this paper, we consider circuits in a given genotype network, that is, they attain a given gene activity phenotype s ∞native from a given initial gene activity state s 0 through the circuit’s dynamics. We refer to this genotype network as the
Espinosa-Soto et al. BMC Evolutionary Biology 2011, 11:5 http://www.biomedcentral.com/1471-2148/11/5
‘native genotype network’ and to s ∞native as the ‘native phenotype’. The activity state s0 is the gene activity state from which the system starts its dynamics in the absence of non-genetic perturbations. We note that all properties of genotype network organization relevant to us depend on the fraction d of gene activity differences between s0 and s ∞native , and not on the identity of these activity patterns [7]. We study two kinds of perturbations. The first is a mutation of a circuit’s regulatory genotype. A mutation changes an interaction by altering a value of aij in a circuit’s matrix A. Some mutations can cause a circuit to produce a phenotype different from s ∞native . The second kind of perturbation has a non-genetic origin and affects the initial gene activity pattern s0. Such a perturbation could result, for example, from intracellular noise, from environmental fluctuations, or from disturbances in the activity of genes upstream of the circuit. For example, intracellular noise can create gene expression heterogeneity in clonal populations [24-26], just as exposure to some environmental factors can induce major gene expression changes in different organismal lineages [27-29], and impairing the activity of pair-rule genes upstream of the segment-polarity gene circuit in fruit flies can change the expression pattern of genes in this circuit [69,70]. Such perturbations can alter developmental trajectories, and result in new gene activity phenotypes different from s ∞native . We call the phenotypes that a circuit genotype G produces after non-genetic perturbations and that are different from G’s native phenotype ‘alternative phenotypes’. Some alternative phenotypes may be detrimental, but others may be beneficial [40,71,72]. An alternative phenotype has a low (high) penetrance if the likelihood that G produces it after a random perturbation in the initial condition is low (high).
Page 4 of 14
and appended these alternative phenotypes to a growing list of such phenotypes. The second observable was the cumulative number of new phenotypes that the circuits explored exclusively through mutation. Every time a mutation caused a change in a circuit’s native phenotype, we recorded the new phenotype, before replacing the circuit by its parent in the original native genotype network. We appended these new phenotypes to a growing list of phenotypes that had not been encountered through previous mutations. In this analysis, we found that plasticity allows a faster exploration of new phenotypes than mutation alone. Figure 2 shows that after each circuit in the ensemble had experienced 500 mutations, plasticity had explored more than twice as many phenotypes as mutation. This figure averages results for 200 independent ensembles of circuits with N = 16 genes, interaction density c ≈ 0.35, and a fraction d of gene activity differences between s0 and s ∞native equal to 0.125. Circuits with different values of these parameters also have faster access to new phenotypes through plasticity than through mutation alone (Additional file 1: Figure S1). Mutations and non-genetic perturbations produce similar sets of phenotypes
If phenotypic plasticity facilitates the discovery of new genotype networks, then mutations and non-genetic change should often produce similar or identical new phenotypes (condition ii) in the introduction). Otherwise, genotypes that produce an alternative phenotype after non-genetic perturbations would not have preferential mutational access to that phenotype’s genotype network. In other words, if condition ii) did not hold,
Finding new alternative phenotypes is easier than finding new native phenotypes
We first asked whether mutation-driven exploration of a genotype network can find new alternative phenotypes more easily than new genotype networks (native phenotypes), as required by condition i) in the introduction. To answer this question, we allowed an ensemble of 5 × 10³ circuits to drift randomly on a genotype network by changing one regulatory interaction at a time, while preserving the circuits’ native phenotype. During this process, we recorded two observables. The first was the cumulative number of new phenotypes that circuits could produce after each possible single gene-activity modifications of s0 (i.e. non-genetic perturbations). That is, after each mutation, we determined those alternative phenotypes that a mutated genotype could produce but that previous genotypes had not been able to produce,
Figure 2 Gene circuits exploring a genotype network find genotypes with novel alternative phenotypes faster than new genotype networks. The figure shows mean values for 200 independent ensembles of circuits. Ensemble size M = 5 × 10³ circuits with N = 16 genes, interaction density c ≈ 0.35, and a fraction native equal to 0.125. d of gene activity differences between s0 and s ∞
Espinosa-Soto et al. BMC Evolutionary Biology 2011, 11:5 http://www.biomedcentral.com/1471-2148/11/5
Page 5 of 14
mutations would not be able to turn an alternative phenotype into a native phenotype that is produced even in the absence of non-genetic perturbations. To find out whether this is the case, we sampled random genotypes from a given genotype network. All the genotypes on this network produce the same phenotype s ∞native from s0. We defined the following sets for each genotype G in the sample: Pμ is the set of new phenotypes that mutations in G can create; Ps 0 is the set of alternative phenotypes that perturbation of each gene in the initial condition s 0 can create. To quantify the similarity between both sets, we defined the index C as the size of the intersection between both sets divided by its maximally possible value for sets of the same size |P ∩ Ps |
(C = min(|P |,|P0 |) ) . C ranges from zero, if mutation s0 and non-genetic perturbations produce always different phenotypes, to one, if Pμ and Ps 0 fully overlap. We also defined an index C rand , which estimates how similar randomly chosen sets of phenotypes would be (see Methods). By assessing C, we found that mutations and non-genetic perturbations produce the same phenotypes more often than expected by chance (Additional file 2: Figure S2). This observation holds for all combinations of circuit sizes N, interaction densities c, and distances d between s0 and s ∞native we examined (Table 1; Wilcoxon signed-rank test; p < 2.2 × 10 -16 in all cases). Thus,
genotypes that require a single mutation to reach the genotype network of a phenotype Pnew also tend to produce Pnew as an alternative phenotype. Similar circuits produce a similar spectrum of alternative phenotypes
Genotypes producing a new phenotype s ∞new through plasticity, but that are not themselves neighbors of s ∞new ’s genotype network may still aid in the genetic stabilization of s ∞new . This could occur if neighboring genotypes typically produce the same alternative phenotypes [condition iii)]. In this case, mutations that preserve s ∞new as an alternative phenotype can make it easier to reach s ∞new ’s genotype network. Motivated by these considerations, we asked whether similar circuits produce similar sets of alternative phenotypes. We use the symbol Ps 0 to refer to the set of alternative phenotypes that a circuit genotype G produces after non-genetic perturbations. Ps 0 ,k refers to the set of alternative phenotypes that a genotype differing from G in k regulatory interactions, but residing on the same genotype network produces. We define the index C k =
| Ps 0 ∩ Ps 0 , k | . It varies from zero to min(| Ps 0 |,| Ps 0 ,k |)
one as the two sets of alternative phenotypes range from completely disjoint to fully overlapping. Similar circuit genotypes produce similar sets of alternative phenotypes (Figure 3). Genotypes that differ in a
Table 1 Mutations and perturbations in the initial condition s0 produce the same phenotypes more often than expected by chance Sample sizea
N
c
d
Mean C ± S.E.
p-value
8
0.4
0.125
0.528 ± 0.006
< 2.2 × 10⁻¹⁶
5485
0.25
0.496 ± 0.006
< 2.2 × 10
-16
5905
0.5
0.557 ± 0.005
< 2.2 × 10⁻¹⁶
7269
0.125
0.442 ± 0.006
< 2.2 × 10⁻¹⁶
5885
0.25
0.398 ± 0.006
< 2.2 × 10
-16
6050
0.5
0.349 ± 0.005
< 2.2 × 10⁻¹⁶
7144
0.1
0.712 ± 0.006
< 2.2 × 10⁻¹⁶
5247
-16
6432
0.3
20
0.3
0.2
0.1
0.25
0.8 ± 0.005
0.5
0.885 ± 0.003
< 2.2 × 10⁻¹⁶
8055
0.1
0.63 ± 0.006
< 2.2 × 10⁻¹⁶
5318
0.25
0.645 ± 0.006
< 2.2 × 10⁻¹⁶
5699
0.5
0.711 ± 0.005
< 2.2 × 10
-16
7102
0.1
0.47 ± 0.006
< 2.2 × 10⁻¹⁶
6036
0.25
0.408 ± 0.006
< 2.2 × 10⁻¹⁶
6058
0.364 ± 0.005
-16
6776
0.5
< 2.2 × 10
< 2.2 × 10
C >Crand, according to a Wilcoxon signed-rank test. In this and all other tables, N refers to the number of genes in a circuit, c refers to the circuit’s interaction density, and d refers to the fraction of gene activity differences between the unperturbed initial condition s0 and the native phenotype s native . ∞ a Even though we sampled 104 genotypes for each genotype network, we discarded genotypes in which either Pμ or Ps was empty. 0
Figure 3 The more similar two circuit genotypes are, the higher the overlap between their sets of alternative phenotypes. The number k represents the distance (in the number of differing regulatory interactions) between two circuits. Ck measures the similarity between the sets of alternative phenotypes produced by the two circuits. The plot shows mean values and the length of error bars represents one standard error. Spearman’s r = -0.248; p < 2.2 × 10⁻¹⁶. The inset shows that the fraction of genotype pairs that share a given alternative phenotype decreases with k. Data are based on 104 randomly sampled focal circuits with N = 20, c ≈ 0.2, and d= 0.1.
Espinosa-Soto et al. BMC Evolutionary Biology 2011, 11:5 http://www.biomedcentral.com/1471-2148/11/5
Page 6 of 14
single mutation share, on average, more than 93% of their alternative phenotypes (C1 > 0.93). High similarity in alternative phenotypes also holds after variation on values of N, c and d (Table 2). Figure 3 also illustrates how Ck decreases as two circuits diverge. Circuit distance k and Ck are negatively associated for all values of N, c and d that we examined (Table 2; Spearman’s r; p < 2.2 10-16 in all cases). In addition, for each of 104 circuits on the same genotype network, we picked randomly one of the circuit’s alternative phenotypes. We asked whether genotypes in the same genotype network but differing from the focal genotype in k regulatory interactions also produced the alternative phenotype through plasticity. More than half
Table 2 The higher the similarity between two circuits is, the higher is the overlap between their sets of alternative phenotypes Mean C1 ± S.E. (Sample sizea)
Spearman’s r
p-value
8 0.4 0.125
0.95 ± 0.002 (9124)
-0.279
< 2.2 × 10-
0.25
0.956 ± 0.002 (9248)
-0.247
< 2.2 × 10-
0.5
0.968 ± 0.002 (9499)
-0.193
< 2.2 × 10-
0.3 0.125
0.933 ± 0.002 (9408)
-0.295
< 2.2 × 10-
0.25
0.94 ± 0.002 (9459)
-0.27
< 2.2 × 10-
0.5
0.963 ± 0.002 (9649)
-0.206
< 2.2 × 10-
0.1
0.968 ± 0.002 (8712)
-0.237
< 2.2 × 10-
0.25
0.97 ± 0.002 (8910)
-0.201
< 2.2 × 10-
0.5
0.98 ± 0.001 (9403)
-0.153
< 2.2 × 10-
0.1
0.962 ± 0.002 (9216)
-0.248
< 2.2 × 10-
0.25
0.965 ± 0.002 (9179)
-0.214
< 2.2 × 10-
0.5
0.977 ± 0.001 (9440)
-0.178
< 2.2 × 10-
0.1
0.948 ± 0.002 (9675)
-0.255
< 2.2 × 10-
0.25
0.957 ± 0.002 (9696)
-0.237
< 2.2 × 10-
0.5
0.966 ± 0.002 (9748)
-0.189
< 2.2 × 10-
N
c
20 0.3
0.2
0.1
d
16
16
16
16
16
16
16
16
16
16
16
16
16
16
16
This overlap decreases with the genetic distance between the circuits, according to Spearman’s r, a non-parametric rank correlation coefficient [76]. C1 is the overlap in the sets of alternative phenotypes of two genotypes that differ in a single regulatory interaction. a We sampled 104 independent genotypes for each parameter combination, but we discarded genotypes that differ in k interactions where Ps0,k was empty.
of the genotypes that differ from the focal genotype by five or fewer mutations also produced the same alternative phenotype (inset in Figure 3 and Table 3). For all values of N, c and d we examined, the probability that two genotypes produce the same alternative phenotype was above 0.8 for genotypes that differ in a single regulatory interaction (Table 3). This probability decreases with the number k of regulatory interactions in which two circuits differ (Figure 3 and Table 3). In sum, similar circuits have better odds to produce the same alternative phenotype. Thus, genotypes that produce an alternative phenotype s ∞new but that are not neighbors of s ∞new ’s genotype network can have indirect mutational access to this network. Other genotypes that can produce s ∞new as an alternative phenotype may provide this access, enabling genetic stabilization of the new phenotype. Genetic distance to a new genotype network is negatively correlated to a phenotype’s penetrance
Thus far, we demonstrated that conditions i) through iii) of our evolutionary scenario hold. We now turn to condition iv). This condition requires that circuits with a high penetrance alternative phenotype Pnew have preferential (mutational) access to P new’s genotype network, where this phenotype is native. We next show in several complementary ways that this is the case. We quantified the penetrance of a given phenotype as the fraction of different single-gene expression perturbations in a circuit’s initial state that produce this phenotype. We then assessed whether a phenotype’s penetrance is linked to a circuit’s proximity to a new genotype network, as follows (Figure 4a). We first chose a genotype G at random among all genotypes in a predetermined genotype network. Second, we determined G’s alternative phenotypes and their penetrance. Third, we chose one of the alternative phenotypes at random, regardless of its penetrance, and called it s ∞new . Fourth, we estimated the distance of G to the genotype network of s ∞new (see Methods). We repeated this procedure for 10 4 genotypes for each combination of values of N, c and d that we examined. Figure 4b illustrates our findings. The horizontal axis shows a phenotype’s penetrance, and the vertical axis the distance to the new genotype network. The area of each circle reflects the number of genotypes in each penetrance/mutational distance category. Starting from a genotype that produces an alternative phenotype s ∞new , one to two mutations are generally sufficient to reach s ∞new ’s genotype network. Figure 4b also shows that distance to a new genotype network decreases with increasing penetrance. The inset focuses on the fraction of genotypes that require a single mutation to reach the new genotype network. This fraction increases - new
Espinosa-Soto et al. BMC Evolutionary Biology 2011, 11:5 http://www.biomedcentral.com/1471-2148/11/5
Page 7 of 14
Table 3 The probability that two circuit genotypes share an alternative phenotype decreases with their genotypic distance N 8
c 0.4
0.3
20
0.3
0.2
0.1
d
Fraction of genotypes that share a specific phenotype after k mutations. k=1
k=2
k=3
k=4
k=5
0.125
0.854
0.749
0.664
0.593
0.546
0.25
0.874
0.777
0.706
0.645
0.6
0.5
0.911
0.839
0.786
0.748
0.713
0.125
0.869
0.768
0.691
0.624
0.568
0.25
0.882
0.787
0.716
0.657
0.606
0.5
0.925
0.863
0.809
0.765
0.727
0.1
0.826
0.718
0.644
0.59
0.546
0.25
0.85
0.753
0.687
0.646
0.619
0.5
0.907
0.849
0.804
0.774
0.75
0.1
0.874
0.776
0.701
0.643
0.596
0.25
0.877
0.782
0.719
0.663
0.617
0.5
0.913
0.85
0.799
0.762
0.73
0.1
0.913
0.848
0.784
0.728
0.676
0.25
0.924
0.857
0.797
0.743
0.701
0.5
0.939
0.891
0.849
0.811
0.779
Figure 4 Genetic distance to a genotype network is negatively correlated with a phenotype’s penetrance. (a) The leftmost circle represents a genotype G, where an alternative phenotype s ∞new has a given penetrance (red sector). We quantified the penetrance of s ∞new in G as the fraction of single-gene perturbations of the initial condition s0 that produce s ∞new . We determined genetic distance as the smallest number of mutations required to reach s ∞new ’s genotype network (rightmost circle). (b) The horizontal axis shows the penetrance of a phenotype s ∞new . The vertical axis shows the distance to s ∞new ’s genotype network. A circle’s area is proportional to the number of data points in each penetrance and mutational distance category. The panel is based on 104 circuit genotypes with N = 16 genes, c ≈ 0.35, and d = 0.25. Penetrance and genetic distance to the new genotype network are negatively associated (Spearman’s r = -0.293; p < 2.2 × 10¹⁶ ). The inset shows that the fraction of genotypes that are neighbors of the new genotype network increases with penetrance.
genotype networks become easier to reach - as the penetrance of alternative phenotypes increases. The distance to a new genotype network decreases with increasing penetrance in all parameter combinations that we examined (Table 4; Spearman’s r; p < 2.2 × 10¹⁶ in all cases). The same holds when we consider alternative phenotypes produced by the perturbation of two instead of just one gene in the initial condition (Additional file 3: Analysis S1). We performed two additional complementary analyses, that we present in the Additional files. In the first analysis we found that genotypes that produce an alternative phenotype with high penetrance have more mutational paths towards the genotype network of that phenotype (Additional file 4: Analysis S2). In the second analysis we compared two kinds of sequences of mutations: those that increase the penetrance of an alternative phenotype s ∞new and those that merely preserve the alternative phenotype s ∞new , regardless of its penetrance. We show that the former kind of mutations facilitates the arrival to s ∞new ’s genotype network (Additional file 5: Analysis S3). Taken together, the observations in this section show that the genotype network of a new phenotype is closer and easier to reach from genotypes where a new phenotype has high penetrance. Plasticity accelerates the discovery of new genotype networks
Thus far, all our results support that plasticity facilitates discovery and stabilization of new phenotypes. We next asked more directly whether this is the case, by analyzing
Espinosa-Soto et al. BMC Evolutionary Biology 2011, 11:5 http://www.biomedcentral.com/1471-2148/11/5
Page 8 of 14
Table 4 Genetic distance to a new genotype network decreases with increasing penetrance N
c
d
Spearman’s r
p-value
8
0.4
0.25
-0.268
< 2.2 × 10⁻¹⁶
0.125
-0.211
< 2.2 × 10⁻¹⁶
0.3
0.25
-0.218
< 2.2 × 10⁻¹⁶
0.35
0.25
-0.293
< 2.2 × 10⁻¹⁶
0.25
0.125
-0.263
< 2.2 × 10⁻¹⁶
0.25
-0.306
< 2.2 × 10⁻¹⁶
0.3
0.25
-0.26
< 2.2 × 10⁻¹⁶
0.2
0.1
-0.269
< 2.2 × 10⁻¹⁶
0.25
-0.33
< 2.2 × 10⁻¹⁶
0.5
-0.4
< 2.2 × 10⁻¹⁶
0.25
-0.23
< 2.2 × 10⁻¹⁶
16
20
0.1
Data for each parameter combination is based on 104 different circuits and on the non-parametric rank correlation coefficient Spearman’s r [76].
populations of circuits subject to repeated cycles of mutation and selection. We started by establishing a population of M = 103 identical circuits. These circuits produce a phenotype s ∞native from an initial state s0. We assigned individuals with this native phenotype a fitness (survival probability) ωnative < 1. Then, we chose a random gene activity phenotype s ∞new as the target of an evolutionary search. We assigned individuals adopting s ∞new a fitness of ωnew = 1. Starting from our initial population, we then carried out two parallel evolutionary simulations. In both we changed the population through repeated generations of replication, mutation and selection (see Methods). In the first kind of simulation, we randomly perturbed each circuit’s initial state every generation. We did so by perturbing each gene’s initial activity state with a probability a. Then, we followed the circuit’s gene activity dynamics, until the circuit attained its stable gene activity phenotype. We note that two circuits with the same genotype may produce different phenotypes because of these perturbations. We kept the rate of perturbation a low enough so that in most individuals the initial condition remained unperturbed. In the second, parallel ‘control’ simulation, we never perturbed the initial condition. Here, individuals needed to ‘discover’ the novel phenotype exclusively through mutation. In both simulations we recorded two quantities. The first is the time (in generations) until the first individual in the population ‘discovers’ the genotype network of s ∞new . We call these times t *,plast and t *,control for the simulations with plasticity and the control simulations. The second is the time, from either t*, plast or t*, control, until at least one quarter of the population lies in the new genotype network. We call these times t 0.25, plast and t0.25, control, respectively.
Figure 5 Plasticity affects the speed of novel phenotype acquisition. (a) Populations find a novel genotype network faster when plasticity is allowed. The symbol t*, plast refers to the number of generations that a population of circuits needs to discover a specific genotype network when we allow plasticity. The symbol t*, control refers to the same number, but for populations without plasticity. Wilcoxon signed-rank test; p < 2.2 × 10⁻¹⁶. (b) Plasticity slows the accumulation of individuals in the new genotype network. The symbol t0.25,plast stands for the number of generations that a population in which we allow plasticity needs to have at least 25 percent of its circuits in the new genotype network (after its discovery by a single individual); t0.25,control corresponds to the same number but without plastic phenotypes. Wilcoxon signed-rank test; p < 2.2 × 10⁻¹⁶. Both panels include data from 498 independent pairs of populations. Parameter values for both panels: N = 8, c ≈ 0.4, d = 0.25, μ = 0.5, a = 0.05, M = 1000, ωnative = 0.5.
Figure 5a illustrates that populations in which we allow plasticity usually discover the new genotype network - a genetically determined novel phenotype - faster than control populations (t*,plast