Phosphorus Solubility in Response to Acidification of Dairy Manure Amended Soils C. J. Penn* Dep. of Plant and Soil Science Oklahoma State Univ. 367 Agricultural Hall Stillwater, OK 74078-1020
R. B. Bryant USDA-ARS Pasture System and Watershed Management Research Unit 3702 Curtin Rd. State College, PA 16802 Manure additions beyond crop P needs result in accumulated soil Ca phosphate (Ca-P). Although stable near neutral pH levels, there is concern about the solubility of accumulated soil Ca-P when soil pH conditions become acidic, potentially releasing water-soluble P (WSP). The purpose of this study was to examine changes in WSP among non-acidic, Ca-P-accumulated soils in response to six levels of acidification and acidification timing. Two soils that historically received excessive dairy manure were incubated for 8 wk with pH adjusted by single-point or gradual acid additions. After 8 wk, acid additions ceased and WSP, Mehlich-3 P (M3-P), and pH were determined before continuing the incubation for two additional weeks. Soil pH had little effect on M3-P, while acidification timing interacted with the effect of pH on WSP concentrations. After 8 wk, single-point acidification resulted in WSP decreases with decreasing pH, but gradual acidification showed the opposite effect in the pH range 4.5 to 6.5. This effect disappeared after two additional weeks of incubation, resulting in overall decreased WSP concentrations. Results suggested that among the high-P (Ca-P) soils used in this study, which contained significant Fe and Al, acidification did not increase WSP beyond the original concentrations since dissolved Ca-P was resorbed onto soil Fe and Al. This subsequent resorption of P was not immediate, however, and was dependent on kinetics. Overall decreases in soil WSP resulting from acidification is beneficial to water quality through prevention of nonpoint dissolved P losses from soils to surface waters.
NUTRIENT MANAGEMENT & SOIL & PLANT ANALYSIS
Abbreviations: Ca-P, calcium phosphate; M3-P, Mehlich-3 extractable phosphorus; WSP, water-soluble phosphorus.
INCREASED P CONCENTRATIONS in surface waters can contribute to algal blooms and subsequent eutrophication, resulting in the depletion of O2 and potential fish kills (Correll, 1998; Foy and Withers, 1995). Excessive soil P concentrations have been linked to surface water quality degradation in economically important watersheds such as Chesapeake Bay and the Eucha-Spavina of Arkansas and Oklahoma, with agricultural soils identified as significant P sources Soil Sci. Soc. Am. J. 72:238-243 doi:10.2136/sssaj2007.0071N Received 20 Feb. 2007. *Corresponding author (
[email protected]). © Soil Science Society of America 677 S. Segoe Rd. Madison WI 53711 USA All rights reserved. No part of this periodical may be reproduced or transmitted in any form or by any means, electronic or mechanical, including photocopying, recording, or any information storage and retrieval system, without permission in writing from the publisher. Permission for printing and for reprinting the material contained herein has been obtained by the publisher.
238
(Carpenter et al., 1998; Daniel et al., 1994). Many high-P soils occur in areas of concentrated animal agriculture and are a result of continuous manure applications based on crop N requirements that have resulted in P applications beyond plant requirements and subsequent P accumulation (Sims et al., 2002). Although P losses from agricultural soils are typically reduced with erosion control measures, soils with increased P concentrations can still potentially contribute significant soluble P loads even when erosion is minimal (Vadas et al., 2005). Often animal manures are typically high in various types of calcium phosphates (Ca-P). The presence of calcium phosphates (octocalcium phosphate, dicalcium phosphate) in liquid cattle manures was identified in a study by Fordham and Schwertmann (1977). Among a comparison of different biosolids and poultry litter, Penn and Sims (2002) found that 19% of poultry litter total P was in the form of Ca-P. Dou et al. (2003) showed that dairy, swine, and poultry litter samples consisted of 3, 30, and 41% HCl-extractable P (i.e., Ca-P), respectively, using the Hedley P fractionation scheme. Kalbasi and Karthikeyan (2004) showed that dairy manure had a Ca/P molar ratio of 2.73, suggesting significant manure Ca-P concentrations. In a survey of water-soluble P (WSP) among 140 livestock manure samples (beef, dairy, broilers, layers, swine, and turkey), Kleinman et al. (2005) found that WSP was significantly and positively correlated with water-soluble Ca in dairy cattle and swine manures, also suggesting a Ca-P form. As expected, the continuous addition of Ca-P-rich manures to soils can lead to the accumulation of soil Ca-P (Nair et al., 1995; Beauchemin et al., 2003; Josan et al., 2005; Sato et al., 2005; Penn and Bryant, 2006a). For example, Sharpley et al. (2004) determined that among soils from 20 different sites (Oklahoma, New York, and Pennsylvania), those that received regular manure applications (swine, dairy, or poultry) were significantly higher in Ca-P than unamended soils, as estimated by sequential fractionation and speciation modeling. Sato et al. (2005) identified Ca-P as the dominant P form in poultry manure and long-term poultry-amended soils (compared with unamended soils) using x-ray absorption near-edge structure spectroscopy and sequential fractionation. High concentrations of Ca-P in soils can have a profound effect on P solubility and thus the potential for nonpoint-source losses of dissolved P in runoff. Solubility of Ca-P is lowest at near-neutral pH. For example, brushite, monetite, octacalcium phosphate, tricalcium phosphate, and hydroxyapatite show minimum solubility and have sharp changes in P solubility occurring at pH 7 to 8 when the soluble Ca concentration is 10−2.5 mol L−1 or is fixed by calcite; the pH of this minimum solubility point will decrease with increasing Ca concentration. Solubility increases with increasing pH as CaCO3 begins to precipitate, thereby removing Ca from solution (Lindsay, 1979). Solubility also increases as soils become more acidic. Therefore, the stability of insoluble forms of soil Ca-P is mainly a function of soil pH. In their study of poultry-manure-amended soils, Sato et al. (2005) suggested that acidification of Ca-P-dominated soils would increase P solubility (due to the dissolution of Ca-P), thereby increasing the risk of P leaching or loss in runoff. Since noncalcareous agricultural soils in humid leaching environments naturally acidify when pH is not maintained through lime or manure additions, the maintenance of soil pH becomes an important issue among high-Ca-P soils in regard to water quality. The objective of this study was to determine how the
SSSAJ: Volume 72: Number 1 • January–February 2008
degree and timing of acidification affects P solubility among high-P soils that previously received large amounts of dairy manure.
MATERIALS AND METHODS Soil Collection and Characterization Soils 1 and 2 originated from two different dairy farms located in Lancaster County, Pennsylvania, representative of high animal intensity production on a restricted land base. These sites were described in a rainfall simulation study by Penn and Bryant (2006b). Both soils were a Lindside silt loam (fine-silty, mixed, mesic Fluvaquentic Eutrochrepts), sampled at the top 5 cm for initial characterization and used in incubation studies (described below). Both soils were air dried and sieved (2 mm) before characterization. Each site was located between a barn and a stream and historically received a very high amount of animal traffic and manure deposits as animals were fed or moved to pasture through this area. Background characterization included the following: Water extraction of P was conducted by shaking 2 g of air-dried soil with 20 mL of deionized (DI) water end over end for 1 h, followed by centrifuging (2500 rpm for 5 min) and filtering with 0.45-μm membranes. Background soil Mehlich-3 P (M3-P), Ca, Mg, and K concentrations were determined on soils from each site by shaking 2 g of air-dried soil with 20 mL of Mehlich 3 solution (0.2 mol L−1 CH3COOH + 0.25 mol L−1 NH4NO3 + 0.015 mol L−1 NH4F + 0.13 mol L−1 HNO3 + 0.001 mol L−1 ethylenediamine tetraacetic acid [EDTA]) end over end for 5 min followed by filtration with Whatman no. 1 paper (Mehlich, 1984). Background soil ammonium oxalate P, along with Al and Fe (Alox and Feox, respectively) concentrations were measured on soils from each site using a 1:40 ratio of soil to 0.2 mol L−1 ammonium oxalate (pH 3), 2-h reaction time in the dark, and filtration with Whatman no. 42 paper (McKeague and Day, 1966). The ratio of ammonium oxalate extractable P to (Al + Fe), referred to as the degree of P saturation (DPSox), was expressed as: P (Al + Fe)α
with all values in millimoles per kilogram. The empirical constant α is used to relate soil P sorption capacity to Alox and Feox and the denominator acts to express the effective total soil P sorption maximum. For the sake of comparison to other studies, we assumed an α value of 0.5 (Pautler and Sims, 2000; Sims et al., 2002). The ratio of Mehlich-3 P to (Al + Fe) was determined in the same manner, but without the use of the empirical constant, as recommended by Sims et al. (2002). This is referred to as Mehlich-3 degree of P saturation (DPSM3). All Ca, Mg, K, P, Al, and Fe in the extracts were measured with inductively coupled plasma atomic emission spectroscopy (ICP– AES). Soil pH was measured in a 1:1 soil/DI water slurry using a pH electrode. Sand, silt, and clay contents were estimated by the hydrometer method (Day, 1965) and organic matter was estimated by loss-onignition (Nelson and Sommers, 1996). Cation exchange capacity was determined at pH 7 by the ammonium saturation method (Sumner and Miller, 1996). In addition, P forms were identified and estimated for the two unincubated soils by use of chemical speciation modeling and a sequential P chemical fractionation. Saturated paste water extractions were conducted in triplicate at a 1:5 soil/DI water ratio, shaking end over end for 16 h, followed by centrifuging (2500 rpm for 5 min) and filtering with 0.45-μm membranes. All extracts were analyzed for P, K, Ca, Mg, Al, and Fe by ICP–AES. Solution pH and ionic strength (as SSSAJ: Volume 72: Number 1 • January–February 2008
estimated by electrical conductivity [Griffin and Jurinak, 1973]) was also measured on each water extract. The data from the water extracts were used to predict the presence of solid mineral phases in the original samples as determined by the MINTEQA2 speciation model (Allison et al., 1991). Soil P was fractionated in triplicate according to the procedure of Hedley et al. (1982). This involved sequentially extracting P from 1 g of soil with 30 mL of DI water, 30 mL of 0.5 mol L−1 of NaHCO3 (pH 8.5), 30 mL of 0.1 mol L−1 NaOH, and 30 mL of 1 mol L−1 HCl. Between each fractionation step, extracts were centrifuged (2500 rpm for 10 min) to separate the soil from the extracting solution, which was then filtered through Whatman no. 42 paper. All solutions were analyzed for P by ICP–AES.
Acid-Amended Soil Incubation Soil pH buffer curves were established by the titration method. This involved adding 1 mL of 0.5 mol L−1 HCl every 20 min to a 10-g soil sample suspended in 10 mL of DI water while stirring on a magnetic stir plate until the pH reached 4.5. Suspension pH was measured with a pH electrode before each acid addition (i.e., after 20 min of stirring and equilibration). Data from the pH titration curves were used to calculate the equivalents of acid necessary for adjusting 200 g of each soil to reach a target pH of 7.5, 7.0, 6.5, 6.0, 5.5, and 5.0 for the soil acidification treatments. Acid additions were separated into two different treatments: single-point acid addition in which all acid required to reach the target pH was added at the initiation of the incubation; and gradual acidification in which the same total amount of acid was split into eight different applications (one per week for 8 wk). For both acid treatments, 200 g of soil was placed in plastic cups (after being air dried and sieved to 2 mm) and mixed with the appropriate amount of acid in a volume of DI water that would result in 25% (w/w) moisture content. Each target pH (7, including an unamended control) was replicated three times for a total of 21 observational units for each soil and acid treatment (single-point acidification and gradual acidification). During the first week of incubation, all soils were allowed to dry. Each soil was then thoroughly mixed to ensure that the previously added acid was mixed throughout. Soils were then brought back up to 25% moisture; from that point until the cessation of the incubation, the single-point acid addition soils were simply maintained at the 25% moisture level. On a weekly basis, the gradual acid addition soils were also brought up to 25% moisture, the difference being that the proper amount of acid was additionally mixed into the DI water used to maintain moisture. After 8 total wk of incubation, all soils were air dried and mixed in preparation for analysis. Each soil was analyzed for WSP, M3-P, and pH as described above. Based on the results of that analysis (opposite trends for the WSP vs. pH relationship depending on acidification timing), soils were placed back into cups and incubated at 25% moisture content (no acid addition) for an additional 2 wk. At the end of the additional 2 wk (10 wk total), soils were again air dried and mixed in preparation for the same analyses.
RESULTS AND DISCUSSION Background Soil Properties Soils 1 and 2 are considered “excessive” in terms of soil test P as estimated by Mehlich-3 extract (Table 1), compared with optimum agronomic M3-P levels of 50 mg P kg−1 (Beegle, 2002). These soil M3-P values also greatly exceed environmental P threshold values of 150 mg kg−1, as recommended by Sims et al. (2002). Due to high soil 239
Table 1. Background properties of soils used in the acidification experiment. Soil
P†
Ca
K
Mg
Pox/(Alox + Feox)‡
PM3/(AlM3 + FeM3)‡
kg−1
1 2
——— ——— mg 932 4389 1858 932 846 4366 2065 870
CEC§
pH
Sand
8.2 7.6
—————— % —————— 39.8 46.5 13.7 5.4 29.0 50.2 20.9 6.3
kg−1
1.45 1.52
3.03 4.21
cmolc 27.5 27.5
Silt
Clay
Organic matter
† Mehlich-3 extractable P, Ca, K, and Mg. ‡ Calculated from molar concentrations; ox = ammonium oxalate extractable with use of 0.5α value; M3 = Mehlich-3 extractable. § Cation exchange capacity.
P values, these soils clearly represent a potential P source to surface waters. Both soils have a loam texture and are similar in Mehlich-3 extractable Ca, K, and Mg concentrations (Table 1). Soil pH (8.2 and 7.8 for Soils 1 and 2, respectively) was higher than expected for typical noncalcareous soils of Pennsylvania. Higher than normal organic matter contents, pH, and extractable P, Ca, K, and Mg (Table 1) also indicated that these soils have been impacted by the continuous addition of dairy manure. The high pH combined with unusually high M3-P and Ca values suggested that these soils may contain Ca-P. Dairy manure typically has a pH >7.0 (Chaubey et al., 1994; Sharpley and Moyer, 2000; Kleinman et al., 2002; Moller et al., 2002), which supports stable Ca-P minerals. The presence of CaP in dairy manure and the subsequent accumulation of Ca-P in soils receiving dairy manure can be explained by the large amounts of Ca-P supplemented to the animals’ diet in the form of dicalcium phosphate and defluorinated phosphate (Wu and Ishler, 2002; National Research Council, 1998) and added Ca and Mg in the forms of dolomitic limestone and MgO, resulting in a pH >7.0. Further evidence for the accumulation of Ca-P is found in the MINTEQA2 speciation modeling data and the results of the sequential P fractionation. Using solution parameters obtained from the 1:5 soil/solution saturated paste extraction, MINTEQA2 predicted the
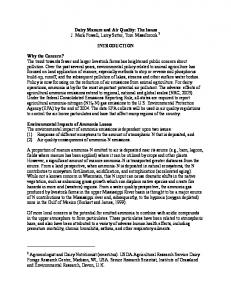
Fig. 1. Effect of soil pH and rate of pH adjustment on soil Mehlich 3-P (M3-P) concentrations for Sites 1 and 2 after 8-wk incubation. Single-point acidification = all acid added at incubation initiation; gradual acidification = acid applied in eight increments (one application per week). 240
presence of hydroxyapatite in both soils. In addition, P concentrations within the bicarbonate- and acid-extractable (1.0 mol L−1 HCl) P pools of the Hedley fractionation, considered to represent loosely bound P and Ca-P, were similar to those of manure-impacted, CaP-rich soils described by Sharpley et al. (2004). Soil 1 contained bicarbonate- and acid-extractable P concentrations of 434 and 175 mg P kg−1, respectively, while Soil 2 had 514 and 255 mg P kg−1, respectively. For comparison, unamended check soils of Sharpley et al. (2004) contained bicarbonate- and acid-extractable P concentrations of 26 to 103 and 7 to 99 mg P kg−1, respectively. Among alkaline soils such as those used in this study, the bicarbonate-extractable P pool of the Hedley fractionation is considered to remove a significant portion of the Ca-P pool through precipitation of Ca as CaCO3, thus releasing P bound with Ca (Kuo, 1996). Bicarbonate- plus acid-extractable P was 49 and 57% (percentage of the sum of all fractions) for Soils 1 and 2, respectively.
Acidification of Calcium Phosphate Dominated Soils: Gradual Acidification vs. Immediate Acidification The plots shown in Fig. 1 indicate that soil M3-P concentrations do not appear to be strongly influenced by the timing of acidification or pH. In other words, the relationship between soil M3-P and pH is similar for single-point acid addition and gradual acid addition. This observation can be explained by the strength of the Mehlich-3 extraction solution and its ability to extract various weakly bound P forms; i.e., Mehlich-3 is efficient at extracting weakly bound Al-related P, Ferelated P, and Ca-P. Consequently, although soil P forms may change in response to changing pH or acidification timing, the Mehlich-3 solution is still able to extract nearly the same amount of P. In contrast, WSP is much more sensitive to changes in P form in response to changing pH and acidification timing. Acidification timing had a strong effect on the relationship between pH and WSP concentrations (Fig. 2). Adding all the acid in a single application at the initiation of the 8-wk incubation period (single-point acidification) resulted in a linear decrease in WSP with decreasing pH. This decrease in WSP with pH can be explained by dissolution of Ca-P and subsequent resorption onto soil Al and Fe minerals, which tend to be less soluble than Ca-P at a pH